
ABSTRACT
Individuals differ in the time needed to name a picture. This contribution asks whether this inter-individual variability emerges in earlier stages of word production (e.g. lexical selection) or later stages (e.g. articulation) and examines the consequences of this variability for EEG group results. We measured participants’ (N = 45) naming latencies and continuous EEG in a picture-word interference task and naming latencies in a delayed naming task. Inter-individual variability in naming latencies in immediate naming (in contrast with inter-item variability) was not larger than the variability in the delayed task, suggesting that some variability in immediate naming originates in later stages of word production. EEG data complemented this interpretation: Differences between relatively fast vs. slow speakers emerged in response-aligned analyses in a time window close to the vocal response. We additionally present a method to assess the generalisability of the timing of effects across participants based on random sampling.
The aim of psycholinguistics is to describe the cognitive system that allows individuals to produce and comprehend language. Work in the field (as in cognitive psychology in general) rests on an important assumption, which is reflected in the methodological approach. This assumption is that a common (universal) architecture is reflected in the group behaviour. Inter-individual differences in behaviour are acknowledged, but the assumption is that the common architecture will be visible when filtering out the noise, i.e. inter-individual differences. In the present study, we take a different stance. We join a marginal but perhaps increasing number of studies that examine how inter-individual differences contribute to—and sometimes prevent—a better understanding of word production processes.
We bring together two literatures, both in the field of language production, that make opposite assumptions about inter-individual differences in the time course of language production processes. The first assumes that speakers differ in the time they need to perform specific encoding processes (e.g. Jongman et al., Citation2015; Laganaro et al., Citation2012; Shao et al., Citation2012). The second assumes (albeit implicitly) that encoding processes are synchronous enough across speakers, such that the underlying processes can be targeted with time course measures, e.g. event-related potentials (ERPs, e.g. Bürki, Citation2017b; Krott et al., Citation2019; Rabovsky et al., Citation2021). The first aim of this study is to determine where in the time course of word production these inter-individual differences in naming latencies (time to prepare the vocal response to name a picture of an object) emerge. The functional origin of inter-individual differences in word production processes has crucial theoretical and methodological implications. Inter-individual differences in the timing of encoding processes may render the interpretation of time sensitive measures, such as ERPs, imprecise. The second aim of this study is precisely to examine the consequences of inter-individual variability on group results in ERP studies. Theoretical and methodological implications of inter-individual differences in the timing of encoding processes, as well as relevant literature, are discussed below.
Theoretical implications of individual differences in word production
Although speaking often seems effortless (at least for adults without language impairment), it is not a simple task. According to prominent models of word production, the process of producing a single word is made up of several stages: conceptualisation, lexical selection, phonological encoding, phonetic encoding and execution of articulatory gestures (e.g. Indefrey & Levelt, Citation2004; Indefrey, Citation2011; Levelt, Citation1999). Producing words is not an entirely automatic process, and it is at least partially subject to cognitive resources (e.g. attentional control, Piai et al., Citation2013). Authors typically assume that the encoding processes involved in word production differ in their degree of automaticity, and as a consequence, in the extent to which they rely on available cognitive resources. The lack of automaticity of (a subset of) encoding processes and their reliance on cognitive resources has often been linked to the variability observed in the time needed to encode a vocal response in the naming task. This variability is substantial. In our own work, we have observed mean naming latencies that have ranged between 613 and 1070 ms in a simple picture naming experiment (Valente et al., Citation2014) and between 615 and 924 ms in a picture-word interference task (Bürki, Citation2017a). The large standard deviations reported in most studies corroborate our observations that variability in naming times across participants is substantial.
If certain stages of word production proceed less automatically and instead are susceptible to influences from cognitive resources, we would expect to observe inter-individual differences in these stages, for example, in the time it takes an individual to select a word during the lexical access stage (see for instance Laganaro et al., Citation2012). On the other hand, if some stages of word production proceed automatically, we would not expect much individual variability to emerge in these stages. Understanding this variability (and being able to locate it in the speech production system) will inform us on crucial aspects of this system: its links with cognitive resources, autonomy of the language system, and the degree of automaticity in word production processes.
There is currently no consensus as to which processes or stages of word production are more or less automatic (or variable), despite the number of studies that have addressed this question (see Garrod & Pickering, Citation2007; Hartsuiker & Moors, Citation2017; Jongman et al., Citation2015; Meyer et al., Citation2007; Roelofs, Citation2008). For example, some authors have found evidence of inter-individual differences in later stages of word production, such as phonetic encoding or execution, by correlating measures of attention with word production speed (Jongman et al., Citation2015). However, others have found evidence of individual variability at earlier stages, such as conceptualisation (e.g. Shao et al., Citation2012) or lexical selection (Ferreira & Pashler, Citation2002). A few EEG studies additionally suggest that individuals vary in their speed of lexical selection (e.g. Laganaro et al., Citation2012; Shao et al., Citation2014). For instance, Laganaro et al. (Citation2012) compared ERPs, both aligned on the picture presentation and on the vocal response, of slow and fast speakers. They found differences across speed groups only between 200 and 300 ms after picture onset, a time window they relate to lexical selection (but see below).
Taken together, these findings confirm that word production is not an entirely automatic process and that participants vary in the time it takes them to prepare a linguistic response for production. However, the locus of this variability is not yet well understood, i.e. we still do not have a complete picture of where in the process of word production participants are most variable. In most studies, the link between variability observed in the behaviour of participants and a specific encoding process requires additional assumptions (e.g. semantic interference reflects lexical access, Ferreira & Pashler, Citation2002; gaze durations reflect phonological encoding, Jongman et al., Citation2015; name agreement effects only arise during lexical access, Shao et al., Citation2014). More research is clearly needed to clarify this issue (see also commentary by Laganaro, Citation2016). As discussed in the next section, the locus of this inter-individual variability may have important methodological consequences for studying the time course of word production.
Methodological implications of individual variability in the time course of word production
In the last ten years, an increasing number of studies have used measurements with high temporal resolution, such as MEG or EEG, to examine word production processes (e.g. Ganushchak et al., Citation2011; Munding et al., Citation2015; Strijkers et al., Citation2010). Several contemporary issues require fine grained information about the time course of events, i.e. how the activation flows in the system or the degree of seriality of encoding processes (e.g. sequentially vs. parallelism in underlying encoding processes, Costa et al., Citation2009; Miozzo et al., Citation2015; Munding et al., Citation2015; Riès, Citation2016). Measures with high temporal precision, such as EEG or MEG, can be used for these purposes. However, temporal precision in EEG and MEG can only be achieved if neural activity is synchronous across participants. Observed differences in response times, together with claims that encoding processes involve domain-general cognitive resources whose availability varies among individuals (see above), are difficult to reconcile with this synchronicity assumption.
As reviewed above, several studies argue that participants vary in the time they need to access lexical representations. This claim has crucial implications for EEG studies. The cognitive processes underlying language production are not signalled by well-known components, as can be the case in other fields (e.g. N400 and P600 in language comprehension, N170 in face processing). As a result, the time course of experimental effects is often taken as an indicator of underlying encoding processes. For instance, the estimates of the time course (onset, duration) of encoding processes (i.e. conceptualisation, lexical access, phonological encoding) provided by Indefrey (Citation2011) or Indefrey and Levelt (Citation2004) in their meta-analyses are often used to map experimental effects with underlying cognitive processes. According to these authors, in an experimental setup where participants need to produce the name of a picture, assuming several repetitions of the same word and a reaction time of 600 ms, it is estimated that visual recognition and conceptualisation occur up until 175–200 ms after visual onset. Lemma selection then takes place from 200 ms until about 275 ms and is followed by encoding of the phonological form between 275 and 450 ms after picture onset. Finally, phonetic encoding occurs around 450–600 ms, until the initiation of motor execution (Indefrey & Levelt, Citation2004). Many studies use this time course to map a given effect to a given encoding process (e.g. if the effect arises at around 250 ms, it is therefore associated with lexical access). If participants indeed vary in the time they need to complete lexical access (or phonological encoding), this general time course cannot be assumed to generalise across studies that use different groups of participants. Some researchers rescale this time frame proposed by Indefrey and Levelt (Citation2004) to fit longer or shorter response times (see for example Shitova et al., Citation2017). To accurately rescale these time frames, however, we need to determine whether faster speakers are faster in all stages of word production (e.g. Schuhmann et al., Citation2009) or whether faster speakers are faster in only some stages of word production (e.g. Laganaro et al., Citation2009). Establishing exactly which stages of word production are affected by inter-individual variability will help determine which stages’ time frames should be rescaled and by how much (Laganaro, Citation2016).
More generally, if differences in response times are due to differences in the duration of lexical access across participants, stimulus-aligned ERPs can hardly be used to study encoding processes that occur after lexical access. The ERPs monitored during these processes will no longer be aligned across participants, which will make it more difficult to observe significant effects at the group level. Given these considerations, there is an urgent need to establish to what extent participants vary in the timing of (which) encoding processes. As stated above, the aim of this study is precisely to contribute to this endeavour.
Current study
In the current study, we seek to determine where in the time course of word production inter-individual differences emerge. We address this issue in two ways. First, participants performed a picture-word interference task and EEG activity was monitored during the task. In this task, participants have to name pictures and ignore written or spoken distractor words. The relationship between the target and distractor words influences picture naming times. A phonological overlap between the two words speeds up naming times (when compared to unrelated distractor words), and this effect has been argued to originate in the phonological encoding stage, (e.g. Damian & Martin, Citation1999; de Zubicaray et al., Citation2002; Posnansky & Rayner, Citation1977; Rayner & Posnansky, Citation1978; Starreveld & La Heij, Citation1996). Distractor words of the same semantic category slow down naming latencies, when compared to unrelated distractors (e.g. Lupker, Citation1979; Rosinski, Citation1977; Schriefers et al., Citation1990, to cite a few). This effect has been associated with lexical selection (Levelt et al., Citation1999) and/or pre-articulatory processes (Mahon et al., Citation2007; see also Bürki et al., Citation2020 for review). As discussed in the Introduction, none of the processes involved in word production have been associated with a specific ERP component. As a consequence, it is not possible to rely on typical EEG patterns to obtain information about the different processes and their timing. We have argued that individual variability in reaction time that has been observed in many studies of word production does not allow us to generalise the time course of pre-articulatory planning stages proposed by Indefrey and Levelt (Citation2004) to all participants. An alternative way of mapping EEG patterns to underlying cognitive processes is to use experimental manipulations whose effects have been associated with specific encoding processes. In the present study, and following others, we use the phonological facilitation effect as a marker of phonological encoding, and the semantic interference effect as a marker of lexical access and/or later pre-articulatory processes (see e.g. Dell’Acqua et al., Citation2010). Differences in the EEG signal between semantically related and unrelated trials will be interpreted mainly as reflecting lexical access if it occurs in the stimulus-aligned ERPs, shortly after picture presentation, and before the phonological facilitation effect. On the other hand, the effect will be interpreted as reflecting later pre-articulatory processes if it is observed in the response-aligned ERPs, close to the onset of articulation, and after the phonological facilitation effect. Another option would have been to manipulate the items’ properties (e.g. lexical frequency, Strijkers et al., Citation2010; see also Miozzo et al., Citation2015). Both approaches rest on the assumption that effects of the experimental manipulation on the EEG signal can be mapped onto the cognitive process(es) that generated the effects at the behavioural level. We come back to this issue in the General Discussion. We analyse experimental effects in EEG at the group level and perform several analyses (planned and exploratory)Footnote1 to determine how experimental effects vary with participants’ response speed.
Second, we compare the inter-individual variability in naming times in immediate and delayed naming tasks. For this purpose, our participants also named pictures with a delay. Naming times in immediate naming tasks are thought to reflect all processes up to execution of gestures, whereas naming times in delayed tasks are thought to reflect only stages after phonetic encoding (e.g. Laganaro & Alario, Citation2006). By comparing the variability in the two tasks, we obtain information on the amount of variability that arises before/after articulatory execution. We reasoned that if the between-participant variability that we observe in the immediate naming times originates in earlier processes (i.e. mapping between the picture and the concept, lexical access, or phonological encoding), between-participant variability should be much greater in the immediate task than in the delayed task. Moreover, the by-participant mean naming times in the two tasks should not be correlated. By contrast, if a large portion of the variability in response times in the immediate naming task reflects late execution processes, we would expect the variability in the two tasks to be similar, and we would expect to see a relationship between the by-participant mean naming times in the two tasks.
If participants vary in the duration of one or more stages of word production, this might constrain the use of ERPs to target specific encoding processes. For example, if variability is found in lexical selection, stimulus-aligned ERPs may not be an appropriate tool to analyse processes that occur after lexical selection is finalised, as participants’ neural activity will no longer be synchronised. Similarly, if variability is found in late encoding processes, e.g. phonetic encoding, response-aligned ERPs may not be an appropriate tool to study processes that occur earlier, e.g. phonological encoding processes. More generally, if participants vary substantially in the timing of a given encoding process, whether experimental manipulations used to target these processes in a given study will impact the EEG signal, as well as the observed timing of this impact at the group level, will depend on the extent of this variability in the participant sample.
Method
Participants
Forty-five right-handed, native speakers of German (ages 18–30, mean = 23.2, SD = 3.5) completed the experiment. None reported hearing, psychiatric, neurological or linguistic disorders, and their participation was rewarded either by course credit or money. Participants were given details about the experimental procedure and provided their informed consent prior to participation. The study received ethical approval by the ethical committee of the University of Potsdam (Germany).
General procedure
Each participant was tested in three different sessions. In the first session, participants completed three tasks: picture-word interference, delayed naming, and word naming (reading aloud). EEG activity was monitored only while participants performed the picture-word interference task. In the second and third sessions, participants performed a series of standardised cognitive tests that are not reported here. The reading aloud task and the cognitive tasks are described in companion articles (Bürki & Madec, Citation2022; Fuhrmeister, Madec & Bürki, Citationin preparation, see also Footnote 1).
Picture-word interference task
Material. We selected 90 German nouns (thereafter “target words”) and their corresponding object pictures from the Multipic database (see Appendix 1; Duñabeitia et al., Citation2018). Lemma frequencies for these words, according to the dlex database (Heister et al., Citation2011), ranged from 9 to 21184 (mean = 1991.3, SD = 3678.4). In addition, we selected 180 nouns to be used as distractors. A total of 450 stimuli were created by combining the 90 pictures with the distractor words or a line of Xs, so as to form the following five conditions: (1) baseline: the 90 pictures were displayed synchronously with a series of 6 Xs, (2) semantically related: each picture was combined with a distractor noun from the same semantic category (e.g. two animals, two tools), (3) semantically unrelated: this condition was created by assigning the 90 distractors from the semantically related condition to a different picture such that picture and distractor had no semantic or phonological relationship, (4) phonologically related: each picture was displayed with a noun overlapping in the first phoneme(s) with the target word (between 1 and 4 phonemes, mean = 2.62, SD: 0.67), (5) phonologically unrelated: this condition was created by assigning the 90 distractors from the phonologically related condition to a different picture such that picture and distractor had no semantic or phonological relationship.
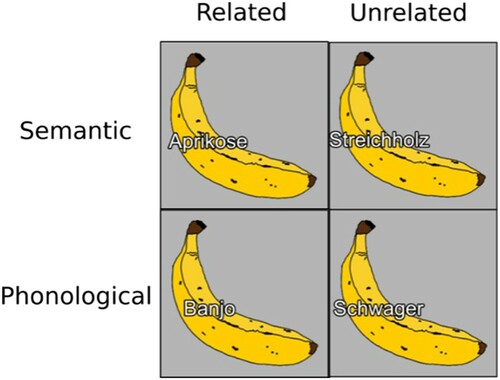
The distractor was superimposed on the picture and was written in white with a black outline in Arial font. Stimulus-onset asynchrony was 0 ms. The first letter was uppercase because German nouns are always capitalised. Pictures and distractors were presented against a grey background. displays the target word banana (Banane in German) with its distractors. Eight additional pictures were selected as training or filler items and associated with 16 new distractor words following the same criteria as for the test items.
Figure 1. Example of stimuli in the picture-word interference task. The target word “Banane” (banana) with a semantically related (Aprikose/apricot), semantically unrelated (Streichholz/match), phonologically related (Banjo/banjo), and phonologically unrelated (Schwager/brother-in-law) distractor. Note that two unrelated conditions were used so as to have the same distractor lists when contrasting a related and unrelated condition.
Task description. The picture-word interference task started with a familiarisation phase. During this phase, pictures (without superimposed distractors) were presented one by one on the screen, together with their name. Participants were instructed to be attentive to the pictures, and to silently read the corresponding word. The task was self-paced; the items were presented in random order.
Next, participants completed the main picture-word interference task. Participants were told to name the pictures displayed on the computer screen as fast and accurately as possible. The task consisted of a short training phase followed by five blocks of test trials. We used a mixed design (as opposed to blocked design), i.e. the trials of the different conditions were mixed in each experimental block. Each target word appeared only once within each experimental block; order of presentation was pseudorandomised in each block, and the number of trials in each condition was equated in each block. Each participant received a different order. Each block started with four filler trials. A trial started with a fixation cross, whose duration ranged between 2200 and 2300 ms. The picture-word pair was then displayed at the centre of the screen for maximally 2300 ms or until a response was given (visual angle of the square: 5.5°, vertical visual angle of the text: 0.6°). Vocal responses were recorded starting from the picture-word onset until 3000 ms after picture onset. The inter-trial interval was a random duration between 1000 and 1200 ms. Continuous EEG was recorded during this task.
Delayed naming task without distractors
Stimuli for the delayed naming task consisted of the same 90 test pictures and 8 additional filler pictures used for the picture-word interference task. A trial had the following structure: A fixation cross first appeared at the centre of the screen. After 700 ms, it was replaced by the picture (without a distractor or line of Xs). The picture stayed on the screen for 1000 msFootnote2, and participants were instructed to wait until a response cue (a blue circle) appeared before naming the picture aloud as quickly as possible. Next, a blank screen replaced the picture for a random duration ranging from 1200 to 2000 ms. Then a blue circle (the response cue) appeared in the middle of the screen and stayed there for 1500 ms. The next trial started after a 300 ms inter-trial interval. The experiment started with eight training items followed by four filler items. The 90 test items were then presented one by one, in random order.
EEG acquisition and pre-processing
Continuous EEG was recorded with a BrainAmp MR amplifier. Sixty-one Ag/Ag-Cl electrodes were positioned according to the extended 10–20 system: Fp1, Fp2, AF7, AF3, AF4, AF8, F7, F5, F3, F1, Fz, F2, F4, F6, F8, FT7, FC5, FC3, FC1, FCz, FC2, FC4, FC6, FT8, T7, C5, C3, C1, Cz, C2, C4, C6, T8,TP7, CP5, CP3, CP1, CPz, CP2, CP4, CP6, TP8, P7, P5, P3, P1, Pz, P2, P4, P6, P8, PO9, PO7, PO3, POz, PO4, PO8, PO10, O1, Oz and O2. FCz was used as the reference electrode during the recording. The sampling rate was set to 1000 Hz. During recording, impedance was kept below 50 kΩ. The signal was amplified and digitalised with an online low cut-off of 10 s and high cut-off of 1000 Hz.
The EEG signal was pre-processed in MATLAB, using the EEGLAB toolbox (Delorme & Makeig, Citation2004). Continuous signals were re-sampled at 500 Hz and recomputed against the average of all electrodes. Data were then filtered with a 0.1 Hz high pass filter (Kaiser windowed sinc FIR filter, order = 8008, beta = 4.9898, transition bandwidth = 0.2 Hz) and a 40 Hz low pass filter (Kaiser windowed sinc FIR filter, order = 162, beta = 4.9898, transition bandwidth = 10 Hz). Continuous EEG signals were segmented into epochs of 4.4s, from 1s before visual stimuli onsets to 3.4s after onsets. These epochs were manually inspected, and noisy channels were spherically interpolated (mean of channels interpolated by participant = 0.7, range = [0–5]), and noisy epochs were excluded (mean of epochs rejected by participant = 10.5, range = [0–47]). Artefacts corresponding to blinks were corrected using independent components analysis (ICA, Chaumon et al., Citation2015). In order to improve the ICA decomposition, a second data set was created, differing solely from the first one by using a 1 Hz high pass filter (Kaiser windowed sinc FIR filter, order = 802, beta = 4.9898, transition bandwidth = 2 Hz). A mean of 1.33 independent components (range = [1–3]) were removed in the ICA. The obtained demixing matrix was then applied to the data set filtered at 0.1 Hz. Individual components corresponding to blinks were then excluded in a semi-automatic way, relying on the SASICA plugin (Chaumon et al., Citation2015, which relies on the ADJUST algorithm, Mognon et al., Citation2011). Identified ICA components were visually inspected and removed if needed.
After removal of blink components, a second step of data cleaning was performed in a semi-automatic way. For each epoch, we detected channels presenting an amplitude superior to +100 µV or inferior to −100 µV. If a channel was detected on more than 45 epochs, the channel was spherically interpolated on every epoch (mean number of interpolated electrodes per participant: 0.73, range = [0–5]). If an epoch had more than three channels detected, it was disregarded. If an epoch had less than three channels detected, we spherically interpolated these channels for the epoch duration. Then we screened epochs for channels with abnormal trends (rejtrend function; slope > 50 µV with R2 > 0.3). If an abnormal trend was detected on more than 45 epochs, the channel was spherically interpolated on every epoch. If an epoch had more than three channels detected, it was disregarded. If an epoch had less than three channels detected, we spherically interpolated these channels for the epoch duration. We then performed a last manual check of the remaining epochs and excluded the remaining noisy channels or electrodes. Finally, we excluded epochs corresponding to trials with errors and trials with vocal onsets starting before 600 ms or after 2300 ms relative to the onset of the visual stimulus. A mean of 90 epochs by participants (range = [16–219]) were excluded (i.e. 20% of trials). The average number of trials remaining for each condition after artifact rejection (along with standard deviation and ranges) can be found in .
Table 1. Mean number of trials, standard deviation (sd), minimum (min), and maximum (max) per condition remaining after artifact rejection.
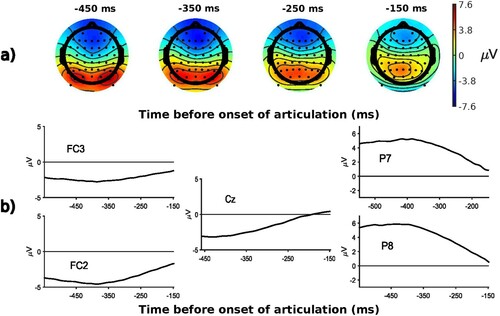
We extracted both stimulus-aligned and response-aligned epochs so as to be able to capture effects that arise both early after picture onset and shortly before articulation. Stimulus-aligned ERPs capture processes that are aligned on the presentation of the stimulus, i.e. early encoding processes. Response-aligned ERPs on the other hand are particularly appropriate to target processes that are aligned on the vocal response, and that reflect later encoding processes (e.g. Bürki et al., Citation2015; Laganaro et al., Citation2013; Lancheros et al., Citation2020). We therefore created both a stimulus-locked and response-locked data set for each participant (e.g. Krott et al., Citation2019; Laganaro et al., Citation2012; Wong et al., Citation2017). The stimulus locked data set was created by segmenting epochs from −200 to 500 ms before and after visual stimulus onset (distractor-picture pair, distractors were presented with a stimulus-onset asynchrony of 0 ms, see ). Epochs of this data set were baseline corrected by using the mean of the signals between −200 and 0 ms relative to visual stimulus onset. The response locked data set was created by segmenting epochs from −600 to −100 ms relative to vocal response onsets (see ). No baseline correction was applied to the response-locked data set.Footnote3 The raw and pre-processed EEG files are publicly available and can be found on OSF (https://osf.io/svjh5/).
Figure 2. Stimulus-locked ERPs averaged over all participants and conditions: a) topographies at randomly selected time windows; b) waveforms at various electrodes.
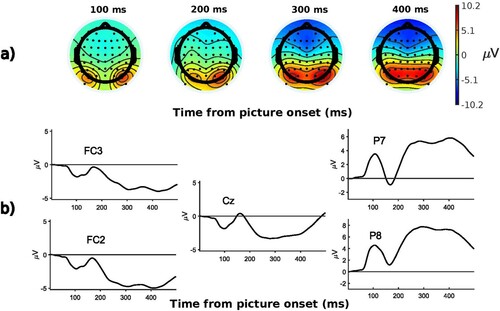
Figure 3. Response-locked ERPs averaged over all participants and conditions: a) topographies at randomly selected time windows; b) waveforms at various electrodes.
Analyses and results
Picture-word interference and delayed naming tasks: picture naming latencies
Trials with incorrect responses on the picture-word interference task were removed from further analyses (n = 1150 total trials removed; 6%). Most errors occurred because the participants produced a word other than the intended word (n = 758 total trials removed; 66% of errors), were dysfluent (hesitations, false starts, n = 231 total trials removed; 20% of errors) or did not provide a response (n = 156 total trials removed; 14% of errors). Response latencies for each trial (with a correct response) were defined as the time between the onset of the picture presentation and the onset of the vocal response, and these were measured manually based on the spectrogram and oscillogram using the Praat software (Boersma & Weenink, Citation2014). The resulting dataset can be accessed here: https://osf.io/svjh5/. There were 58 trials for which the response of the participant or its onset could not clearly be defined (0.3% of the data); these trials were disregarded. We additionally removed 1791 trials that corresponded to epochs with artefacts in the EEG data, as well as 1044 trials with naming latencies below 600 ms, such that the analysis of the response times and the analysis of the EEG signal are based on the same set of trials. If trials with response times below 600 ms were to be included, the ERP dataset would contain signals recorded during articulation. Given the difference in naming times across conditions, there would further be an imbalance in the number of epochs recorded during articulation across conditions.
Analyses of behavioural data were performed in R (R Core Team, Citation2021), and graphs were created using the package ggplot2 (Wickham, Citation2009). The scripts and datasets to reproduce these analyses are available publicly on OSF (https://osf.io/svjh5/). To facilitate replicability of our findings, we distinguish between planned and exploratory analyses. Planned analyses are those which were planned prior to data collection, whereas exploratory analyses were conducted after data collection or after initial analyses had been done.
Analysis 1. Group level analysis, replication of classical picture-word interference effects (planned)
The first statistical model was conducted to determine whether the experiment could replicate the phonological facilitation, semantic interference, and general interference effects reported in the literature. This is a prerequisite to then examine the electrophysiological markers of these effects. We analysed response latencies with linear mixed-effects models (e.g. Goldstein, Citation1987) using the statistical software R (R core team, Citation2021) and the library lme4 (Bates et al., Citation2015). We estimated p-values with the lmerTest package (Kuznetsova et al., Citation2017), which uses the Satterthwaite method. Contrasts were determined manually (see Schad et al., Citation2020) such that the intercept represents the grand mean, and the four contrasts represent the difference between phonologically related and unrelated trials (i.e. phonological contrast), the difference between semantically related and unrelated trials (semantic contrast), the difference between trials in the phonologically unrelated and baseline conditions (general interference contrast 1) and the difference between trials in the semantically unrelated and baseline conditions (general interference contrast 2). Related trials were coded as +1 and unrelated trials as −1. Trials in the baseline condition were coded as 1. The mean of all naming times was 888 ms (SD = 143, range = [600–2300 ms]), and average naming times for a given participant ranged between 742 and 1129 ms, and for items between 785 and 1056 ms. The mean naming latencies in each condition are presented in .
Figure 4. Picture-word interference task: observed mean naming latencies and standard errors (values are adjusted for within-participant designs following Morey, Citation2008) for each condition.
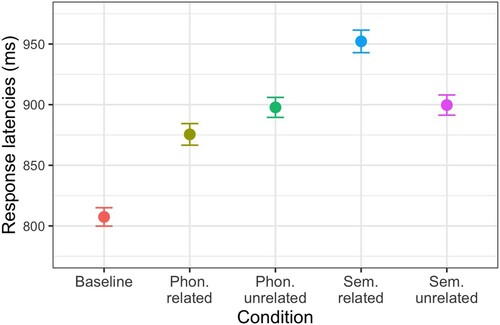
Models had by-participant and by-item random intercepts and slopes for each contrast, but no correlations between intercepts and slopes. The model was run twice: once with all data points and once without outliers. Outliers were defined as any absolute values of the scaled residuals that were greater than 2.5. The outlier corrected model output is reported in . Note that the pattern of results is not different when these outliers are kept in the analysis. These results replicate the phonological facilitation, semantic interference, and general interference effects. Note that the same pattern of results is found when the naming latencies are log transformed.
Table 2. Output of Analysis 1. Mixed-effects models testing the phonological, semantic, and general interference contrasts.
Having replicated the phonological facilitation and semantic interference effect in the response latencies, we examined the neurophysiological correlates of these effects and their timing in subsequent analyses.
Analysis 2. Variability in immediate and delayed picture naming latencies (planned)
The aim of this analysis was to determine how much of the variability in response times across participants can be accounted for by late articulatory execution processes. Recall that the delayed naming task is thought to represent late articulatory processes, while the immediate naming task (the picture-word interference task) is thought to reflect all stages of word production (e.g. Laganaro & Alario, Citation2006). Only trials from the baseline condition (picture with superimposed line of Xs) from the picture-word interference task were included in this analysis because those trials are comparable to the delayed naming task, which was a simple picture-naming task with no distractor words. Other trials that were eliminated from this analysis include trials with incorrect responses on either task and trials on the delayed task that had a negative reaction time (n = 323). Trials on the delayed task had a negative response time if the response was given prior to the response cue. We first calculated the mean of the reaction times for each participant on each task, (immediate: M = 791 ms, SD = 102 ms; delayed: M = 458 ms, SD = 105 ms). By-participant mean reaction times were submitted to a paired Levene’s test (two-sided) using the levene.Var.test function from the PairedData package (Champely, Citation2018) in R to test for heterogeneity of variance in the two tasks. This function calculates a paired t-test on the absolute deviations from the mean or median (we used the median, immediate: M = 77 ms, SD = 69 ms; delayed: M = 82 ms, SD = 71 ms). We found no significant difference in between-participant variability between the two tasks, t(44) = −0.41, p = 0.69 (see A-B).
Figure 5. A. Density plot and B. boxplot showing the distributions of by-participant mean reaction times in each task. C. Density plot and D. boxplot showing the distributions of by-item mean reaction times in each task. Similar variance was observed between the two tasks for participant analysis, but variance differed in the two tasks (greater variance in immediate task than delayed) for item analyses.
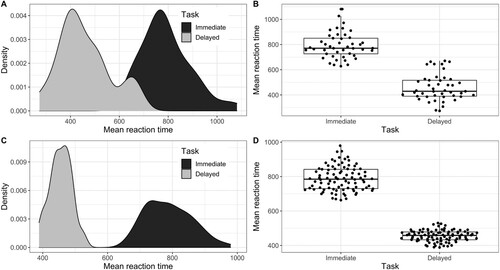
If more between-participant variability emerges in late encoding processes, we would additionally expect the mean reaction times for each participant to be well correlated between the immediate (i.e. baseline condition with no distractors) and delayed naming tasks, and this is indeed what we found, r = 0.58 [95% CI 0.34–0.74], p < 0.001.
By comparison, certain properties of words (e.g. frequency) have been shown to influence word-naming latencies at earlier stages, such as lexical selection or phonological encoding (e.g. Alario et al., Citation2002; Levelt, Citation1999). If the immediate task reflects all stages of word production and the delayed task reflects only later stages, we would expect to see more between-item variability in the immediate task compared to the delayed task (by-item descriptive statistics, immediate: M = 789 ms, SD = 71 ms; delayed: M = 455 ms, SD = 33 ms). We used the same procedure described above to test for differences in between-item variance between the two tasks and found that the variance in the immediate task (absolute deviations from the median, M = 58 ms, SD = 40 ms) was greater than the delayed task (absolute deviations from the median, M = 27 ms, SD = 19 ms), t(89) = 6.94, p < .001 (see C-D). We also would not expect the mean reaction times for each picture in the two tasks to be correlated; however, we did find a modest correlation between the two tasks, r = 0.23 [95% CI 0.02–0.42], p = 0.03. To test whether the correlation between the by-participant reaction times in the two tasks was stronger than the correlation between the by-item reaction times, we used the Fisher z-transformation to statistically compare the two correlations. This test revealed that the correlation between the by-participant reaction times for the two tasks was indeed stronger than the by-item correlation, z = 2.28 [95% CI for difference in correlations .05–.61], p = .02.
In these analyses, we computed the mean of the reaction times on all trials for each participant and item and entered these mean values into the statistical tests. However, a reviewer pointed out that reaction time measures typically follow an ex-Gaussian distribution (e.g. Balota & Yap, Citation2011; Marmolejo-Ramos et al., Citation2015) and it may therefore be more appropriate to use an ex-Gaussian rather than a Gaussian distribution. An ex-Gaussian distribution represents a convolution of a normal and exponential distribution (Balota & Yap, Citation2011). Following this comment, we computed the ex-Gaussian mu parameter (the mean of the normal part of the distribution) for each participant and item and ran the analyses again. Note that whereas the mean of the normal distribution is based on all trials, the mean of the ex-Gaussian distribution is only based on trials that are not part of the exponential parameter, i.e. longer trials. In general, we see a similar pattern of results to the original analyses using means. We tested between-participant variability on the two tasks and found that the delayed task showed more variability than the immediate task, t(44) = −2.37, p = .02. This is perhaps surprisingFootnote4, but in any case, the variability observed in the immediate task was not larger than in the delayed task, similar to what we observed in the original analysis. We additionally found a correlation between naming times in the immediate and delayed tasks, r = .37, p = .01. For the items analyses, we found that the between-participant variability was significantly larger than in the delayed task, t(89) = 3.34, p = .001, and we did not find a significant correlation between the by-item naming times in the two tasks, r = .09, p = .39. As indicated above, we did not find that the by-participant correlation was stronger when explicitly compared to the by-item correlation. However, the by-participant correlation reached significance, whereas the by-item correlation did not, which is consistent with our original predictions. Therefore, we still consider these results to be consistent with the results obtained from the original analyses.
Overall, these analyses do not provide support for the hypothesis that the variability across participants is greater in naming latencies that presumably reflect all encoding process, from picture recognition to initiation of articulation (immediate picture naming task), than in naming latencies that presumably only reflect execution processes (delayed picture naming task). These results are compatible with the hypothesis that at least some of the differences across individuals in naming latencies actually arise in late encoding processes.
ERPs in picture-word interference task
ERPs were analysed with mass univariate analyses. Mass univariate analyses consist in performing statistical tests at each time point and electrode (e.g. Pernet et al., Citation2015). These analyses were performed in LIMO, an open source MATLAB toolbox (Pernet et al., Citation2011). The analysis proceeds in two steps. In the first level analysis, the data are analyzed for each participant separately using a hierarchical General Linear Model (GLM). The beta coefficients for each predictor are estimated for each time point and channel. In the second level analysis, the significance of these estimated parameters is assessed across participants (see Pernet et al., Citation2011 for details). We used robust paired t-tests and corrected for multiple comparisons by applying the threshold free cluster enhancement (TFCE) procedure (Mensen et al., Citation2017; Mensen & Khatami, Citation2013; Smith & Nichols, Citation2009). In all but the second analysis, statistical significance was assessed at the group level only. In Analysis 2, we relied on statistical significance at the participant level.
Analysis 1. Group-level effects of distractor condition (planned)
The aim of this analysis was to assess the electrophysiological signature of the semantic interference, phonological facilitation, and general interference effect at the group level. Plots displaying group-level results of the semantic interference and phonological facilitation effects are displayed in Appendix 3, and results for the general interference effect are presented in supplementary materials.Footnote5 As described in detail in the EEG acquisition and pre-processing section, we conducted stimulus-locked analyses to test for early effects that were aligned on the stimulus onset and response-locked analyses to capture later effects aligned on the vocal response.
Semantic interference effect. In the stimulus-locked ERPs, the semantically related and semantically unrelated conditions differ between about 390 and 460 ms after picture onset on a set of posterior-central electrodes, with more positive values for the related condition than the unrelated, as can be seen on the plot with values on the electrode Pz (Appendix 3, Figure A1). In the response-locked ERPs, the two conditions differ from 420 to 100 ms before speech onset (i.e. last sample of analysed time window). The effect starts on bilateral posterior electrodes and is subsequently distributed over the whole scalp, with a dissociation between fronto-central electrodes displaying less negative values for the related condition, and posterior electrodes displaying more negative values for the unrelated condition (Appendix 3, Figure A2).
Phonological facilitation effect. In the stimulus-locked ERPs, the phonologically related and unrelated conditions differ between about 420 and 500 ms on a set of posterior electrodes, mostly right lateralised, displaying less negative values in the related condition (Appendix 3, Figure A3). In the response-locked analysis, phonologically related and phonologically unrelated conditions differed statistically starting 600 ms before vocal onset on the posterior area, with less negative values in the unrelated condition (Appendix 3, Figure A4).
Analysis 2. Single-subject analysis and correlations with cognitive measures and response times (planned)
The aim of this analysis was to determine the time course of the semantic interference and phonological facilitation effects at the individual level and examine to what extent these can be related to participants’ response times and performance on cognitive tasks. We examined the test contrasts for each participant (first level analysis in LIMO) and corrected for multiple comparisons using TFCE. For the semantic contrast, 0 out of 45 participants showed a significant effect in the stimulus-locked ERPs, and only six participants had an effect after correction in the response-aligned ERPs. For the phonological contrast, two and four participants showed a significant effect in the stimulus-aligned and response-aligned analyses, respectively. Given the small number of participants where effects could be detected, we were not in a position to correlate the time course of these effects with any other measure. Instead, we performed exploratory analyses, to be described below. We see two possible reasons for the lack of significant outcome at the individual level. The first and obvious reason is statistical power. We note however that extending the number of items for the present design would be difficult. The number of picturable words is limited and many of them are not part of a clear semantic category (i.e. cannot be used for the semantic manipulation). A second reason for the lack of a significant outcome at the individual level may be related to the inter-item variability in the timing of encoding processes, i.e. lack of synchronisation of processes across trials. We come back to this issue in the General Discussion.
Analysis 3. Experimental effects in fast versus slow speakers (exploratory)
This analysis was inspired by Laganaro et al. (Citation2012). These authors divided their participants into groups according to their response speed and performed an analysis for each speed group. With this analysis we can test the hypothesis that the time course of experimental effects depends on naming times. For each contrast, we did a median split on participants’ median reaction times of the conditions that made up that contrast to divide participants into two groups of fast and slow responders. For the semantic contrast, for example, we calculated each participant’s median reaction time for the semantically related and unrelated trials and performed the median split on those values. In the present study, we use the semantic interference and phonological facilitation effects as markers of encoding processes in word production to test whether inter-individual differences in the speed of picture naming influence ERP effects, which is why we split participants into speed groups using only trials from the condition of interest (rather than, for example, using reaction times from the baseline condition). Investigating inter-individual differences in the magnitude of the semantic interference and phonological facilitation effects is outside the scope of the present study. We note that the number of participants in each group (i.e. between 22 and 23) is similar to the total number of participants use in many similar studies (e.g. Bürki, Citation2017b; Krott et al., Citation2019; Laganaro et al., Citation2012; Piai et al., Citation2012). In addition, we included a relatively high number of items (n = 90).
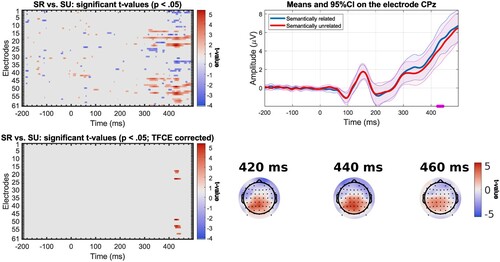
Semantic interference effect. In the stimulus-locked analysis of the semantic contrast, slow participants (n = 23, mean reaction times = 1003 ms, SD = 79 ms, range = [907–1161 ms]) showed an effect on a small cluster after correction for multiple comparisons around 250–260 ms after picture presentation on right-lateralised posterior electrodes with more positive values for the semantically related condition (). For fast participants (n = 22, mean reaction times = 844 ms, SD = 46, range = [778–920 ms]), a difference is found between 425 and 445 ms after picture onset on posterior electrodes with more positive values for the semantically related condition (). If the semantic interference effect reflects lexical access and lexical access occurs later in slower speakers (e.g. Laganaro et al., Citation2012), we would have expected to see an effect in an earlier time window for fast than for slow participants. Assuming that we consider these very small effects meaningful, the data seem to show the opposite pattern from what we predicted.Footnote6 We note here that the differences in the EEG pattern across conditions in the stimulus-locked ERPs cannot unambiguously be linked to a specific cognitive process. This pattern could result from a difference in the onset of articulatory movements across conditions. It is indeed possible that participants have already started moving the articulators in this time window for trials with short response times. Given the difference in response times across conditions, these movements would be expected to start earlier in the unrelated condition.
Figure 6. Results of mass univariate analysis for the comparison between the semantically related (SR) and unrelated (SU) trials for the stimulus-locked ERPs of slow participants (n = 23), with significant t-values before correction (top left); significant t-values after correction with TFCE (bottom left); mean amplitude at electrode PO8 (electrode where t-value is maximal) for the semantically related and unrelated trials, significant time points (after TFCE correction) underlined in purple, shading represents 95% confidence intervals (top right); Topographic map of t-values before correction at 250 ms (bottom right).
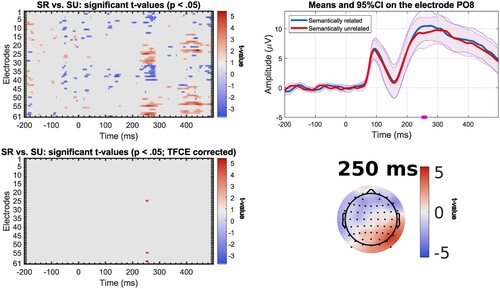
Figure 7. Results of mass univariate analysis for the comparison between the semantically related (SR) and unrelated (SU) trials for the stimulus-locked ERPs of fast participants (n = 22), with significant t-values before correction (top left); significant t-values after correction with TFCE (bottom left); mean amplitude at electrode CPz (electrode where t-value is maximal) for the semantically related and unrelated trials, significant time points (after TFCE correction) underlined in purple, shading represents 95% confidence intervals (top right); Topographic map of t-values before correction at selected time windows (bottom right).
In the response-locked analysis, we observed an effect in different time windows depending on the speed group. For the slow participants (n = 23), significant differences can be found as early as 500 ms before response onset on a set of posterior electrodes with less negative values for the semantically unrelated condition (). Starting around 410 ms prior to the vocal response, a difference in conditions is found, with bilateral frontal electrodes showing less negative values for the semantically related condition and posterior electrodes showing less negative values for the semantically unrelated condition. The localisation and direction of the effect is similar for fast participants (n = 22), except the effect starts closer to the response than for slow participants, around 220 ms before response onset (). This difference between groups is as expected if slow and fast participants differ in the last encoding stages before the onset of articulatory movements. We note here that the observed difference can hardly be associated with difference in articulatory artefacts across conditions, given that the ERPs are aligned on response onset, and the fact that trials have the same articulatory properties across conditions.
Figure 8. Results of mass univariate analysis for the comparison between semantically related (SR) and unrelated (SU) trials for the response-locked ERPs in slow participants (n = 23) with significant t-values before correction (top left); significant t-values after correction with TFCE (bottom left); mean amplitude at electrode AF7 (electrode where t-value is maximal) for the semantically related and unrelated trials, significant time points (after TFCE correction) underlined in purple, shading represents 95% confidence intervals (top right); Topographic map of t-values before correction at selected time points (bottom right).
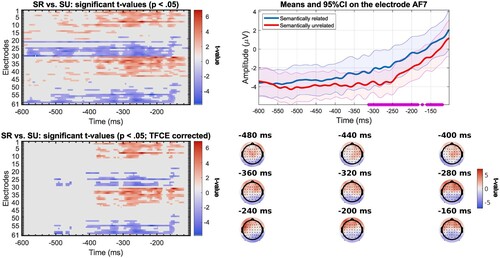
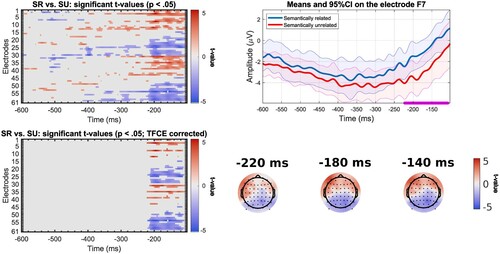
Figure 9. Results of mass univariate analysis for the comparison between semantically related (SR) and unrelated (SU) trials for the response-locked ERPs in fast participants (n = 22) with significant t-values before correction (top left); significant t-values after correction with TFCE (bottom left); mean amplitude at electrode F7 (electrode where t-value is maximal) for the semantically related and unrelated trials, significant time points (after TFCE correction) underlined in purple, shading represents 95% confidence intervals (top right); Topographic map of t-values before correction at selected time points (bottom right).
Phonological facilitation effect. For the phonological contrast, no time point remained significant after correction for multiple comparisons for slow (n = 23, mean reaction times = 954 ms, SD = 79, range = [843–1131 ms]) or for fast speakers (n = 22, mean reaction times = 813 ms, SD = 45 ms, range = [720–883 ms]), in the response-locked or in the stimulus-locked analyses.
Analysis 4. Time course of experimental effects in varying samples of participants (exploratory)
The comparison of experimental effects across speed groups suggests that the timing of effects depends on participants’ naming speed. When collecting data for an experiment, we use random samples of participants, with no a priori information on the speed with which our participants can name pictures. In this final analysis, we examined how the results of the group analyses vary with different samples of participants.
For each contrast (phonological and semantic), we took 20 random samples of 23 participants. For each sample, we performed the exact same procedure as described above for the group results: Mass univariate analysis on response-locked and stimulus-locked ERPs comparing phonologically related to phonologically unrelated trials and semantically related to unrelated trials using TFCE to correct for multiple comparisons. Each analysis can be seen as a small replication of the group analysis, with a different sample.
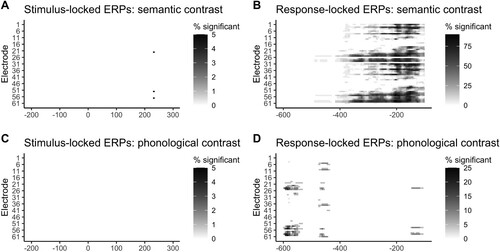
We then visualised changes in the results across samples. The results of these four analyses are illustrated in . Only 5% of samples showed effects at around 240 ms after stimulus onset in the stimulus-locked analysis of the semantic contrast (A). The most robust results were found in the response-locked analyses for the semantic contrast, with some electrodes showing a significant effect at about 100–200 ms before word onset in 80–90% of the samples (B). No samples showed significant effects in the stimulus-locked ERPs for the phonological contrast (C), and only 20–25% of samples showed significant effects around 580 ms before word onset in the response-locked analysis for the phonological contrast (D). These results suggest that the time course of effects—but also whether an effect is observed at all—depends on the sample of participants.
Figure 10. Results of mass univariate analyses for 20 random samples of 23 participants each. Note the difference in scales among plots. Plots display the percentage of time an electrode and time point are significant after TFCE correction on 23 participants (p < .05) for the A. stimulus-locked analysis for the semantic contrast, B. response-locked analysis for the semantic contrast, C. stimulus-locked analysis for the phonological contrast, and D. response-locked analysis for the phonological contrast.
General discussion
The present study investigated inter-individual variability in the time needed to prepare a vocal response for word production. Our first aim was to determine whether this variability could be associated with specific encoding processes, and our second aim was to examine the impact of inter-individual differences in the timing of encoding processes on group results in EEG studies.
Locus of inter-individual differences in naming latencies
As expected, participants’ naming times in the present study were highly variable; mean picture-naming latencies ranged from 740 to 1130 ms. The slowest participant needed on average 390 additional milliseconds to perform the task than the fastest participant. Where do these differences come from? Are slower participants slower in all encoding process, from conceptualisation to execution, or do they need more time only in a subset of encoding processes? Several findings from the present study concur to support the hypothesis that inter-individual differences in response times at least partially originate in late encoding processes. The first source of evidence comes from the comparison of variability of individual naming times in the immediate naming task (baseline condition) and the delayed naming task. In a delayed naming task, participants have time to encode their response up to the phonetic level (at least for the first syllable of the response) before the initiation of the response. As a result, the naming times are assumed to mostly reflect the processes involved in the execution of articulatory gestures (Laganaro & Alario, Citation2006). Under this assumption, inter-individual variability in delayed response times reflects inter-individual variability in late execution processes. By contrast, naming times in an immediate naming task reflect the sum of all encoding processes, from conceptualisation to articulation.
In the current study, we found that the between-participant variability was similar in the delayed and immediate naming tasks. Moreover, the correlation between the average by-participant response times of the two tasks was rather high, providing additional support for the hypothesis that a large part of inter-individual differences in response times arises in late encoding processes. We acknowledge, however, that the correlation of r = .58 still leaves plenty of variance unexplained, and we cannot rule out the possibility that some of that unexplained variance stems from earlier processing stages. In comparison to the analyses of between-participant variability, the correlation between the by-item mean response times in the two tasks was weaker, and the between-item variability was greater in the immediate naming task than in the delayed naming task. We know from previous studies that the properties of the words or of the pictures (frequency, age of acquisition, name agreement, see Perret & Bonin, Citation2019, for a recent meta-analysis of the variables that influence picture naming latencies) influence naming times. Unlike for between-participant variability, we have a fairly good understanding of the origin of naming latency differences across items. Many variables that are known to influence naming latencies have been associated with early encoding processes, namely conceptualisation, mapping between picture and concept, lexical access, or phonological encoding. Assuming, following others (e.g. Laganaro & Alario, Citation2006) that naming latencies in a delayed naming task reflect mostly late articulation stages of word production, the weaker correlation between the mean naming times in the immediate and delayed tasks for the items and the greater between-item variability in the immediate task is in line with the assumption that a substantial amount of the variability across items arises in early encoding processes. A substantial amount of inter-item variability in the timing of encoding processes would also explain why the experimental manipulation did not significantly influence the ERPs in the single participant analysis.
It is important to acknowledge that our interpretation of the behavioural data relies on the assumption that only articulation processes are shared between both tasks. However, it might also be possible that participants vary systematically in their speed in response to any stimulus, specifically in their initiation of a motor response. In the delayed naming task, participants must control or inhibit their initiation of a motor response until the response cue, and it is possible that a participant’s speed of initiation could be common to more tasks than just picture naming. This could result in a strong correlation between delayed naming and any other reaction time measure. Because we had also collected data on other reaction time tasks, we were able to test this hypothesis. To do this, we computed the mean reaction time of the neutral trials from a Flanker task (Eriksen & Eriksen, Citation1974) and correlated these with participants’ delayed naming speed. We did not find a significant correlation when computing the correlation with either participants’ mean response times on the delayed naming task, r = .23, p = .13, or the ex-Gaussian mu parameter, r = .15, p = .34. Of course with a null result, we cannot claim evidence of no effect; however, we at least do not have support for a correlation between delayed naming and a non-verbal reaction time measure. We also find a similar pattern when we test the correlation between the Flanker task and participants’ mean response times on the immediate naming task, r = .29, p = .05, and when using the ex-Gaussian mu parameter, r = .21, p = .17. Although the correlation with the mean response times on the immediate task is marginally significant, it is attenuated when using the ex-Gaussian mu parameter. This suggests that the relationship with the overall mean could be due to some participants with some especially slow responses. We acknowledge that the immediate and delayed naming tasks may have more cognitive processes inherent to both tasks than just the execution of articulatory gestures, and an important goal for future studies will be to determine exactly which processes are shared between the two tasks.
The analyses of the EEG data also provide support for the hypothesis that at least some of the variability across participants arises in late encoding processes. For example, the difference between semantically related and unrelated trials is informative on the locus of inter-individual differences. In the whole-group analyses, we mostly found a difference in conditions in a late time window (between about 400 and 500 ms post-picture onset in the stimulus-aligned analyses). In the response-aligned analyses, this difference was found aligned on the vocal responses. The timing of this effect and in particular the observation that the effect is aligned on the response times favours a post-lexical locus of this effect (though our results do not necessarily exclude the possibility that lexical selection is not finalised until late encoding stages, see cascading models of word production, e.g. Dell, Citation2013; Lorenz et al., Citation2021; Peterson & Savoy, Citation1998). This timing is compatible with the response-exclusion account. In this account, in a picture-word-interference task, participants process the distractor and store its corresponding articulatory programmes in a pre-response buffer. In order for the target word to be produced, the buffer must first be cleared. The suppression of the non-target response from the buffer depends on the relevance of this response. Distractors of the same semantic category are more relevant and therefore take longer to be suppressed (see for instance Mahon et al., Citation2007; but see for instance Abdel Rahman & Aristei, Citation2010). The fact that we find more evidence for a late than an early locus of the semantic interference effect does not speak to whether the semantic interference effect also partially occurs during lexical access. Other EEG studies do report effects in time windows that are compatible with a lexical locus (e.g. Rose et al., Citation2019) or in even earlier time windows possibly related to the conceptual stage (Dell’Acqua et al., Citation2010). The smaller difference we observe between related and unrelated trials in the stimulus-aligned ERPs is more difficult to interpret. It could be taken to reflect a lexical locus (as reported for instance in Rose et al., Citation2019) or an earlier onset of articulatory artefacts for a subset of trials (the ones with shorter response latencies) in the unrelated than in the related condition.
Crucially, the comparison between slow and fast participants reveals that the effect in the response-aligned ERPs lasts longer in the slow participants (from about 100 to 400 ms before the onset of the vocal response) as opposed to the fast participants (from about 100 to 200 ms before the onset of the vocal response). A possible explanation is that slower participants need more time to suppress the distractor response. Interestingly, naming times are 135 ms shorter in the fast than in the slow participants. These results are consistent with variability across participants originating in the last encoding processes before the onset of articulation.
Again, though, this finding does not rule out the possibility that inter-individual variability also arises at earlier time points. Some previous studies have associated differences in response speed to earlier processes, such as lexical access (Laganaro et al., Citation2012). One key difference in our study from the study by Laganaro et al. (Citation2012) is that they compared ERPs of their speed groups in a simple picture-naming task. In contrast, we compared the effect of an experimental manipulation (semantically related vs. unrelated distractors) across groups. In the present study, effects are small or absent in the stimulus-aligned ERPs. Notably, such a pattern would also be expected if participants varied greatly in the timing of earlier processes. Some amount of synchronicity is indeed required for effects to surface in the group results. Logically, if there is too much variability in earlier encoding processes across participants the group analyses may fail to detect any effect in earlier time windows.
In sum, whereas others before us have associated differences in response speed to earlier processes, such as lexical access (see Laganaro et al., Citation2012), our findings support the hypothesis that variability also arises in late encoding processes, i.e. phonetic encoding process and/or the execution stage.
Inter-individual differences and ERPs
Our analyses comparing fast and slow speakers suggest that inter-individual differences in naming times do influence the timing of experimental effects in the EEG signal. For example, the duration of the semantic interference effect differs by at least 200 ms across speed group. This result complements previous studies (e.g. Laganaro et al., Citation2012) in showing that response speed does not only generate differences in the brain signal across participants, it generates differences in the timing of experimental effects. This conclusion is further supported by the analysis with random samples of participants. This analysis suggests that the timing of experimental effects varies with the sample of participants. Taken together, these analyses reveal that if technically, ERPs provide a high temporal resolution, variability across participants hinders this precision.
The observation that experimental effects vary with the speed of participants or more generally, with the participant sample, has important implications for research in language production. Firstly, given that encoding processes are not associated with well-defined ERP components, many studies rely on the timing of effects to associate the electrophysiological response with a given cognitive process (using Indefrey and Levelt’s time course, Citation2004, or a rescaling of this time course). The finding that the timing of experimental effects varies with response speed suggests that it may be difficult to probe individual differences in language production in this way. As argued above, effects at the group level can only surface when the ERPs of a sufficient number of participants in the experiment are synchronous. The findings in the present and previous studies that slow and fast speakers differ in the time course of EEG effects show that this is not always the case. Simply increasing our sample size may not necessarily solve this problem, however. In order to detect an effect in a given time window in a statistical analysis, the majority of participants need to show the effect in that time window. Testing more participants who show the effect in that time window would indeed increase power to detect this effect; however, adding more participants who show the effect in a different time window will decrease power for detecting the effect in the time window of interest. Assuming that participants vary in the time course effects, it is not possible to know in advance in which time windows a given participant will show an effect. Unlike in language production, other subfields can indeed rely on well-defined ERP components to interpret effects; therefore, those studies may not be subject to the limitations involving timing of effects and inter-individual differences described here.
Another explanation of our results is that we simply did not have enough power to detect effects with our sub-samples in the exploratory analyses of the fast and slow groups or the 20 sub-samples of 23 participants.Footnote7 We note, however, that many similar studies in the field have had sample sizes comparable to the size of our sub-samples. For example, studies in the field that have used similar designs (picture-word-interference tasks with EEG) range from 10–25 participants and 24–416 items (e.g. Aristei et al., Citation2011; Bürki, Citation2017a; Dell’Acqua et al., Citation2010; Dirani & Pylkkänen, Citation2020; Greenham et al., Citation2000; Hirschfeld et al., Citation2008; Krott et al., Citation2019; Piai et al., Citation2012; Roelofs et al., Citation2016; van Schie et al., Citation2003; Rose et al., Citation2019). Irrespective of whether the changes in the timing or presence of effects across samples reflects lack of power or differences in synchronisation across participants, other published studies in the field may suffer from the same limitations, so we should exercise caution in interpreting those results, as well. As we discuss in the next paragraph, we unsurprisingly see variability in the timing of EEG effects across several studies that test similar questions.
We speculate that the lack of synchronicity across participants is responsible for many of the observed differences across studies in the field. As mentioned above, our findings diverge from several similar studies in the field; however, discrepancies are frequent in this literature. Take for instance the semantic interference effect. A subset of studies report an absence of an effect (we restrict the discussion to amplitude analyses, Hirschfeld et al., Citation2008b; Piai et al., Citation2012), while others report effects that vary in their timing and shape. For example, several studies have found evidence of the semantic interference effect in a later time window, around 350–500 ms post-stimulus onset (e.g. Blackford et al., Citation2012; Cai et al., Citation2020; Greenham et al., Citation2000; Lorenz et al., Citation2021; Roelofs et al., Citation2016; and Rose et al., Citation2019; see Dirani & Pylkkänen for similar results using MEG). On the other hand, several studies find evidence of the semantic interference effect at earlier time windows. Dell’Acqua et al. (Citation2010) found this effect around 100 ms after stimulus onset, mostly in left frontal and temporal electrodes (see also Aristei et al., Citation2011; Rose et al., Citation2019; for additional evidence from the continuous-picture naming paradigm, see Costa et al., Citation2009).
A first possible explanation for the divergent findings could be found in analysis choices. In the present study, we analysed both stimulus-aligned and response-aligned ERPs, we performed the analysis with as few a priori restrictions as possible and used the most conservative correction for multiple comparisons. Unlike cluster-based permutation, TFCE provides information on significance for each time point and allows us to draw conclusions about the timing of effects (Sassenhagen & Draschkow, Citation2019). In contrast, many studies have only examined stimulus-aligned ERPs and/or analysed the amplitude average in a given time window or several time windows (e.g. Dell’Acqua et al., Citation2010). The findings of the present study suggest that in addition to study design and methodological differences, different results are expected as a result of inter-individual differences in processing speed. We have argued along with others (Laganaro et al., Citation2012) that inter-individual differences in picture naming speed can affect group-level ERP results. The differences in results found for our sub-groups of fast vs. slow speakers, as well as the range of results found for random sub-samples of participants support this idea. We reiterate here that inter-individual differences in the timing of encoding processes will not only generate differences in the timing of effects across studies; in studies where variability across participants is high in a given time window, the chances of detecting an effect in this time window at all will be low. For instance, it is entirely possible that the participants in the present study, even within the slow and fast groups, were highly variable in early encoding processes, preventing us from detecting any effect (or allowing us to spot only small effects) in these time windows. Individual variability could potentially also explain differences between results in our study and others with more similar design and analysis choices (e.g. studies that reported both stimulus-aligned and response-aligned analyses, Krott et al., Citation2019; Wong et al., Citation2017).
In the present study, we used mass univariate analyses to analyse the ERPs of our participants and show that with such analyses, effects differ across groups or samples of participants. In our analyses, a statistical test was performed at each time point, first across trials for a given participant, then across participants. An effect will therefore only be detected if there is a sufficient number of time points where a sufficient number of trials/participants exceed the threshold (often t > 2). The standard analysis approach has long been to average the amplitude of the signal in a given time window (and region(s) of interest). It could be argued that if the time window is selected appropriately, this approach may provide a solution to the lack of synchronicity across participants. This may be true, but only under the assumption that the time window is selected appropriately. The variability across participants makes it difficult to ensure that this assumption is satisfied. In earlier work, it was common practice to select the time windows based on the visualisation of the ERPs across conditions. In this approach, the time window in which the difference was most visible was analysed. This strategy drastically inflates spurious findings.
In the analysis of behavioural responses, accuracy, or response times, the statistical model ensures that the effects generalise to other participants and items. This is for instance achieved by using crossed mixed-effects models with random terms for participants and items. Analyses of ERPs (whether in the mass univariate framework or using averages in one or more time windows), do not allow us to determine whether the timing of the effects generalises to other participants (or items). A significant cluster or effect reveals that a sufficient number of participants showed a similar effect in an overlapping time window but does not inform us on whether another sample of participants would show the same effects in the same time window. The analysis that we performed with random samples can provide information on this issue and can be used to determine the confidence around the significant time point where the experimental effect is found. This method could be used in future studies to examine the reliability of experimental effects across samples. Note however that this method requires that a larger group of participants be tested in the first place.
We additionally acknowledge that our exploratory analyses comparing fast and slow groups of participants suffer from the same limitations that group analyses suffer from: Even though these sub-groups are more similar in terms of word production speed, we cannot assume that neural activity is synchronised across participants in each speed group. Moreover, the time windows in which the ERPs of the participants in the two groups show sufficient synchronisation for effects to be visible at the group level might differ. In spite of this limitation, our conclusions that inter-individual differences in word production speed affect the timing of EEG results remain unchanged.
In the present study, we asked at which stages in the language production process we see inter-individual variability. Our findings suggest that there are differences across participants in late encoding processes (though they do not rule out the possibility that differences also arise in earlier processes). As a consequence, they warn against interpreting the timing of experimental effects in the response-aligned ERPs, but do not inform us on whether caution should also be taken in interpreting the timing of effects in the stimulus-aligned ERPs. We speculate however that the same warning applies there too. Previous studies have provided evidence that the timing of lexical access is variable across participants (Laganaro et al., Citation2012). Moreover, our findings suggest differences in slow and fast participants in the stimulus-aligned ERPs too. Finally, even if participants’ variability partially arises in late encoding processes, variability is expected across items. We can therefore expect that the timing of experimental items in earlier time windows depends on the set of items used in the experiment.
Conclusion
Inter-individual differences in behavioural tasks are apparent in everyday language tasks and at the experimental level, in the time needed to produce single words in response to a picture. In the present study, we tested whether individual variability emerges at earlier or late stages of word production. Data from a delayed naming task and EEG data suggest that the differences in response times we observe across participants at least partially arise in late encoding processes, presumably the phonetic encoding process. We further describe a novel way of analysing ERP results, which informs us on the contribution of between-speaker variability to the group results.
Supplemental Material
Download Zip (15.9 MB)Acknowledgement
The authors would like to thank Thea Villinger for her help in data collection and preprocessing.
Disclosure statement
No potential conflict of interest was reported by the author(s).
Additional information
Funding
Notes
1 Our initial plan was to perform single participant analyses of experimental effects from the EEG data and correlate onset/offset of effects with response times. This could not be done because too few participants showed effects in the EEG data after correction for multiple comparisons. It is possible that the variability across items was too high. For instance, the picture with the fastest mean response time was produced 270 ms faster than the picture with the slowest mean response time. We also wanted to explore the relationships between this timing and cognitive resources. In short, we find that naming times are modulated by a measure of sustained attention. However, given the number of different measures related to cognitive resources that we used, this relationship could be spurious. We are currently working on a replication of these findings.
2 This duration is shorter than it was for the picture-word interference task. If these durations had been equated between the two tasks, the trials for the delayed naming task would have been much longer due to the interval between picture presentation and the response cue.
3 The decision to apply a baseline correction to the stimulus-aligned ERPs was taken to keep with standard practices. We did not apply a baseline correction for response-aligned ERPs because there was not an appropriate baseline. A baseline prior to stimulus onset would have been too far away from the epoch, a baseline before response onset would have been contaminated by the experimental manipulation, and a baseline after response onset would have been contaminated by articulation processes. The decision to apply/not to apply baseline corrections was taken before conducting the analyses.
4 Upon visual inspection of the data, it seems that the greater variance in the delayed task may have been driven by a few outliers. Plots of this data are available on our OSF page: https://osf.io/svjh5/.
5 We also performed the mass univariate analyses (with all participants) averaging over items at the first level (rather than participants) and found the same pattern of results; however, we do not report these analyses in the paper for the sake of brevity.
6 Note that the exact duration of these effects after correction for multiple comparisons depends on the statistical “filter”. The TFCE method is for instance more conservative than a cluster-based permutation method. It is possible that with the latter, the effect would have been larger.
7 We unfortunately did not have a priori estimates of effect sizes to determine what sample size was needed to detect effects in the EEG data. However, we conducted power analyses for each contrast to determine how many participants were needed to obtain at least 80% power to detect an effect of naming times in the behavioural data. The power analyses were performed using the simR library (Green & MacLeod, Citation2016), a package that allows computing power functions for mixed-effects models using simulations. These analyses confirm that with half the participants, we still have a high probability of detecting the semantic interference and general interference effects (100% power reached with less than 15 participants). For the phonological contrast, 23 participants (half of our sample) are needed to achieve 80% power. We are aware that these power analyses inform us on the likelihood of detecting an effect in the behavioural data (reaction times), not in the ERPs. However, the experimental effects we are studying with EEG are assumed to reflect behavioural effects, and at the very least, we had enough power to detect behavioural effects with 23 participants.
Related Research Data
References
- Alario, F.-X., Costa, A., & Caramazza, A. (2002). Frequency effects in noun phrase production: Implications for models of lexical access. Language and Cognitive Processes, 17(3), 299–319. https://doi.org/10.1080/01690960143000236
- Aristei, S., Melinger, A., & Abdel Rahman, R. (2011). Electrophysiological chronometry of semantic context effects in language production. Journal of Cognitive Neuroscience, 23(7), 1567–1586. https://doi.org/10.1162/jocn.2010.21474
- Balota, D. A., & Yap, M. J. (2011). Moving beyond the mean in studies of mental chronometry: The power of response time distributional analyses. Current Directions in Psychological Science, 20(3), 160–166. doi:10.1177/0963721411408885
- Bates, D., Mächler, M., Bolker, B., & Walker, S. (2015). Fitting Linear mixed-effects models using lme4. Journal of Statistical Software, 67(1), 1–48. https://doi.org/10.18637/jss.v067.i01
- Blackford, T., Holcomb, P. J., Grainger, J., & Kuperberg, G. R. (2012). A funny thing happened on the way to articulation: N400 attenuation despite behavioral interference in picture naming. Cognition, 123(1), 84–99. doi:10.1016/j.cognition.2011.12.007
- Boersma, P., & Weenink, D. (2014). Praat: Doing phonetics by computer (5.4.01) [Computer software]. https://www.fon.hum.uva.nl/praat/
- Bürki, A. (2017a). Differences in processing times for distractors and pictures modulate the influence of distractors in picture–word interference tasks. Language, Cognition and Neuroscience, 32(6), 709–723. https://doi.org/10.1080/23273798.2016.1267783
- Bürki, A. (2017b). Electrophysiological characterization of facilitation and interference in the picture-word interference paradigm. Psychophysiology, 54(9), 1370–1392. https://doi.org/10.1111/psyp.12885
- Bürki, A., Cheneval, P. P., & Laganaro, M. (2015). Do speakers have access to a mental syllabary? ERP comparison of high frequency and novel syllable production. Brain and Language, 150, 90–102. https://doi.org/10.1016/j.bandl.2015.08.006
- Bürki, A., Elbuy, S., Madec, S., & Vasishth, S. (2020). What did we learn from forty years of research on semantic interference? A Bayesian meta-analysis. Journal of Memory and Language, 114, 104125. https://doi.org/10.1016/j.jml.2020.104125
- Bürki, A., & Madec, S. (2022). Picture-word interference in language production studies: Exploring the roles of attention and processing times. Journal of Experimental Psychology: Learning, Memory & Cognition. https://doi.org/10.1037/xlm0001098
- Cai, X., Ouyang, M., Yin, Y., & Zhang, Q. (2020). The effect of time pressure and semantic relatedness in spoken word production: A topographic ERP study. Behavioural Brain Research, 387, 112587. doi:10.1016/j.bbr.2020.112587.
- Champely, S. (2018). Paireddata: Paired data analysis. R Package Version, 1(1), https://rdrr.io/cran/PairedData/
- Chaumon, M., Bishop, D. V. M., & Busch, N. A. (2015). A practical guide to the selection of independent components of the electroencephalogram for artifact correction. Journal of Neuroscience Methods, 250, 47–63. https://doi.org/10.1016/j.jneumeth.2015.02.025
- Costa, A., Strijkers, K., Martin, C. D., & Thierry, G. (2009). The time course of word retrieval revealed by event-related brain potentials during overt speech. http://www.pnas.org/lens/pnas/106/50/21442
- Damian, M. F., & Martin, R. C. (1999). Semantic and phonological codes interact in single word production. Journal of Experimental Psychology. Learning, Memory, and Cognition, 25(2), 345–361. https://doi.org/10.1037/0278-7393.25.2.345
- Dell, G. S. (2013). Cascading and feedback in interactive models of production: A reflection of forward modeling? The Behavioral and Brain Sciences, 36(4), 351–352. https://doi.org/10.1017/S0140525X12002531
- Dell’Acqua, R., Sessa, P., Peressotti, F., Mulatti, C., Navarrete, E., & Grainger, J. (2010). ERP evidence for ultra-fast semantic processing in the picture–word interference paradigm. Frontiers in Psychology, 1. https://doi.org/10.3389/fpsyg.2010.00177.
- Delorme, A., & Makeig, S. (2004). Eeglab: An open source toolbox for analysis of single-trial EEG dynamics including independent component analysis. Journal of Neuroscience Methods, 134(1), 9–21. https://doi.org/10.1016/j.jneumeth.2003.10.009
- de Zubicaray, G. I., McMahon, K. L., Eastburn, M. M., & Wilson, S. J. (2002). Orthographic/phonological facilitation of naming responses in the picture-word task: An event-related fMRI study using overt vocal responding. NeuroImage, 16(4), 1084–1093. https://doi.org/10.1006/nimg.2002.1135
- Dirani, J., & Pylkkänen, L. (2020). Lexical Access in Naming and Reading: Spatiotemporal Localization of Semantic Facilitation and Interference Using MEG.. Neurobiology of Language, 1(2), 185-207. https://doi.org/10.1162/nol_a_00008.
- Duñabeitia, J. A., Crepaldi, D., Meyer, A. S., New, B., Pliatsikas, C., Smolka, E., & Brysbaert, M. (2018). Multipic: A standardized set of 750 drawings with norms for six European languages. The Quarterly Journal of Experimental Psychology, 71(4), 808–816. https://doi.org/10.1080/17470218.2017.1310261.
- Eriksen, B. A., & Eriksen, C. W. (1974). Effects of noise letters upon the identification of a target letter in a nonsearch task. Perception & Psychophysics, 16(1), 143–149. doi:10.3758/BF03203267
- Ferreira, V. S., & Pashler, H. (2002). Central bottleneck influences on the processing stages of word production. Journal of Experimental Psychology: Learning, Memory, and Cognition, 28(6), 1187. https://doi.org/10.1037/0278-7393.28.6.1187
- Fuhrmeister, P., Madec, S., & Bürki, A. (in preparation). Cognitive skills and inter-individual variability in word production.
- Ganushchak, L. Y., Christoffels, I. K., & Schiller, N. O. (2011). The Use of electroencephalography in language production research: A review. Frontiers in Psychology, 2. https://doi.org/10.3389/fpsyg.2011.00208
- Garrod, S., & Pickering, M. J. (2007). Automaticity of language production in monologue and dialogue. In Automaticity and control in language processing (pp. S. 19–38). Psychology Press. https://doi.org/10.4324/9780203968512.
- Goldstein, H. (1987). Multilevel covariance component models. Biometrika, 74(2), 430–431. https://doi.org/10.1093/biomet/74.2.430
- Green, P., & MacLeod, C. J. (2016). Simr: An R package for power analysis of generalized linear mixed models by simulation. Methods in Ecology and Evolution, 7(4). 493–498. https://doi.org/10.1111/2041-210X.12504
- Greenham, S. L., Stelmack, R. M., & Campbell, K. B. (2000). Effects of attention and semantic relation on event-related potentials in a picture-word naming task. Biological Psychology, 55(2), 79–104. doi:10.1016/S0301-0511(00)00070-3
- Hartsuiker, R. J., & Moors, A. (2017). On the automaticity of language processing. https://doi.org/10.1037/15969-010.
- Heister, J., Würzner, K.-M., Bubenzer, J., Pohl, E., Hanneforth, T., Geyken, A., & Kliegl, R. (2011). dlexDB–eine lexikalische datenbank für die psychologische und linguistische forschung. Psychologische Rundschau, 62(1), 10–20. https://doi.org/10.1026/0033-3042/a000029.
- Hirschfeld, G., Jansma, B., Bölte, J., & Zwitserlood, P. (2008). Interference and facilitation in overt speech production investigated with event-related potentials. Neuroreport, 19(12), 1227–1230. https://doi.org/10.1097/WNR.0b013e328309ecd1
- Indefrey, P. (2011). The spatial and temporal signatures of word production components: A critical update. Frontiers in Psychology, 2. https://doi.org/10.3389/fpsyg.2011.00255
- Indefrey, P., & Levelt, W. J. M. (2004). The spatial and temporal signatures of word production components. Cognition, 92(1–2), 101–144. https://doi.org/10.1016/j.cognition.2002.06.001
- Jongman, S. R., Roelofs, A., & Meyer, A. S. (2015). Sustained attention in language production: An individual differences investigation. The Quarterly Journal of Experimental Psychology, 68(4), 710–730. doi:10.1080/17470218.2014.964736
- Krott, A., Medaglia, M. T., & Porcaro, C. (2019). Early and late effects of semantic distractors on electroencephalographic responses during overt picture naming. Frontiers in Psychology, 10, 696. https://doi.org/10.3389/fpsyg.2019.00696
- Kuznetsova, A., Brockhoff, P. B., & Christensen, R. H. B. (2017). lmertest package: Tests in linear mixed effects models (lmer objects of lme4 package). https://doi.org/10.18637/JSS.V082.I13.
- Laganaro, M. (2016). Dynamics of word production and processing speed. Language. Cognition and Neuroscience, 31(4), 463–464.
- Laganaro, M., & Alario, F.-X. (2006). On the locus of the syllable frequency effect in speech production. Journal of Memory and Language, 55(2), 178–196. https://doi.org/10.1016/j.jml.2006.05.001
- Laganaro, M., Morand, S., & Schnider, A. (2009). Time course of evoked-potential changes in different forms of anomia in aphasia. Journal of Cognitive Neuroscience, 21(8), 1499–1510. https://doi.org/10.1162/jocn.2009.21117
- Laganaro, M., Python, G., & Toepel, U. (2013). Dynamics of phonological-phonetic encoding in word production: Evidence from diverging ERPs between stroke patients and controls. Brain and Language, 126(2), 123–132. https://doi.org/10.1016/j.bandl.2013.03.004
- Laganaro, M., Valente, A., & Perret, C. (2012). Time course of word production in fast and slow speakers: A high density ERP topographic study. NeuroImage, 59(4), 3881–3888. https://doi.org/10.1016/j.neuroimage.2011.10.082
- Lancheros, M., Jouen, A.-L., & Laganaro, M. (2020). Neural dynamics of speech and non-speech motor planning. Brain and Language, 203, 104742. https://doi.org/10.1016/j.bandl.2020.104742
- Levelt, W. J. (1999). Models of word production. Trends in Cognitive Sciences, 3(6), 223–232. https://doi.org/10.1016/S1364-6613(99)01319-4
- Levelt, W. J., Roelofs, A., & Meyer, A. S. (1999). A theory of lexical access in speech production. Behavioral and Brain Sciences, 22(1), 1–38. doi:10.1017/S0140525X99001776
- Lorenz, A., Zwitserlood, P., Bürki, A., Regel, S., Ouyang, G., & Abdel Rahman, R. (2021). Morphological facilitation and semantic interference in compound production: An ERP study. Cognition, 209, 104518. https://doi.org/10.1016/j.cognition.2020.104518
- Lupker, S. J. (1979). The semantic nature of response competition in the picture-word interference task. Memory & Cognition, 7(6), 485–495. https://doi.org/10.3758/BF03198265
- Mahon, B. Z., Costa, A., Peterson, R., Vargas, K. A., & Caramazza, A. (2007). Lexical selection is not by competition: A reinterpretation of semantic interference and facilitation effects in the picture-word interference paradigm. Journal of Experimental Psychology: Learning, Memory, and Cognition, 33(3), 503–535. https://doi.org/10.1037/0278-7393.33.3.503
- Marmolejo-Ramos, F., Cousineau, D., Benites, L., & Maehara, R. (2015). On the efficacy of procedures to normalize Ex-Gaussian distributions. Frontiers in Psychology, 5, 1548. doi:10.3389/fpsyg.2014.01548
- Mensen, A., & Khatami, R. (2013). Advanced EEG analysis using threshold-free cluster-enhancement and non-parametric statistics. NeuroImage, 67, 111–118. https://doi.org/10.1016/j.neuroimage.2012.10.027
- Mensen, A., Marshall, W., & Tononi, G. (2017). EEG differentiation analysis and stimulus set meaningfulness. Frontiers in Psychology, 8, 1748. https://doi.org/10.3389/fpsyg.2017.01748
- Meyer, A., Wheeldon, L., & Krott, A. (2007). Automaticity and control in language processing. Psychology Press. https://shorturl.at/fBOST
- Miozzo, M., Pulvermüller, F., & Hauk, O. (2015). Early Parallel Activation of Semantics and Phonology in picture naming: Evidence from a Multiple Linear Regression MEG study. Cerebral Cortex, 25(10), 3343–3355. https://doi.org/10.1093/cercor/bhu137
- Mognon, A., Jovicich, J., Bruzzone, L., & Buiatti, M. (2011). Adjust: An automatic EEG artifact detector based on the joint use of spatial and temporal features. Psychophysiology, 48(2), 229–240. doi:10.1111/j.1469-8986.2010.01061.x
- Morey, R. D. (2008). Confidence intervals from normalized data: A correction to Cousineau (2005). Tutorials in Quantitative Methods for Psychology, 4(2), 61–64. Scopus. https://doi.org/10.20982/tqmp.04.2.p061.
- Munding, D., Dubarry, A.-S., & Alario, F.-X. (2015). On the cortical dynamics of word production: A review of the MEG evidence. Language, Cognition and Neuroscience, 0(0), 1–22. https://doi.org/10.1080/23273798.2015.1071857
- Pernet, C. R., Chauveau, N., Gaspar, C., & Rousselet, G. A. (2011). LIMO eeg: A toolbox for hierarchical LInear MOdeling of ElectroEncephaloGraphic data. Computational Intelligence and Neuroscience, 2011(2011), 831409.
- Pernet, C. R., Latinus, M., Nichols, T. E., & Rousselet, G. A. (2015). Cluster-based computational methods for mass univariate analyses of event-related brain potentials/fields: A simulation study. Journal of Neuroscience Methods, 250, 85–93. https://doi.org/10.1016/j.jneumeth.2014.08.003
- Perret, C., & Bonin, P. (2019). Which variables should be controlled for to investigate picture naming in adults? A Bayesian meta-analysis. Behavior Research Methods, 51(6), 2533–2545. https://doi.org/10.3758/s13428-018-1100-1
- Peterson, R. R., & Savoy, P. (1998). Lexical selection and phonological encoding during language production: Evidence for cascaded processing. Journal of Experimental Psychology: Learning, Memory, and Cognition, 24(3), 539–557. https://doi.org/10.1037/0278-7393.24.3.539
- Piai, V., Roelofs, A., Acheson, D. J., & Takashima, A. (2013). Attention for speaking: Neural substrates of general and specific mechanisms for monitoring and control. Frontiers in Human Neuroscience, 7), doi:10.3389/fnhum.2013.00832
- Piai, V., Roelofs, A., & van der Meij, R. (2012). Event-related potentials and oscillatory brain responses associated with semantic and stroop-like interference effects in overt naming. Brain Research, 1450, 87–101. https://doi.org/10.1016/j.brainres.2012.02.050
- Posnansky, C. J., & Rayner, K. (1977). Visual-feature and response components in a picture-word interference task with beginning and skilled readers. Journal of Experimental Child Psychology, 24(3), 440–460. https://doi.org/10.1016/0022-0965(77)90090-X
- Rabovsky, M., Schad, D., & Abdel Rahman, R. (2021). Semantic richness and density effects on language production: Electrophysiological and behavioral evidence. Journal of Experimental Psychology: Learning, Memory, and Cognition, 47(3), 508. https://doi.org/10.1037/xlm0000940
- Rahman, R. A., & Aristei, S. (2010). Now you see it… and now again: Semantic interference reflects lexical competition in speech production with and without articulation. Psychonomic Bulletin and Review, 17(5), 657–661.
- Rayner, K., & Posnansky, C. (1978). Stages of processing in word identification. Journal of Experimental Psychology: General, 107(1), 64–80. https://doi.org/10.1037/0096-3445.107.1.64
- R core team. (2021). R: A Language and Environment for Statistical Computing. R Foundation for Statistical Computing, Vienna, Austria. http://www.R-project.org
- Riès, S. K. (2016). Serial versus parallel neurobiological processes in language production: Comment on munding, dubarry, and alario, 2015. Language, Cognition and Neuroscience, 31(4), 476–479. https://doi.org/10.1080/23273798.2015.1117644
- Roelofs, A. (2008). Tracing attention and the activation flow in spoken word planning using eye movements. Journal of Experimental Psychology: Learning, Memory, and Cognition, 34(2), 353. https://doi.org/10.1037/0278-7393.34.2.353
- Roelofs, A., Piai, V., Garrido Rodriguez, G., & Chwilla, D. J. (2016). Electrophysiology of cross-language interference and facilitation in picture naming. Cortex; a Journal Devoted to the Study of the Nervous System and Behavior, 76, 1–16. https://doi.org/10.1016/j.cortex.2015.12.003
- Rose, S. B., Aristei, S., Melinger, A., & Abdel Rahman, R. (2019). The closer they are, the more they interfere: Semantic similarity of word distractors increases competition in language production. Journal of Experimental Psychology: Learning, Memory, and Cognition, 45(4), 753–763. https://doi.org/10.1037/xlm0000592
- Rosinski, R. R. (1977). Picture-word interference is semantically based. Child Development, 48(2), 643–647. https://doi.org/10.2307/1128667
- Sassenhagen, J., & Draschkow, D. (2019). Cluster-based permutation tests of MEG/EEG data do not establish significance of effect latency or location. Psychophysiology, 56(6), e13335. https://doi.org/10.1111/psyp.13335
- Schad, D. J., Vasishth, S., Hohenstein, S., & Kliegl, R. (2020). How to capitalize on a priori contrasts in linear (mixed) models: A tutorial. Journal of Memory and Language, 110, 104038. https://doi.org/10.1016/j.jml.2019.104038
- Schriefers, H., Meyer, A. S., & Levelt, W. J. M. (1990). Exploring the time course of lexical access in language production: Picture-word interference studies. Journal of Memory and Language, 29(1), 86–102. https://doi.org/10.1016/0749-596X(90)90011-N
- Schuhmann, T., Schiller, N. O., Goebel, R., & Sack, A. T. (2009). The temporal characteristics of functional activation in broca’s area during overt picture naming. cortex, 45(9), 1111–1116. https://doi.org/10.1016/j.cortex.2008.10.013
- Shao, Z., Roelofs, A., Acheson, D. J., & Meyer, A. S. (2014). Electrophysiological evidence that inhibition supports lexical selection in picture naming. brain Research, 1586, 130–142. https://doi.org/10.1016/j.brainres.2014.07.009
- Shao, Z., Roelofs, A., & Meyer, A. S. (2012). Sources of individual differences in the speed of naming objects and actions: The contribution of executive control. The Quarterly Journal of Experimental Psychology, 65(10), 1927–1944. doi:10.1080/17470218.2012.670252
- Shitova, N., Roelofs, A., Coughler, C., & Schriefers, H. (2017). P3 event-related brain potential reflects allocation and use of central processing capacity in language production. Neuropsychologia, 106, 138–145. https://doi.org/10.1016/j.neuropsychologia.2017.09.024
- Smith, S. M., & Nichols, T. E. (2009). Threshold-free cluster enhancement: Addressing problems of smoothing, threshold dependence and localisation in cluster inference. Neuroimage, 44(1), 83–98. https://doi.org/10.1016/j.neuroimage.2008.03.061
- Starreveld, P. A., & La Heij, W. (1996). Time-course analysis of semantic and orthographic context effects in picture naming. Journal of Experimental Psychology: Learning, Memory, and Cognition, 22(4), 896–918. https://doi.org/10.1037/0278-7393.22.4.896
- Strijkers, K., Costa, A., & Thierry, G. (2010). Tracking lexical access in speech production: Electrophysiological correlates of word frequency and cognate effects. Cerebral Cortex, 20(4), 912–928. https://doi.org/10.1093/cercor/bhp153
- Valente, A., Bürki, A., & Laganaro, M. (2014). Erp correlates of word production predictors in picture naming: A trial by trial multiple regression analysis from stimulus onset to response. Frontiers in Neuroscience, 8), https://doi.org/10.3389/fnins.2014.00390
- Van Schie, H. T., Wijers, A. A., Kellenbach, M. L., & Stowe, L. A. (2003). An event-related potential investigation of the relationship between semantic and perceptual levels of representation. Brain and Language, 86(2), 300–325.
- Wickham, H. (2009). Ggplot: Using the grammar of graphics with R. Springer. https://doi.org/10.1007/978-0-387-98141-3_3.
- Wong, A. W.-K., Chiu, H.-C., Wang, J., Cao, J., Wong, S.-S., & Chen, H.-C. (2017). An early locus of associative and categorical context effects in speech production: Evidence from an ERP study using the picture–word interference paradigm. Language, Cognition and Neuroscience, 32(10), 1305–1319. https://doi.org/10.1080/23273798.2017.1355060