
ABSTRACT
Electroencephalography may be a valuable tool for assessing lexico-semantic processing in conditions where behavioural measures are unreliable. Detecting and quantifying effects in individuals is crucial for clinical applications, but individual-subject analyses are frequently not reported, and are hampered by low signal-to-noise. Multivariate analyses (MVPA) may be more sensitive than traditional approaches, so we asked how robustly they could detect differential neural responses to semantically matched and mismatched word/picture pairs in individuals. With clinical application in mind, we compared data from a research-grade EEG system to concurrently recorded data from the wireless Emotiv EPOC + . In both EEG systems, despite robust group-level effects, we only detected statistically significant processing of lexico-semantic condition in 50% of individuals. Surprisingly, detection rates were similar for MVPA and univariate analyses. MVPA may be advantageous when individual responses are heterogeneous, but in this simple paradigm, lexico-semantic processing could not be reliably detected at the individual level.
1. Introduction
The ability to measure cognitive processing in individuals provides valuable information. Single-subject neuroimaging measures give insight into the variance in the population, and may provide a route to assessing cognitive abilities in clinical populations that have limited communication (e.g. Arbabshirani et al., Citation2017; Berlingeri et al., Citation2019; Coleman et al., Citation2009). In recent years there has been a growing interest in using electroencephalography (EEG) data to investigate lexico-semantic processing in individuals who may be difficult to assess behaviourally, such as those with disorders of consciousness, or minimally-verbal autism (Beukema et al., Citation2016; Cruse et al., Citation2014; Petit et al., Citation2020a). The N400 event-related component (ERP) has long been used as a neural marker of lexico-semantic integration, with larger negativity elicited for stimuli that are harder to integrate with their semantic context (Kutas & Federmeier, Citation2011). However, single-subject studies of the N400 have consistently reported a limit on the detection rate of the N400 response, especially for passive or covert tasks, even in healthy individuals. This limits its potential use as a biomarker in clinical populations. Using auditory congruent and incongruent sentences, Cruse et al. recorded an N400 effect in a maximum of only 17% of neurotypical adults during passive listening. Using a covert decision paradigm, Petit et al. (Citation2020b) recorded an effect in 50% of neurotypical children. Detection rates also vary with analysis choices. For instance, a recent attempt to characterise detection rate across different univariate analyses resulted in a large variation, from 22% to 89% of adults (Kallionpää et al., Citation2019). Kallionpää et al. highlight several challenges in designing reliable and objective measures of single-subject neural responses, including utilising all the data available, dealing with multiple comparisons, and avoiding a priori assumptions.
An attractive way to address these challenges is using machine-learning approaches, such as linear classification using multivariate pattern analysis (MVPA). This approach can use all the available EEG data from a participant, and employs supervised learning algorithms to decode experimental conditions from the data. The resulting dependent variable (e.g. decoding accuracy) reflects how distinct the patterns of neural activity are across conditions. We recently presented an MVPA approach in which data from all sensors and timepoints are combined in a single multivariate classification analysis (Petit et al., Citation2020b). This presents two major advantages over univariate ERP analyses. First, because it extracts a single decoding accuracy value per participant, there is no need to correct for multiple comparisons over sensors or time. Second, as it uses the data available from all time points and many sensors, it need not rely on any a priori assumptions about the timing or regions where an effect might occur. This may be especially important in analysing single-subject data, where inter-individual heterogeneity in neural signals is expected, and may be even more prominent among clinical populations. As such, multivariate approaches have been of great interest in contexts where it is valuable to eliminate subject averaging, including for single-trial analyses of N400-like effects (Dijkstra et al., Citation2019; Geuze et al., Citation2013; Tanaka et al., Citation2019; van Vliet et al., Citation2016, Citation2018; van Vliet & Salmelin, Citation2020; Wenzel et al., Citation2017). We previously reported that MVPA improved our individual-subject detection rate of neural signatures of semantic processing in neurotypical children from approximately 50% to 90% (Petit et al., Citation2020a). However, in another study we found only a slight advantage for MVPA over univariate analyses (Petit et al., Citation2020b), and MVPA detection rates in related N400 paradigms are variable (e.g. Dijkstra et al., Citation2020).
In addition to inter-individual variability in the topography and time-course of neural signals, another source of variation in N400 studies may derive from the choice of stimuli. Our previous work (Petit et al., Citation2020a; Petit et al., Citation2020b), and that of Cruse et al. (Citation2014), used spoken word stimuli. This was to accommodate populations for which visual processing is impaired or not present, such as patients with disorders of consciousness. However, auditory stimuli are by nature, extended in time. The recognition point of spoken words varies between items and across people (Van Petten et al., Citation1999), which may contribute to difficulty in detecting time-locked effects. In the current pre-registered study, we bypassed this issue by recording neural responses to pictures, which followed the presentation of either a matching or mismatching word. We expected that the recognition point for pictures would be more consistent than for spoken stimuli (Wagemans et al., Citation2012). This could allow better re-alignment between trials, and we predicted that this would allow us to detect N400-like responses more reliably than previously reported for spoken words (see e.g. Geuze et al. (Citation2013)for results with written word pairs). Thus, in this study we sought to quantify individual N400-like detection rates for pictures in healthy adults, in anticipation of developing a sensitive test for use with special populations.
Another crucial criterion for neural tests of cognition for clinical populations is the availability and tolerability of the testing equipment. In particular, traditional gel-based EEG systems, which require a long and uncomfortable setup, may not be tolerated by certain participant groups, such as autistic people or young children. With several portable alternatives to lab-based EEG setups emerging, research is needed to assess the reliability of these new systems. Emotiv’s EPOC+ system has gained attention as an inexpensive, fast-to-setup, portable EEG system. Previous research has found EPOC+ to reliably measure ERPs that are similar to those measured by research-grade systems (Badcock et al., Citation2015; de Lissa et al., Citation2015; De Vos et al., Citation2014), although this is less clear for ERPs associated with higher cognitive functions such as the N400 (Duvinage et al., Citation2013; Petit et al., Citation2020a). In addition, we have previously found that while EPOC+ could detect univariate N400s, its performance for analyses using multivariate decoding was relatively poor, and it failed to detect decodable neural responses to lexico-semantic manipulations that were measured by a research-grade system (Petit et al., Citation2020a). In this study, we sought to add to the evidence base regarding the sensitivity of the EPOC+ for lexico-semantic processing, focusing on whether EPOC+ recordings (compared to data acquired concurrently from a research-grade system) could be successfully decoded using MVPA at the individual-subject level using the picture paradigm.
The current study thus investigates the single-subject detection rate of neural responses to visual lexico-semantic manipulations using MVPA and univariate analyses in two EEG systems. We recorded neural responses to matched and mismatched word-picture pairs in healthy adults, and examined the individual detection rates. We hypothesised that multivariate analyses would be more sensitive than univariate analyses and we compared the responses recorded by a gel-based research-grade system with those of the saline-based EPOC+ portable EEG system.
2. Methods
Our hypotheses and analysis plan were preregistered on the Open Science Framework prior to data analysis (https://osf.io/mexkc).
2.1. Participants
Twenty adults were recruited from the participant pool of the MRC Cognition and Brain Sciences Unit (University of Cambridge). Participants had normal or corrected-to-normal vision. All participants received 20 pounds. The study was approved by Cambridge psychology research Ethics Committee (reference: PRE.2018.101). One participant’s data were excluded due to issues with stimulus presentation, leaving a sample of 19 participants (mean age 28.0 years, SD = 5.8 years, 11 female and 8 male).
2.2. Stimuli
Words were selected from the Picture Vocabulary Test (PPVT) 4th edition forms A and B (Dunn & Dunn, Citation2007), and the Oxford Communicative Development Inventory extended form (Oxford CDI, Hamilton et al., Citation2000). The Oxford CDI is a list of words found to be used by a sample of 669 British children aged 1–2 years. We selected words that matched the following criteria: first, we selected words that were readily known by 5 years of age. For the PPVT, this included words from set 4 and below. There was no age selection for the Oxford CDI words as they should be known by children as young as 2 years old. Second, we removed words that have multiple noun definitions that could lead to more than one image coming to mind. Third, we selected words that were highly imaginable according to the N-watch library (Bird et al., Citation2001), where available (for 86% of the words). A high imageability score was defined as 460 or higher (Bird et al., Citation2001). Our final word list had a mean imageability score rating of 605.125 (SD = 28.09044, range = [532, 668]). Finally, we matched each word with an image from the PPVT 4, ensuring that the visual imagery remained consistent in style. This resulted in 110 word/picture pairs that constituted our “match” condition.
To create our “mismatch” condition, the word stimuli were paired with a different image within the set. We avoided visual, semantic, and phonological similarities in the mismatches. We avoided pairing body parts (e.g. leg) and animals (e.g. dog) as animal images frequently included body parts. We also avoided pairing within categories (i.e. household items with household items) to increase semantic distance. Lastly, we made sure that the mismatch word/picture pairs did not start with the same phonological sound as their match counterpart. In sum, our stimuli list comprised 110 match and 110 mismatch word/picture pairs, with each word and each picture appearing exactly once in the match condition, and once in the mismatch condition. Stimuli were presented in a fixed pseudo random order that ensured that the same words and pictures were not presented in proximity (minimum 6 trials before repeating a word or picture), and that no more than 5 consecutive trials would be of the same condition (match or mismatch).
2.3. Experimental task
All trials started with 4s of a fixation cross presented on a white background, followed by a central presentation of a word in large black text for 1s. Immediately afterwards a picture was displayed that remained on screen for another 4s. On all trials, participants were instructed to covertly decide whether the word and picture matched or mismatched. To monitor attention, every 6–9 trials we additionally probed participants for an overt match/mismatch decision, which they indicated with a button press.
To make this paradigm engaging for both children and adults, we embedded the task in a game. In this “catch the evil aliens” game, participants were told that aliens with no prior knowledge of earth would always pair words with the wrong image while humans always paired words with the correct image. In order to catch the evil aliens, participants had to correctly identify the word-picture pairings as matched (i.e. “made by a human”) or mismatched (i.e. “made by an alien”). On the majority of trials, we did not ask for an overt response, and the next trial started immediately. However, every 6–9 trials, after the picture was shown for 4s, we presented a human and an alien icon on the left and right of the screen (position randomised over trials to avoid response preparation). Participants were instructed to press the left or right arrow key to indicate their choice, and to do so as quickly as possible. They were given up to 3s to respond. We then provided visual and auditory feedback. The goal was to respond “human” to matched trials, thus sending humans to the exit, and to respond “alien” to mismatched trials, thus sending aliens to prison. Therefore on match (human) trials they saw either a human exiting (correct) or behind bars (incorrect), and on mismatch (alien) trials they saw either the alien exiting (incorrect) or behind bars (correct). Audio feedback was cheering “Yay!” for correct or “oh no!” for incorrect.
Before commencing the recording session, participants completed a practice task of 6 trials using stimuli that were not present in the actual experiment. Then, they completed the task in a 25-minute recording session.
2.4. EEG recording and preprocessing
Participants were seated in a comfortable chair in a quiet testing booth. EEG was continuously recorded from two systems: Brain Product’s Acticap and Emotiv’s EPOC+ system. We also applied electrodes to measure heart rate (heart rate data not reported here).
2.4.1. Acticap system
The Acticap system comprised 33 scalp Ag/AgCl active electrodes mounted on an 128-channel electrode cap (Easycap, Falk Minow Services, Herrsching-Breitbrunn, Germany) using SynAmps AC amplifiers (NeuroScan Labs, Sterling, VA; amplifier bandpass was 0.1–100 Hz), arranged according to the extended 10/20 system with Cz reference and re-referenced offline to the average of the two mastoids (TP9, TP10; see ). We kept the impedance for electrodes below 5 kΩ. Data were recorded with a sampling rate of 500 Hz. We recorded eye-movements using an additional 4 electrooculogram (EOG) electrodes placed above and below the right eye (vertical) and at the outer canthi (horizontal).
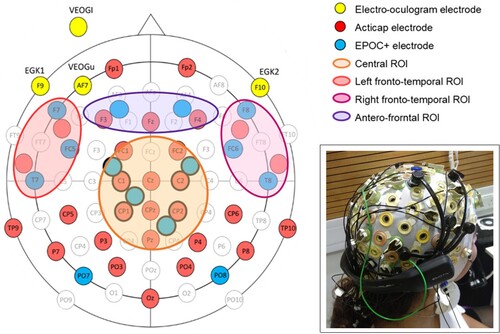
Figure 1. Electrode locations for the Acticap (red) and EPOC + system (blue), and 4 ROIs chosen for our analyses (Central ROI in orange, left fronto-central ROI in red, right fronto-central ROI in pink, and antero-frontal ROI in purple). Inset in the bottom right shows the double setup on a participant’s head.
2.4.2. EPOC+ system
The EPOC+ system comprised 14 gold-plated electrodes mounted on a headset. We modified the headset so that we could position EPOC+ electrodes adjacent to Acticap electrodes (). In particular, we ensured that 4 electrodes covered the centro-parietal region, where the N400 effect is often reported to be the largest (Kutas & Federmeier, Citation2011), but where there are no electrodes in the default EPOC+ setup. To do this, we first rotated the position of the EPOC+ headset posteriorally on the participant’s head, so that the sensors designated for F3 and F4 were located adjacent to Acticap electrodes C1 and C2 at FCC3 h and FCC4 h. Next, we wired 2 passive Silver/Silver-Chloride (Ag/AgCl) electrodes into the Emotiv sensors designated for P7 and P8, and connected them alongside the Cz and CPz locations at CCP1 h and CPP2 h. The EPOC+ was placed over the top of the 128 channel EasyCap cap, which we modified to allow connection between the EPOC+ electrodes and the scalp. In particular, we replaced the rubber Acticap electrode holders at FCC3 h, FCC4 h, CCP1 h, and CPP2 h, with 3D printed circular holders. We also cut two holes in the cap directly anterior and medial to F3 and F4, and placed another 3D printed holder in each of these new holes. Each 3d printed holder allowed a saline-solution-soaked cotton wool roll to pass through the cap and bridge the EPOC+ electrodes to the scalp (see inset in ). M1 acted as the online reference, and M2 was a feed-forward reference that reduced external electrical interference. The signals from the other 14 channels were recorded with a sampling rate of 256 Hz, and the effective recorded bandwidth was 0.16–43 Hz.
Event-marking was done through a custom trigger box, based on the design of Thie (Citation2013). Immediately after the start of each word and each picture stimulus, an auditory tone at one of 3 frequencies (corresponding to word onset, match picture onset and mismatch picture onset) was sent to the trigger box via a headphone jack connector. The box transcribed the tone frequency into a virtual keyboard event (with label 1, 2 or 3) which was recorded in the EmotivPro recording software as an event marker through a USB connection. The trigger box responded with a fixed latency of 12 ms, which was accounted for in the analysis (below). Immediately after the sound began to play, a trigger was sent from the stimulus presentation computer to the Acticap’s recording software via parallel port. This allowed us to realign data from the two systems.
2.4.3. Preprocessing
All data analyses were performed in Matlab R2017a. Preprocessing was done with EEGLAB version 2020 (Delorme & Makeig, Citation2004). For each participant and EEG system, we first filtered the data offline (bandpass filter .1–30 Hz), then downsampled the Acticap data to 256 Hz to match the EPOC+ sampling rate. Then, we epoched the data relative to the onset of the target images, from 100 ms before to 900 ms after onset. We ran an independent component analysis on the epoched data using EEGLAB’s “runica” function, and manually identified the components matching characteristics of eye-blinks and eye-movements based on their topography, timecourse, and power spectrum, which we then removed. We then removed the average signal in the baseline (−100 ms to 0 ms) from each sample in the epoch. We then carried out two analyses of the data, univariate and multivariate. For each analysis, we grouped the data into four predefined regions of interest (ROI): a central, a left fronto-temporal, a right fronto-temporal, and an antero-frontal region (see ). These regions were chosen to cover most of the centro-anterior regions, and lateral regions, which typically correspond to the regions of the N400 effect (Kutas & Federmeier, Citation2011; Petit et al., Citation2020b). Regions which were unlikely to show any differential neural responses to semantic manipulations, such as occipital areas, were not included in our analysis. For both analyses, we averaged the data across channels in each ROI. Note that the Acticap EEG system has a higher density of electrodes than EPOC+, thus the number of electrodes within each ROI varies between the two systems. To minimise the noise in our individual subjects’ data, and reporting “best case” detection rates in each, we used the maximum number of electrodes that were available for each system.
2.4.4. Multivariate pattern analyses (MVPA)
First, we assessed whether there was information in the neural signals that discriminated the experimental conditions (matched and mismatched), using MVPA. These analyses were done with the CoSMoMVPA toolbox (Oosterhof et al., Citation2016), which uses the LIBSVM library (Chang & Lin, Citation2011). We submitted the data to a support vector machine (SVM) classifier, and we computed two measures: unconstrained MVPA using the data from all time points, and time-resolved MVPA using the data from a sliding time-window across the epoch (see below). We first averaged the data over channels within our 4 ROIs (see ). Then, we created pseudo-trials to boost signal relative to noise (Goddard et al., Citation2022; Grootswagers et al., Citation2017). Each pseudotrial consisted of the median of 5 trials randomly selected (without replacement) from one condition. Pseudotrials were paired across the two experimental conditions, such that the 5 target images that were chosen for a pseudotrial in the match condition were the same target images in the pseudotrial for the mismatch condition. Using the median (rather than mean) across the 5 trials allowed us to reduce the impact of trials with extreme amplitude (i.e. noise) without having to reject them during preprocessing, keeping our paired design balanced.
Then, we submitted the pseudotrial data from the 4 ROIs, concatenated over all the timepoints, to the SVM, using leave-one-pseudotrial-out cross-validation. The cost of misclassification parameter “c” was kept at the default value of 1. We repeated this decoding 100 times, randomly selecting different trials to form the pseudotrials, and averaged the decoding accuracy over the 100 repetitions to obtain the temporally-unconstrained decoding accuracy for each individual. To test for significance, we then repeated the same classification scheme 1000 times on the data with randomly permuted labels (each trial was randomly assigned a condition label “match” or “mismatch”, before being averaged into pseudotrials), creating a null distribution of decoding accuracies. Finally, we compared the decoding accuracy from the correctly labelled data to this null distribution. The proportion of permutations that have a higher accuracy than the correctly labelled decoding accuracy corresponds to the p-value (e.g. if the obtained data accuracy is > 95% of the permuted accuracies, p = .05).
To examine the timecourse of decodable information, we also ran the decoding analysis across time. For this, we submitted the pseudotrial data from all the ROIs, and from each time-point and its neighbouring 10 timepoints (5 on each side) to the SVM, and repeated the classification across time-points. This resulted in a decoding accuracy score per timepoint across the epoch (−100 to +900 ms). We tested for significance using permutations as follows. We repeated this classification scheme 1000 times on the data with randomly permuted labels, and evaluated our decoding accuracy against this null distribution, across time-points. Finally, to correct for multiple comparisons across the timecourse (one test per timepoint), we used a threshold-free cluster enhancement (TFCE) approach (Smith & Nichols, Citation2009). First, we transformed the observed (correctly labelled) and each permutation into a TFCE statistic, which takes into account the amplitude and temporal extent of decoding accuracy. Then we extracted the highest TFCE value for each permutation, creating a null-distribution of the largest effect occurring by chance across permutations. We then compared the TFCE statistic of our correctly labelled data with this null distribution, to extract a p-value (i.e. the proportion of permutations with a higher maximum TFCE than the correctly labelled data).
For group-level analyses, we averaged the decoding accuracy across participants.
We tested for significance using Monte Carlo cluster statistics with TFCE. We generated 10,000 permutations of the group-average data with shuffled labels, and compared the group decoding accuracy to this null-distribution.
The choice to use 5 trials per pseudotrial was made a priori, as a compromise between having fewer samples to train and test the SVM, but each sample being potentially cleaner. To explore, post hoc, whether a difference choice might have substantially improved decoding, we ran simulations using different numbers of trials/pseudotrial, on simulated data. We used CosMoMVPA’s “cosmo_synthetic_dataset” function to simulate 100 datasets, each consisting of 110 trials in each of two conditions (matching our experimental design), and a medium effect size (sigma = 0.2). For each dataset, we then calculated decoding accuracy using 1, 2, 5, 10, 11, 22 and 55 trials/pseudotrial, as these values allowed all 110 trials to be used. We used the same classifier and cross-validation scheme as in our main analysis. We observed that varying the number of trials/pseudotrial affected both the mean and the variance of the decoding accuracy across datasets, so we quantified this relationship as a t-score (ratio of decoding accuracy – 50 to standard error across datasets). As shown in supplementary Figure 1a, using any number of pseudotrials yielded higher t-scores than using all trials, except in the extreme case where the classifier is given only 2 pseudotrials per condition. These simulations suggest that there might have been a minimal gain in using 10 trials/pseudotrial instead of 5, as preregistered, but that overall 5 trials/pseudotrial was a reasonable choice. We also ran these simulations with no effect size (sigma = 0), to illustrate that our method using the median of pseudotrials did not create false positive effects (mean decoding accuracy remained at 50%, Supplementary Figure 1b). Additionally, at the request of a reviewer, we added an exploratory analysis in which we re-ran the single-subject time resolved decoding analysis using the Acticap data from single trials, instead of the median of 5 pseudotrials.
2.4.5. Univariate N400 analyses
As pre-registered, we additionally used univariate analyses, both at the group level and individual level, to illustrate the response to each condition for each system in a more familiar manner that can more easily be compared to previous literature. First, for each participant, we rejected each trial whose amplitude exceeded ±200 µV, in each channel separately. In addition, the corresponding pair of each rejected trial was rejected as well, to keep the design paired (e.g. if the trial for the image “spoon” was rejected in the matched condition, we also rejected the trial for the image “spoon” from the mismatched condition). On average across participants, a total of 12 trials were rejected from the Acticap data (range [0: 66]), and 10 trials from the EPOC+ data (range [0: 88]). Then, we averaged the accepted epochs within each ROI for each condition, and examined the difference between conditions across time. For each ROI at each timepoint after 150 ms post-stimulus onset, we computed a paired, one-tailed t-test between the two conditions. We only analysed the timepoints after 150 ms as we did not expect to observe an N400 effect earlier than this point. We pre-registered a one-tailed analysis for this because the direction of the univariate effect is pre-specified (a larger negative-going potential for the mismatch condition). To correct for multiple comparisons across time, we used a temporal cluster correction, based on the methods of Guthrie and Buchwald (Citation1991), as in our previous work (Petit et al., Citation2020a; Petit et al., Citation2020b). Finally, we corrected for 4 comparisons across ROIs using a Bonferroni correction by comparing the p-value of each test to 0.0125 (which corresponds to 0.05/4). This was done at the individual-subject level (variance across trials), and at the group level (variance across subjects).
Finally, we computed the effect size of the effect by taking the difference between the congruent and incongruent condition, averaged across all time points between 200 and 500 ms, and across all 4 ROIs, and divided by the standard deviation across trials.
2.4.6. Comparison between EEG systems
In order to compare the signal recorded by the two EEG systems, we additionally calculated intraclass correlations (ICC) (Badcock et al., Citation2015; Petit et al., Citation2020a; Williams et al., Citation2020) on the ERP waveforms for the matched and mismatched conditions separately, using a custom Matlab script. ICC values reflect the similarity of waveforms in terms of shape and amplitude, and vary from 1 (the waveforms are the same) to −1 (the waveforms are opposite), with 0 indicating no correlation. For each ROI, we ran ICC between Acticap and EPOC+ data for each participant and each condition, and assessed their significance by computing the group 95% confidence interval.
2.4.7. Topographic distribution of neural signals
Finally, to illustrate the topographic distribution of neural signals across conditions over time, we calculated the area between the matched and mismatched ERP at each channel at each timepoint using the data from Acticap. We then projected this onto a 2-dimensional head plot. This was done at the individual-subject level (variance across trials), and at the group level (variance across subjects).
3. Results
In this study, we aimed to quantify the individual subject detection rate of neural responses to semantically matched and mismatched pairs of words/pictures in healthy adults, using EEG.
3.1. Behavioural results
Participants performed the task with high accuracy, indicating that they made correct lexico-semantic decisions for the word-picture pairs (mean accuracy = 96%, sd = 5%; mean reaction time = 1.5 sec, sd = 0.4 sec).
3.2. Unconstrained MVPA
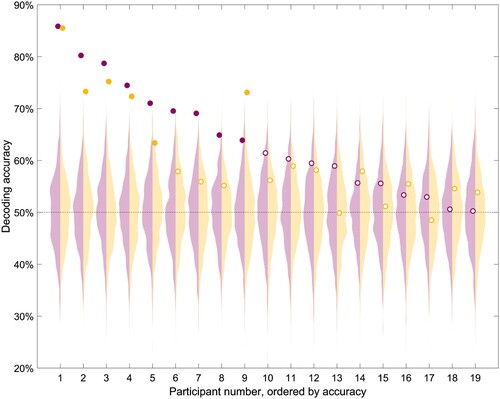
First, we trained an SVM classifier to distinguish the neural patterns between the matched and mismatched condition, using the data available from four ROIs and all the timepoints of the epochs. Using this method, classification accuracy was significantly above chance for 9 participants (47%) using Acticap’s data, and 6 participants (32%) using EPOC+” data (). This indicated that lexico-semantic matching of pictures and words could be decoded from neural signals of about half of participants individually.
Figure 2. Individual-subject decoding accuracy for a SVM classifier trained to distinguish between matched and mismatched pairs of words-pictures, for Acticap (purple) and EPOC + (yellow) data. Circles indicate the accuracy, with full circles representing significantly above-chance decoding (chance is 50%) according to the permutation test for that participant. Null distributions of accuracy obtained by permutations are shown as a violin plot for each person, with Acticap distribution in light purple and EPOC + distribution in light yellow. Participants are ordered according to Acticap decoding accuracy in this analysis, and this order will remain the same for all other figures.
3.3. Time-resolved MVPA
To further evaluate the time-course of neural information following presentation of the matched and mismatched pictures, we additionally trained a classifier to discriminate between those conditions in a time-resolved manner.
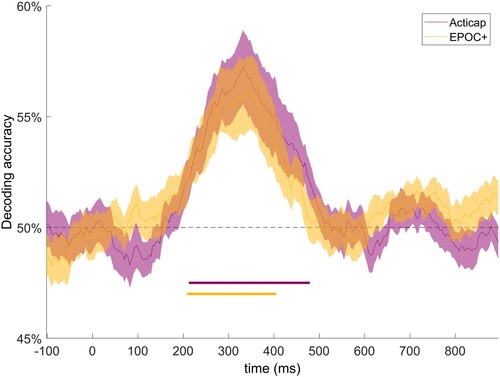
At the group level, MVPA revealed above-chance decoding accuracy between 200 and 500 ms for Acticap’s data, and between 200 and 400 ms for EPOC+, with a peak accuracy around 350 ms (). This result suggests that neural patterns discriminate lexico-semantic conditions as early as 200 ms, with a peak of accuracy around 350 ms. Results from both EEG systems are similar in shape and magnitude, indicating that EPOC+ captures similar neural responses to Acticap at the group level.
Figure 3. Grand average (N = 19) time-resolved decoding accuracy for a SVM classifier trained to distinguish between matched and mismatched pairs of words-pictures, for Acticap (purple) and EPOC + (yellow) data, shown with standard error of the mean. Time points with significant decoding (p < .05, assessed with threshold-free cluster enhancement permutation tests corrected for multiple comparisons; see Method section) are shown by a purple (Acticap) and yellow (EPOC+) horizontal line at the bottom. Decoding accuracy was significantly above chance for both systems between 200 and 400 ms, extending to 500 ms for Acticap.
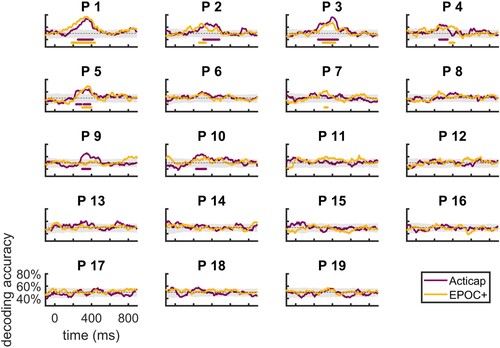
Next, we used MVPA to investigate the timecourse of decoding accuracy in individuals (). Using this approach, we could decode lexico-semantic processing in 7 participants (37%) using Acticap, and in 6 participants (32%) using EPOC+. As expected, this analysis was slightly less sensitive than the unconstrained MVPA approach, since here the classifier only had access to data at each time-point separately, and couldn’t extract patterns across the entire time-series. Interestingly, the sensitivity of this time-resolved decoding was comparable across both EEG systems, indicating that EPOC+ may be as suitable for MVPA as Acticap at the individual-subject level. As an additional analysis, we also ran this analysis using all channels from either system instead of the 4 pre-defined ROIs. This resulted in two additional participants showing significant decoding with Acticap, but no difference in EPOC+. This points to a slight advantage of using all available channels in multivariate analyses (33 channels for Acticap versus 14 for EPOC+).
Figure 4. Single-subject time-resolved decoding accuracy for a SVM classifier trained to distinguish between matched and mismatched pairs of words-pictures, for Acticap (purple) and EPOC + (yellow) data. Shaded grey area shows the null distribution of accuracy for Acticap, obtained by permutations. For clarity of presentation, the EPOC + null distribution is not shown, as it looks similar. Time points with significant decoding (p < .05, assessed with threshold-free cluster enhancement permutation tests corrected for multiple comparisons; see Methods) are shown by a purple (Acticap) and yellow (EPOC+) horizontal line at the bottom of each plot. Decoding accuracy was significantly above chance in at least one cluster of time points for 7/19 participants using Acticap, and for 6 participants using EPOC + .
Finally, at the request of a reviewer we also ran an additional exploratory analysis on the Acticap data, where we used the data from single trials for decoding, instead of the median of 5 pseudotrials. Although the decoding traces were noisier and the null distribution from permutation tended to be wider, the same number of participants (7/19) showed decoding accuracy that was significantly above chance (Supplementary Figure 2).
3.4. Univariate analyses
To further investigate the direction and topography of neural responses to matched and mismatched pairs of words-pictures, we computed univariate analyses across conditions, both at the group and single-subject level.
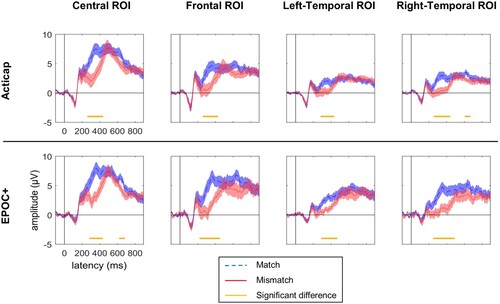
At the group level, we replicated the N400 effect in all 4 ROIs for both systems (). Interestingly, it appears that two peaks of negativity (mismatch more negative than match condition) were recorded: an early negative effect from 250 ms to 450 ms, and a later negativity starting around 600 ms.
Figure 5. Grand average (N = 19) ERP response to pictures that followed matched (blue) and mismatched (red) words. Results for four regions of interests (ROI) are shown for Acticap (top) and EPOC + (bottom). Time-points with a significant difference between conditions are indicated with an orange horizontal line, after Bonferroni correction for 4 tests (one test per ROI). Group-level N400 effects are present in all 4 ROIs for both EEG systems, with markedly similar timecourses and amplitudes between the two systems.
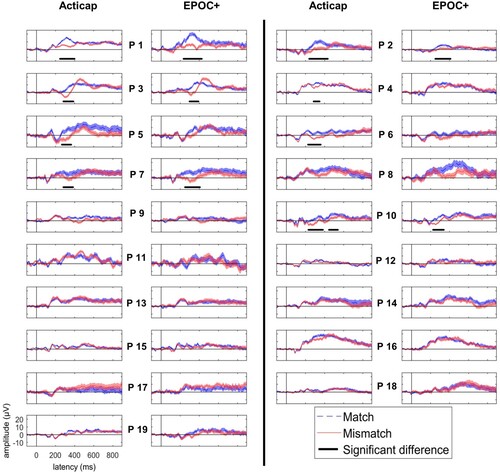
At the individual subject level, we found a significant N400 effect in at least one ROI in 9 subjects (47%) using Acticap, and 7 subjects (37%) using EPOC+. Results from the central ROI are plotted on for both systems. Results again appear consistent across EEG systems, with only one fewer participant showing a statistically significant N400 effect for EPOC+ compared to Acticap. In addition, we calculated the mean effect size of the N400 effect across participants. The effect size was 0.13 for Acticap and for EPOC+.
Figure 6. Individual-subject ERP responses to pictures that followed matched (blue) and mismatched (red) words, for a central ROI for Acticap (columns 1 and 3), and EPOC + (columns 2 and 4). Time-points with a significant difference between match and mismatch conditions are shown as a black horizontal line. In this ROI, 8 participants show an N400 effect with Acticap, and 5 participants with EPOC + .
3.5. Comparison between systems
ICC confirmed that both EEG systems recorded similar data, as suggested by visual comparison of the traces in . Average ICC scores across participants and ROIs are reported in . All ICCs were over 0.30, and none of the confidence intervals included 0, indicating a significant correlation in the waveforms recorded by Acticap and EPOC+.
Table 1. Intraclass correlation values and 95% confidence interval (CI) for the ERP recorded in each ROI and each condition across the two EEG systems.
3.6. Topographic distribution
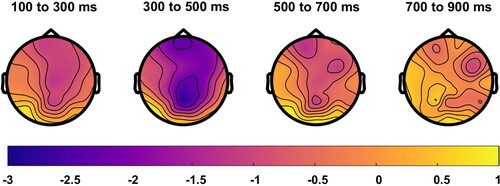
At the group level, the effect of condition was strongest in the 300–500 ms window post-stimulus onset, in a large region from centro-pariental to centro-frontal areas ().
Figure 7. Grand-average topographic distribution of N400 effects across time. Blue colours indicate more negative responses for the mismatched condition, and yellow colours indicate more negative responses for the matched condition. An N400 effect (mismatched < matched) is seen in parietal to frontal central regions, and is strongest from 300 to 500 ms post-stimulus onset.
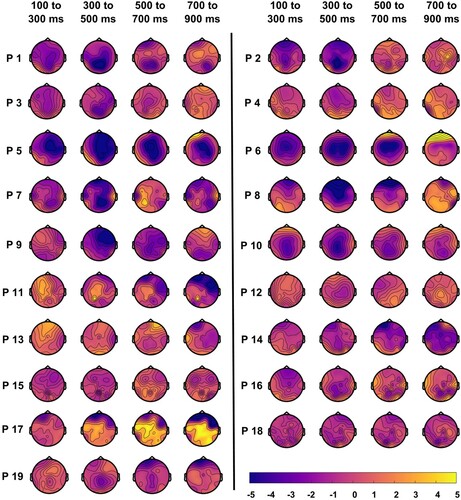
At the individual-subject level, N400 effects varied slightly in topography and timing, with effects typically the strongest in central to frontal areas, and from 300 to 500 ms ().
Figure 8. Individual-subject topographic distribution of N400 effects across time. Blue colours indicate more negative responses for the mismatched condition, and yellow colours indicate more negative responses for the matched condition. N400 effect location and timing varied slightly across individuals.
4. Discussion
There is growing interest in using neuroimaging to measure cognitive processing in individuals. Here, we asked whether a robust neural marker of lexico-semantic processing, the N400, can be detected at the individual subject level, in adults performing simple word-picture matching. We tested this using both univariate and multivariate analysis approaches. Given the potential to examine receptive language processing in individuals that are traditionally difficult to test, such as those with minimally-verbal autism, we also examined whether an accessible, portable and inexpensive EEG technology (Emotiv’s EPOC+) would provide comparable results to a research-grade EEG system. We found that, first, individual subject detection rates in this paradigm were around 50%. Second, contrary to our previous findings, there was no improvement in individual-subject detection rate with multivariate, compared to univariate, analyses. Finally, data and detection rates were similar between research grade and portable EEG systems.
Using data from a research-grade Acticap EEG system, lexico-semantic category was readily decodable from the EEG signal at the group level. A linear classifier could differentiate between identical pictures presented in matching or mismatching lexico-semantic contexts from 200 ms after picture onset. Similarly, univariate analyses revealed a significant N400 effect in all 4 ROIs starting from ∼ 250 ms to ∼450 ms, with slight variations across ROIs. This is consistent with previous findings on N400 effects in word-picture paradigms (Ganis et al., Citation1996; Hamm et al., Citation2002; Nigam et al., Citation1992). However, at the individual-subject level, we only saw statistically significant effects in around 50% of participants with either type of analysis. This is difficult to compare to previous word-picture N400 paradigms, as individual subject statistics have not, to our knowledge, been reported before. It matches roughly the (univariate) individual-subject detection rate reported in a covert auditory paradigm with semantically associated word pairs with adults (58%, Cruse et al., Citation2014), and with normatively associated word pairs, or sentences, in children (50% and 64%, Petit et al., Citation2020a). However, it is notably lower than the individual-subject detection rate achieved with multivariate analysis of children covertly counting incongruent sentences (90%, Petit et al., Citation2020a), or of adults overtly reporting the relatedness of written word pairs (Geuze et al., Citation2013).
Several aspects of our design could have contributed to the relatively low individual-subject detection rates. First, it is possible that single words simply do not produce expectations that are strong enough to elicit reliable N400 or N400-like effects (Debruille, Citation2007), which would explain weak individual-subject responses. Second, it is possible that the behavioural paradigm we used was not optimal to engage strong lexico-semantic neural processing in some participants. In their infrequent behavioural task, participants were required to match a picture with a word. Since we planned to extend this task for use with children in the future, we chose the words to be high-frequency, high-imageability words. This likely made the task trivial for adults. Similarly, we chose a covert design (with infrequent responses) in anticipation of adapting this paradigm to populations with communication difficulties. Previous data has suggested that N400 rates in individuals are notably higher when a task is more active (Cruse et al., Citation2014), and, similarly, group level N400 effects are thought to be stronger when the task is more difficult (Debruille, Citation2007; Fischer-Baum et al., Citation2014), when the task requires higher level of processing (Chwilla et al., Citation1995), and/or when participants attend closely to the stimuli (Hubbard & Federmeier, Citation2021; Okita & Jibu, Citation1998; Zhang & Zhang, Citation2007). Here, the infrequent and trivial (for typical adults) nature of our task may have hindered our ability to detect effects in individuals. Interacting with these design considerations is the issue of statistical power. For univariate analyses, with 100 trials per condition (after trial rejection), post-hoc power analyses suggest that we achieved 63% power to detect small effect sizes (effect size d = 0.2). However, post-hoc calculations suggests that the effect size in our data was in fact smaller thank this on average (d = 0.13). With 100 trials, the power to detect effects of this size was only 36%. More power could be achieved by increasing the number of trials, but here we prioritised a short, one-session design, which could more easily be conducted with special populations.
The second main finding from this study was that detection rates were similar across two analysis types, univariate and MVPA (9/19 participants for both). Our prediction was that MVPA would yield better detection rates than univariate since (1) it does not require multiple comparison correction, and (2) the direction, timing and topography of effect is not specified, meaning that MVPA can in theory detect significant effects that are idiosyncratic to each individual. Our prediction also derived from our previous data in which switching from univariate to multivariate analyses improved detection rates from 50 to 90% (Petit et al., Citation2020a). However, in the current study, MVPA conferred no benefit. One possible explanation is that since MVPA is robust to differences in spatio-temporal patterns of neural activity between participants, it is advantageous primarily when there is high inter-individual variability in the neural signal. Exploratory analyses revealed that intra-individual variability was low (mean standard deviation between trials: 13 µV) and inter-individual variability was also low (mean standard deviation between participants: 2.5 µV). Several differences exist between this and our previous study with auditory stimuli in children (age of participants, task, different EEG system, slightly different analyses pipelines). However, as an indication, the intra-individual variability was almost twice as large (mean intra-individual standard deviation: 21.6 µV), and the inter-individual variability was also greater (mean inter-individual standard deviation: 3.20 µV) in our previous dataset that benefited from MVPA. The topographic plots of the N400 effect are also notably more homogeneous here than in our previous data (Petit et al., Citation2020a). Although more work is needed to confirm this hypothesis, it is possible that the advantage of MVPA may be conferred primarily when inter-individual variability is high. It is also possible that detection rates may yet improve as methods are developed to refine multivariate analyses in the future, for example using post-hoc modification (e.g. van Vliet and Salmelin (Citation2020)) of linear multivariate models, or using other non-linear approaches such as deep learning.
It is important to note that the unconstrained MVPA approach we used is agnostic to the timing and location of neural effects, and so positive decoding is not necessarily driven by amplitude differences at timepoints, location, or polarity, that would correspond to the N400 ERP. Instead, the classifier could pick up on subtle changes in patterns, extending in space and/or time, that are not related to the traditional N400 component, but do reliably differentiate between the match and mismatch condition. This could also include differential patterns of eye movements (e.g. van Vliet & Salmelin, Citation2020). It may be helpful to unpack the basis of any unconstrained MVPA effect using time-resolved decoding and/or univariate analysis, as demonstrated here, and/or to check explicitly for eye-movement driven effects (Mostert et al., Citation2018; Quax et al., Citation2019). On the other hand, a relative lack of specificity of the effect may be acceptable where the goal is to infer whether an individual shows any differential context-dependent processing of identical stimuli, rather than specifying what that difference is (Petit et al., Citation2020b).
The final goal of this study was to validate the use of a portable, consumer-grade EEG system, Emotiv EPOC+, to record neural signals. At the group level, for both MVPA and univariate analyses, we found highly comparable results between EPOC+ and our research-grade, Acticap, system ( and ). Moreover, at the individual level, intraclass correlations between the two systems confirmed that the waveforms were highly similar. Nonetheless, we observed a slight drop in individual detection rate using EPOC+ compared to Acticap for both types of analyses. Importantly here, we modified the EPOC+ configuration to include electrodes on centro-parietal areas, where the N400 is shown to be the largest. This likely contributed to the higher detection of N400 and N400-like effects with EPOC+ compared to our previous study that used the original EPOC+ electrode locations (Petit et al., Citation2020a). The advantages of the portable EPOC+ for testing special populations (e.g. rapid setup, possibility to test participants at home, low cost, no use of gel) will always need to be weighed up against the slightly lower sensitivity of this system, but in the current data the results were highly comparable.
5. Conclusion
We report individual-subject N400 detection rates in adults during a short, simple word-picture matching paradigm using two analysis approaches and both a research-grade and a portable EEG system. Although group level results were consistent with previous N400 literature, and lexico-semantic condition was decodable from neural signals using MVPA, the detection rate at the individual-subject level was only modest. This paradigm would need to be substantially refined before using it in clinical settings to assess lexico-semantic processing in individuals.
Supplemental Material
Download MS Word (348.3 KB)Disclosure statement
No potential conflict of interest was reported by the author(s).
For the purpose of open access, the author has applied a Creative Commons Attribution (CC BY) licence to any Author Accepted Manuscript version arising from this submission.
Additional information
Funding
References
- Arbabshirani, M. R., Plis, S., Sui, J., & Calhoun, V. D. (2017). Single subject prediction of brain disorders in neuroimaging: Promises and pitfalls. NeuroImage, 145(Pt B), 137–165. https://doi.org/10.1016/j.neuroimage.2016.02.079
- Badcock, N. A., Preece, K. A., de Wit, B., Glenn, K., Fieder, N., Thie, J., & McArthur, G. (2015). Validation of the Emotiv EPOC EEG system for research quality auditory event-related potentials in children. PeerJ, 3, e907. https://doi.org/10.7717/peerj.907
- Berlingeri, M., Magnani, F. G., Salvato, G., Rosanova, M., & Bottini, G. (2019). Neuroimaging studies on disorders of consciousness: A meta-analytic evaluation. Journal of Clinical Medicine, 8(4), 516. https://doi.org/10.3390/jcm8040516
- Beukema, S., Gonzalez-Lara, L. E., Finoia, P., Kamau, E., Allanson, J., Chennu, S., Gibson, R. M., Pickard, J. D., Owen, A. M., & Cruse, D. (2016). A hierarchy of event-related potential markers of auditory processing in disorders of consciousness. NeuroImage: Clinical, 12, 359–371. https://doi.org/10.1016/j.nicl.2016.08.003
- Bird, H., Franklin, S., & Howard, D. (2001). Age of acquisition and imageability ratings for a large set of words, including verbs and function words. Behavior Research Methods, Instruments, & Computers, 33(1), 73–79. https://doi.org/10.3758/BF03195349
- Chang, C.-C., & Lin, C.-J. (2011). LIBSVM: A library for support vector machines. ACM Transactions on Intelligent Systems and Technology, 2(3), 1–27. Article number 27. https://doi.org/10.1145/1961189.1961199
- Chwilla, D. J., Brown, C. M., & Hagoort, P. (1995). The N400 as a function of the level of processing. Psychophysiology, 32(3), 274–285. https://doi.org/10.1111/j.1469-8986.1995.tb02956.x
- Coleman, M. R., Davis, M. H., Rodd, J. M., Robson, T., Ali, A., Owen, A. M., & Pickard, J. D. (2009). Towards the routine use of brain imaging to aid the clinical diagnosis of disorders of consciousness. Brain, 132(9), 2541–2552. https://doi.org/10.1093/brain/awp183
- Cruse, D., Beukema, S., Chennu, S., Malins, J. G., Owen, A. M., & McRae, K. (2014). The reliability of the N400 in single subjects: Implications for patients with disorders of consciousness. NeuroImage: Clinical, 4, 788–799. https://doi.org/10.1016/j.nicl.2014.05.001
- Debruille, J. B. (2007). The N400 potential could index a semantic inhibition. Brain Research Reviews, 56(2), 472–477. https://doi.org/10.1016/j.brainresrev.2007.10.001
- de Lissa, P., Sorensen, S., Badcock, N., Thie, J., & McArthur, G. (2015). Measuring the face-sensitive N170 with a gaming EEG system: A validation study. Journal of Neuroscience Methods, 253), https://doi.org/10.1016/j.jneumeth.2015.05.025
- Delorme, A., & Makeig, S. (2004). EEGLAB: An open source toolbox for analysis of single-trial EEG dynamics including independent component analysis. Journal of Neuroscience Methods, 134(1), 9–21. https://doi.org/10.1016/j.jneumeth.2003.10.009
- De Vos, M., Gandras, K., & Debener, S. (2014). Towards a truly mobile auditory brain-computer interface: Exploring the P300 to take away. International Journal of Psychophysiology, 91(1), 46–53. https://doi.org/10.1016/j.ijpsycho.2013.08.010
- Dijkstra, K., Farquhar, J., & Desain, P. (2019). Occurrence of the potent mutagens 2- nitrobenzanthrone and 3-nitrobenzanthrone in fine airborne particles. Scientific Reports, 9(1), Article 1. https://doi.org/10.1038/s41598-018-37186-2
- Dijkstra, K. V., Farquhar, J. D. R., & Desain, P. W. M. (2020). The N400 for brain computer interfacing: Complexities and opportunities. Journal of Neural Engineering, 17(2), 022001. https://doi.org/10.1088/1741-2552/ab702e
- Dunn, L. M., & Dunn, D. M. (2007). Peabody picture vocabulary Test—Fourth Edition. APA PsychNet. https://psycnet.apa.org/doiLanding?doi=10.1037%2Ft15144-000.
- Duvinage, M., Castermans, T., Petieau, M., Hoellinger, T., Cheron, G., & Dutoit, T. (2013). Performance of the Emotiv Epoc headset for P300-based applications. BioMedical Engineering OnLine, 12(1), 56. https://doi.org/10.1186/1475-925X-12-56
- Fischer-Baum, S., Dickson, D. S., & Federmeier, K. D. (2014). Frequency and regularity effects in Reading are task dependent: Evidence from ERPs. Language, Cognition and Neuroscience, 29(10), 1342–1355. https://doi.org/10.1080/23273798.2014.927067
- Ganis, G., Kutas, M., & Sereno, M. I. (1996). The search for “common sense”: An electrophysiological study of the comprehension of words and pictures in reading. Journal of Cognitive Neuroscience, 8(2), 89–106. https://doi.org/10.1162/jocn.1996.8.2.89
- Geuze, J., van Gerven, M. A. J., Farquhar, J., & Desain, P. (2013). Detecting semantic priming at the single-trial level. PLoS One, 8(4), e60377. https://doi.org/10.1371/journal.pone.0060377
- Goddard, E., Carlson, T. A., & Woolgar, A. (2022). Spatial and feature-selective attention have distinct, interacting effects on population-level tuning. Journal of Cognitive Neuroscience, 34(2), 290–312. https://doi.org/10.1162/jocn_a_01796
- Grootswagers, T., Wardle, S. G., & Carlson, T. A. (2017). Decoding dynamic brain patterns from evoked responses: A tutorial on multivariate pattern analysis applied to time series neuroimaging data. Journal of Cognitive Neuroscience, 29(4), 677–697. https://doi.org/10.1162/jocn_a_01068
- Guthrie, D., & Buchwald, J. S. (1991). Significance testing of difference potentials. Psychophysiology, 28(2), 240–244. https://doi.org/10.1111/j.1469-8986.1991.tb00417.x
- Hamilton, A., Plunkett, K., & Schafer, G. (2000). Infant vocabulary development assessed with a British communicative development inventory. Journal of Child Language, 27(3), 689–705. https://doi.org/10.1017/S0305000900004414
- Hamm, J. P., Johnson, B. W., & Kirk, I. J. (2002). Comparison of the N300 and N400 ERPs to picture stimuli in congruent and incongruent contexts. Clinical Neurophysiology, 113(8), 1339–1350. https://doi.org/10.1016/S1388-2457(02)00161-X
- Hubbard, R. J., & Federmeier, K. D. (2021). Dividing attention influences contextual facilitation and revision during language comprehension. Brain Research, 1764, 147466. https://doi.org/10.1016/j.brainres.2021.147466
- Kallionpää, R. E., Pesonen, H., Scheinin, A., Sandman, N., Laitio, R., Scheinin, H., Revonsuo, A., & Valli, K. (2019). Single-subject analysis of N400 event-related potential component with five different methods. International Journal of Psychophysiology, 144, 14–24. https://doi.org/10.1016/j.ijpsycho.2019.06.012
- Kutas, M., & Federmeier, K. D. (2011). Thirty years and counting: Finding meaning in the N400 component of the event-related brain potential (ERP). Annual Review of Psychology, 62(1), 621–647. https://doi.org/10.1146/annurev.psych.093008.131123
- Mostert, P., Albers, A. M., Brinkman, L., Todorova, L., Kok, P., & de Lange, F. P. (2018). Eye movement-related confounds in neural decoding of visual working memory representations. ENeuro, 5(4), ENEURO.0401–17.2018. https://doi.org/10.1523/ENEURO.0401-17.2018
- Nigam, A., Hoffman, J. E., & Simons, R. F. (1992). N400 to semantically anomalous pictures and words. Journal of Cognitive Neuroscience, 4(1), 15–22. https://doi.org/10.1162/jocn.1992.4.1.15
- Okita, T., & Jibu, T. (1998). Selective attention and N400 attenuation with spoken word repetition. Psychophysiology, 35(3), 260–271. https://doi.org/10.1017/S0048577298961042
- Oosterhof, N. N., Connolly, A. C., & Haxby, J. V. (2016). CoSMoMVPA: Multi-modal multivariate pattern analysis of neuroimaging data in Matlab/GNU Octave. Frontiers in Neuroinformatics, 10. https://www.frontiersin.org/articles/10.3389fninf.2016.00027
- Petit, S., Badcock, N. A., Grootswagers, T., Rich, A. N., Brock, J., Nickels, L., Moerel, D., Dermody, N., Yau, S., Schmidt, E., & Woolgar, A. (2020a). Toward an individualized neural assessment of receptive language in children. Journal of Speech, Language, and Hearing Research, 63(7), 2361–2385. https://doi.org/10.1044/2020_JSLHR-19-00313
- Petit, S., Badcock, N. A., Grootswagers, T., & Woolgar, A. (2020b). Unconstrained multivariate EEG decoding can help detect lexical-semantic processing in individual children. Scientific Reports, 10(1), 10849. https://doi.org/10.1038/s41598-020-67407-6
- Quax, S. C., Dijkstra, N., van Staveren, M. J., Bosch, S. E., & van Gerven, M. A. J. (2019). Eye movements explain decodability during perception and cued attention in MEG. NeuroImage, 195, 444–453. https://doi.org/10.1016/j.neuroimage.2019.03.069
- Smith, S. M., & Nichols, T. E. (2009). Threshold-free cluster enhancement: Addressing problems of smoothing, threshold dependence and localisation in cluster inference. NeuroImage, 44(1), 83–98. https://doi.org/10.1016/j.neuroimage.2008.03.061
- Tanaka, H., Watanabe, H., Maki, H., Sakriani, S., & Nakamura, S. (2019). Electroencephalogram-Based single-trial detection of language expectation violations in listening to speech. Frontiers in Computational Neuroscience, 13), https://doi.org/10.3389/fncom.2019.00015
- Thie, J. (2013). A wireless marker system to enable evoked potential recordings using a wireless EEG system (EPOC) and a portable computer. PeerJ Inc, https://doi.org/10.7287/peerj.preprints.32v1
- Van Petten, C., Coulson, S., Rubin, S., Plante, E., & Parks, M. (1999). Time course of word identification and semantic integration in spoken language. Journal of Experimental Psychology: Learning, Memory, and Cognition, 25(2), 394–417. https://doi.org/10.1037/0278-7393.25.2.394
- van Vliet, M., Chumerin, N., De Deyne, S., Wiersema, J. R., Fias, W., Storms, G., & Van Hulle, M. M. (2016). Single-Trial ERP component analysis using a spatiotemporal LCMV beamformer. IEEE Transactions on Biomedical Engineering, 63(1), 55–66. https://doi.org/10.1109/TBME.2015.2468588
- van Vliet, M., & Salmelin, R. (2020). Post-hoc modification of linear models: Combining machine learning with domain information to make solid inferences from noisy data. NeuroImage, 204, 116221. https://doi.org/10.1016/j.neuroimage.2019.116221
- van Vliet, M., Van Hulle, M. M., & Salmelin, R. (2018). Exploring the organization of semantic memory through unsupervised analysis of event-related potentials. Journal of Cognitive Neuroscience, 30(3), 381–392. https://doi.org/10.1162/jocn_a_01211
- Wagemans, J., Feldman, J., Gepshtein, S., Kimchi, R., Pomerantz, J. R., van der Helm, P. A., & van Leeuwen, C. (2012). A century of Gestalt psychology in visual perception: II. Conceptual and theoretical foundations. Psychological Bulletin, 138(6), 1218–1252. https://doi.org/10.1037/a0029334
- Wenzel, M. A., Bogojeski, M., & Blankertz, B. (2017). Real-time inference of word relevance from electroencephalogram and eye gaze. Journal of Neural Engineering, 14(5), 056007. https://doi.org/10.1088/1741-2552/aa7590
- Williams, N. S., McArthur, G. M., de Wit, B., Ibrahim, G., & Badcock, N. A. (2020). A validation of Emotiv EPOC Flex saline for EEG and ERP research. PeerJ, 8, e9713. https://doi.org/10.7717/peerj.9713
- Zhang, M., & Zhang, Y. (2007). Semantic processing is affected in inhibition of return: Evidence from an event-related potentials study. NeuroReport, 18(3), 267–271. https://doi.org/10.1097/WNR.0b013e32801231a9