
ABSTRACT
Speech is an extensively overlearned oromotor behaviour that becomes more automatised over the years due to the storage of their motor routines. To determine when this storage occurs in development, the EEG/ERP spatiotemporal dynamics underlying speech-motor planning were investigated in three groups: children, adolescents and adults. The production of speech was contrasted to sounded non-speech gestures that use the same effectors as speech but are not as frequently trained. Non-speech motor codes are assumed to be individually planned on the go, instead of being stored as motor routines. Neural results revealed a gradual differentiation between speech and non-speech motor planning with age: while ERPs did not differ in children, adolescents and adults showed gradually increasing differences in amplitudes and in topographies between speech and non-speech. This suggest that the speech motor code storage is not completely established yet in 7–9-year-old children but later during development, in early adolescence.
1. Introduction
Speech is an extensively trained oromotor behaviour in humans whose acquisition starts early in life. Its learning extends from childhood to adolescence, period during which the control over speech articulators continues to gradually increase and the production variability consequently decreases. Current models of speech motor control suggest that speech motor training occurring in childhood leads to high-order motor representations of vocal tract motor plans, necessary to produce frequently executed utterances (e.g. Guenther, Citation2016; Kröger et al., Citation2009; Parrell et al., Citation2019). Those stored motor speech routines can be accessed as single motor plans (motor targets stored in the Sound Speech Map according to the DIVA model, Guenther, Citation2016), warranting a reduced computational load while speaking, as well as a more automated speech motor control. Given that storing compiled motor representations is possible only after the repeated execution of their motor patterns, it is reasonable to argue that the process of storing motor plans might be finalised rather late in childhood. However, this is only a hypothesis that needs to be tested in order to establish when during development highly executed speech motor patterns get stored as speech motor routines.
The question of the age at which frequently executed speech motor plans are holistically represented in the brain has received little attention in the literature. Models of speech motor control have specified the speech acquisition phases in infancy in terms of articulatory control and acoustic description and the ages at which those stages occur (see McLeod & Crowe, Citation2018; Namasivayam et al., Citation2020) but information on the moment when motor speech patterns become stored routines is either scarce or imprecise. For instance, the prominent model of speech motor control, the Directions Into Velocities of Articulators – DIVA – model, vaguely affirms that motor speech routines (or feedforward motor commands for speech) allowing high-frequency syllables to have a stored motor program must be tuned during infancy and childhood (Guenther, Citation2016). The task-dependent model proposed by Ziegler (Citation2003), claiming for a specialised neural architecture for speech as compared to other oromotor behaviours, posits that the neural architectures for speech, emerging from its extensive rehearsal, “must develop during babbling and early speech” (Ziegler, Citation2003, p. 102). However, it is unclear whether this refers to the process of storing motor speech representations. In fact, motor circuits specialised for articulation are suggested to arise during early ages but this does not necessarily mean that motor speech representations are stored motor routines available from such an early age, especially considering that speech motor learning requires extensive training.
The assumption of overexecuted speech sequences shaping a specific neural circuitry in the developing brain has brought a relevant debate in the literature, with some authors agreeing on the emergence of a specialised neural architecture for speech (i.e. Ziegler, Citation2003), compared to other oromotor tasks involving the same musculature, while other scholars have propose a shared motor control system between speech and other oromotor behaviours (i.e. Ballard et al., Citation2003). Investigating whether specialised brain networks underly the production of speech is thus necessary to nourish the discussion with empirical evidence. Additionally, if speech and other oromotor activities do activate distinct neural circuits, it is crucial to determine if this is already the case in children, and, if not, when in development this bifurcation occurs is needed. Such investigations are only possible with neuroimaging approaches. However, to the best of our knowledge, neuroimaging studies on motor speech planning and motor speech learning processes have only included adults (Chang et al., Citation2009; Moser et al., Citation2009; Segawa et al., Citation2015). Kinematic studies on speech motor control, contrarily, have tested the mechanisms underlying speech motor control across different age groups, including children. Relevant to the issue of the development of motor speech routines, for instance, Smith and Goffman (Citation1998) investigated the patterning and stability of speech movements in 4-year-old children, 7-year-old children and young adults during a sentence production task. More specifically, participants’ lower lips and jaw movements were recorded with the aim of determining the extent to which the repeated performance of the sentence production task produced movement trajectories that converged on a single pattern. This measure, called the spatiotemporal index (STI), somehow reflects the accuracy of the generalised motor programs (GMPs) proposed in the schema theory of motor control by Schmidt (Citation1975, Citation1976). The GMPs correspond to speech motor programs stored as a single unit that could be retrieved from memory. Smith and Goffman (Citation1998) reported higher movement variability in children as compared to adults, in agreement with Schmidt’s proposal of a greater articulatory inconsistency during initial phases of development. According to the theory, GMPs are in fact executed more accurately and more consistently as schemas become more refined over the years, reducing gradually speech variability. Additionally, authors found qualitatively different movement patterns in children as compared to adults, which was interpreted as a reflection of different control strategies across groups: children might rely to a greater extent on feedback to guide movements while adults might depend on open-loop control systems (or feedforward).
Smith and Zelaznik (Citation2004) also reported trial-to-trial consistency of articulatory production in children, young adolescents, and adults during a sentence production task. Four-year-old children were found to display diverse combinations of upper lip, lower lip and jaw motion during the repetitive production of sentences, showing more variability in coupling lip-jaw articulators on repeated trials. As expected, adults showed highly regular patterns of coupling of the lip and jaw articulators each time the sentence was produced, while 12-year-olds exhibited an intermediate pattern between children and the adult group. Similarly, Green et al. (Citation2000) studied lip and jaw coordination in different age groups: 1-year-olds, 2-year-olds, 6-year-olds and young adults. Spatiotemporal coordination of both orofacial structures during the production of smaller units (e.g. bilabial syllables) was found to progressively increase between ages 2 and 6. However, no significant differences in articulatory synchronisation were found between 6-years-olds and young adults, despite a visually decreased spatiotemporal coupling for the former group. These last results contradict those of Smith and Zelaznik (Citation2004) and of Smith and Goffman (Citation1998), probably due to the size of the studied units (e.g. sentences versus isolated syllables), which might be treated differently by children (Smith, Citation2006).
Overall, these kinematic studies point to higher variability and less coordinated movements in children’s production up to the age of twelve, compatible with the hypothesis suggesting that speech production relies on stored motor speech routines only in late childhood or early adolescence. However, as stressed above, there are no insights from neuroimaging studies so far on this issue, also because of methodological constraints. It is indeed not straightforward to infer – on the basis of brain activation – if speech production relies on stored routines. Previous neuroimaging studies have associated stored routines (motor targets stored on the Speech Sound Map in the DIVA model) to the left ventral premotor cortex (Guenther, Citation2016), while speech production of sequences that cannot be routinised in adults (new speech sequences) activated the right pre-sensorimotor area and the basal ganglia (Segawa et al., Citation2015).
As mentioned above, one way of testing speech routinisation is by comparing its production to that of non-speech, whose motor codes are presumably not stored as single units given their infrequent execution. Assuming that only speech-motor codes are thus stored, the neural contrast between the two might indicate whether motor codes of speech and non-speech are differently planned. Previous studies on the neural basis of speech versus non-speech oromotor control have reported neural differences. For instance, Bonilha et al. (Citation2006) and Horwitz et al. (Citation2003) found different lateralisation and different cortical activation underlying the production of speech and non-speech tasks through functional magnetic resonance imaging (fMRI) and Positron emission tomography (PET), respectively. More specifically, both studies reported consistent bilateral cortical activation when participants produced non-speech stimuli, whereas activation for speech tasks was found to be left-lateralised. Concerning the cortical activation, an involvement of left inferior frontal cortex (Brodmann area – BA – 45) was observed only for speech stimuli in both studies, while non-speech gestures activated other areas such as BA 4, 6 (Bonilha et al., Citation2006) and 44 (Horwitz et al., Citation2003). Other authors also reported fine-grained differences at the neural level with structural and functional MRI (e.g. Basilakos et al., Citation2017; Chang et al., Citation2009) despite finding macroscopic neural overlap between speech and non-speech. This suggests that despite the engagement of the same regions during speech and non-speech production, those regions were differently involved for each oromotor task.
Recently, Lancheros et al. (Citation2020) specifically targeted the spatiotemporal dynamics of motor planning of speech and non-speech gestures in a group of young adults. Using electroencephalography (EEG) and event-related potentials (ERP) it was found that planning the motor codes of the two oromotor behaviours recruited the same neural circuitry but their activation dynamic differed in time between speech and non-speech around 300 ms before the vocal onset. Those results suggest that overlapping neural circuits are specifically organised for each oromotor behaviour at the level of motor planning. Given that the processes involved in motor planning include, at least for speech items, either retrieving from memory stored motor plans or planning individual motor goals online (Levelt, Citation1993), fine-grained divergences at the neural level found in adults are interpreted as different motor planning processes for speech and non-speech sequences. More specifically, one could assume that while retrieving motor plans from memory might underly the production of speech, online assembling of motor plans might be involved in producing non-speech gestures. The comparison of the production of speech and non-speech sequences may therefore be a good way to investigate the routinisation of speech in childhood and adolescence.
In order to investigate when in development speech motor plans are stored and thus retrieved as a single coordinated unit, differing from the production of non-speech gestures, three different age groups were included here: 7-to-9-year-old children, 14-to-16-year-old adolescents and young adults, from 19 to 30 years old. Children from 7 to 9 years old were selected since around that age children’s phonetic inventory is generally mastered (Sanders, Citation1972). Those ages seem to be rather crucial for exploring the development of speech motor planning since variability of intra-gestural coupling reported in kinematic studies have been shown to decrease from the age of 7 (Namasivayam et al., Citation2020). 14-to-16-year-old adolescents were also included here since intra-gestural synergies are shown to reach adult-like patterns at about 14 years (Namasivayam et al., Citation2020; Smith & Zelaznik, Citation2004; Walsh & Smith, Citation2002).
Different ERP correlates for speech and non-speech in a time-window preceding the vocal onset are expected in adults (Lancheros et al., Citation2020) since a subset of participants (n = 14) was the same as in our previous study. As for adolescents, considering that articulatory synergies at the kinematic level reach an adult-like pattern from the age of 14 (Namasivayam et al., Citation2020), we similarly expect to find differences in the temporal dynamics during the motor planning of speech and non-speech gestures. Regarding 7-to-9-year-old children, hypotheses are less clear-cut. Although variability of intra-gestural synergies is suggested to plateau between 7 and 12 years, some studies have still reported greater variability for 7-year-olds as compared to adults (e.g. Smith & Zelaznik, Citation2004). If speech motor plans are stored in 7-to-9-year-olds, the neural networks underlying the motor planning of speech and non-speech gestures should show differences in terms of their temporal distribution, similarly to the other groups. Conversely, if speech motor plans are not yet stored but are instead assembled online, brain circuits recruited during the motor planning of speech and non-speech gestures should display similar patterns of activation. Given that ERPs are bound to differ between children and adults, at least in amplitudes, due to different scalp thickness (Chauveau et al., Citation2004; Picton & Taylor, Citation2007), direct between age groups comparisons would not be informative; only within group comparisons of the speech and non-speech conditions will be run in three separate experiments, one per age-group.
2. Experiment 1: 7-to-9-year-old children
2.1. Method
2.1.1. Participants
Twenty-five children aged 7–9 were recruited for this experiment. All children were French native speakers, either mono or bilingual, with no reported hearing, language, speech, neurologic or psychiatric disorders. They were all right handed on the Edinburgh Handedness Scale (Oldfield, Citation1971). Children’s legal representatives gave their informed consent to participate in the study, approved by the local ethics committee, and were rewarded for their participation. Twenty-three participants, out of the twenty-five, completed the task with an accuracy >60%; however, four of them were removed because of many contaminated epochs in the ERP data. Additionally, another participant was excluded due to problems during the EEG recording. The 18 remaining participants (8 males, mean age: 8.1 years, range: 7–9 years) were included in the analysis.
2.1.2. Materials
The included stimuli were taken from our previous study, in which non-speech gestures were closely matched with monosyllabic French words and with pseudoword syllables (Lancheros et al., Citation2020). Non-speech gestures corresponded to sounded orofacial movements that lacked of linguistic content but were easily-reproduced from video recordings. Although it is often supposed that non-speech stimuli do not carry meaning (Kent, Citation2015), the non-speech stimuli included here can be associated with meaningful representations. French words had a mean lexical frequency of 57.8 per million words and a mean syllabic frequency of 32 per million syllables and were of different syllabic structures, including CCV, CCVC, CVC, CVCC and CYV. Pseudowords were meaningless but existing French syllables (mean syllabic frequency of 11.9 per million syllables). Similar to the French words, they also had different syllabic structures such as CCV, CCVC, CVC, CVCC and CYV. Pseudowords composed of low frequency syllables were added as an intermediate category between words and non-speech gestures. Given their rare production, their motor plans are expected to be encoded differently from highly practiced syllables, but they might differ from non-speech gestures since they involve the production of speech (phonetic) targets.
The three types of stimuli were paired on the type and mode of articulation of the gesture onset (i.e. the non-speech stimulus corresponding to the kiss-gesture – also called “bisou”-, was matched with the monosyllabic French word “point” (/pw∼E/) and with the pseudoword /pwo/, based on a plosive and bilabial onset). See for some other examples and the complete list of triplets in Appendix A. A detailed description of the movements and of the acoustic output expected from each non-speech item can be found in Appendix A from Lancheros et al. (Citation2020).
Table 1. Examples of matched triplets of non-speech, words and pseudowords.
One of the triplets from the original material by Lancheros et al. (Citation2020) was excluded from the children’s material given the difficulty they had reproducing them during a pilot study with three participants (the triplet was constituted by the word “bise”, the pseudoword “boze” and the non-speech gesture “dentist”). Thus, the material was composed of 19 matched triplets of non-speech gestures, monosyllabic words and pseudowords. In addition to the 57 target stimuli, 22 fillers were included (see Section 2.3). Each of the stimulus was audio-video recorded, using the same female actor/speaker. They were centred and cut off around the mouth, with highlighted lips, in order to show to participants how to reproduce each of the speech and non-speech targets both auditorily and visually. The videos always started with the presentation of the mouth in a neutral position during 300 ms, before producing the target stimulus; once the articulation was finished, the mouth came back to a neutral position and remained 300 ms on the screen. Mean duration (ms) of the videos was similar across stimulus types (conditions hereafter): non-speech = 1269 (SD = 186); words = 1244 (SD = 212); pseudowords = 1256 (SD = 195), with no statistical difference between them (p > 0.05).
2.1.3. Procedure
A delayed production task combined with an articulatory suppression task was proposed to children. The combination of those experimental tasks allows us not only to separate motor from pre-motor (linguistic) encoding but it also specifically permits to target motor planning processes (Laganaro & Alario, Citation2006). Previous studies have used the standard delayed production task (e.g. Chang et al., Citation2009; Kawamoto et al., Citation2008; Mock et al., Citation2011; Tilsen et al., Citation2016) to target motor processes; however, in a standard delayed production task without articulatory suppression participants might prepare their response up to the motor plans during the unfilled delay, not allowing us to completely look at the encoding process of interest. For this reason, the inclusion of an articulatory suppression task was necessary in order to target motor planning processes (see full rationale in Laganaro & Alario, Citation2006). Additionally, the combination of a delayed production task with an articulatory suppression task has previously been used in the comparison of the production of speech and non-speech stimuli (Lancheros et al., Citation2020).
Thus, children underwent a delayed production task combined with an articulatory suppression task in a dimly lit, sound-proof room. Stimuli were presented on a 17-inch screen (refreshment rate: 50 Hz) at a viewing distance of 70 cm approximately. The task sequence was controlled by a PC running the E-Prime software (version 2.0; Schneider et al., Citation2002). Before performing the experimental phase, participants were first familiarised with all the stimuli by randomly presenting them on the screen in a sequential manner. The familiarisation phase was then followed by a training phase containing the explanation of the task, the presentation of some examples and five warm-up trials. Those last ones were repeated if necessary.
Each experimental trial (see ) started with a fixation cross presented in the middle of the screen for 500 ms, followed by the appearance of a video with the target stimulus (mean duration = 1256 ms). After the video presentation, “bla bla” appeared on the screen for a random time of either 1200, 1400 or 1600 ms. Children were asked to produce the syllable “bla” repetitively, at a rhythm of approximately 2 “bla” per second, until an exclamation mark indicating to stop their production appeared. Then a blank of 200 msFootnote1 was presented so that participants had enough time to actually stop the articulatory suppression task. Either a yellow question mark or three yellow periods appeared next on the screen for either 2000 or 500 ms, respectively. In the cases where the response cue (e.g. the yellow question mark) was presented, children were asked to overtly produce the target stimulus as fast and accurately as possible. Otherwise they were asked to remain silent until the next trial, starting after 500 ms. This last no-response condition, represented by the three yellow periods, was associated only to filler items, which corresponded to the shortest and longest delays (1000 and 1800, respectively) and were not analysed. The subsequent trials were manually launched by the experimenter, who stayed in the sound-proof room with the children.
Figure 1. Experimental procedure of the delayed production task filled with an articulatory suppression task. Participants were asked to respond when the cue “?” appeared on the screen. Reaction times were calculated from the presentation of the “?” to the response onset.
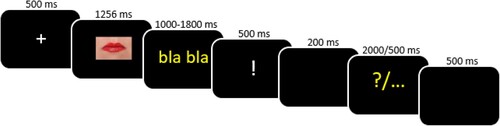
Each stimulus was presented twice throughout the task, in two intermediate delays (either 1200, 1400 or 1600 ms), and each filler item was presented only once. Items were pseudo-randomised in a way that the same stimulus was not presented consecutively and the same delay was not presented in more than three consecutive trials. The task was divided into two blocks, containing 64 stimuli each (57 stimuli + 7 fillers), allowing one break in between. Since the experimenter remained inside the cabin with the participants, more breaks could be proposed in case of tiredness. After having completed the two mandatory blocks, participants were given the option to perform a third block in order to include more trials. The third block could be stopped at children’s convenience, without having to complete it. Three lists of 193 stimuli (57 items × 3 delays and 22 fillers), with a different control order, were then created and randomly assigned to participants.
2.2. Behavioural analyses
Overt productions were recorded by a dynamic microphone, digitally amplified, and the signal was redirected to a computer. Response correctness and production latencies (RT in milliseconds, i.e. from the appearance of the question mark to the onset of the acoustic wave) were systematically checked with a speech analysis software (CheckVocal 2.2.6; Protopapas, Citation2007). No-responses and incorrect productions were considered as errors. For speech stimuli, any clearly perceived phonemic deviation from the target syllable was considered as an incorrect response. Regarding non-speech items, only clear and salient deviations from the target stimuli were scored as errors. Items for which hesitations, auto-corrections and/or articulatory movements were produced prior the target stimulus, were excluded from the RT analysis; contrarily, they were included in the analysis of accuracy if participants correctly produced the item afterwards. In a similar vein, recordings that included the production of the syllable “bla” (i.e. when the articulatory suppression was not stopped on time), but that contained the correct response after the repetition of the mentioned syllable, were coded as correct but were excluded from the RT analysis. Accuracy was coded by two independent judges (including the first author). From a random subset of 285 items, the inter-rater agreement between judges was substantial (89%, κ = 0.6, Kappa statistics, Landis & Koch, Citation1977).
For data cleaning purposes, RT shorter than 200 ms were excluded from the analysis as well as latencies exceeding 2 standard deviations from each of the children’s mean. Accuracy data were fitted with a generalised linear mixed-effects model for binomially distributed outcomes (Jaeger, Citation2008) with the glmer function (lme4 package, Qu et al., Citation1996) in the R-software (R-project, R Development Core Team, Citation2013). Condition (i.e. words, pseudowords and non-speech – intercept) was set as a fixed variable while participants and triplets were included as random effects only for intercepts. The functions “anova” and “summary” were used to obtain the analysis of variance table and the generalised linear mixed model fit by maximum likelihood (Laplace Approximation), respectively. Concerning RT, data were fitted with a linear regression mixed model (Baayen et al., Citation2008) with the lmer function, from the same lme4 package and from the lmerTest package (Kuznetsova et al., Citation2017) in the R-software. Those packages provide p-values in type I, II or III anova and summary tables for linear mixed models (lmer model) via Satterthwaite’s degrees of freedom method. Here, condition was similarly set as a fixed variable and participants and triplets were included as random effects only for intercepts.
2.3. EEG acquisition and pre-processing
The EEG was continuously recorded using the Active-Two Biosemi EEG system (Biosemi V.O.F. Amsterdam, Netherlands) with a 64-electrode cap. ERPs were high and low-pass filtered (0.2–30 Hz), notch-filtered (50 Hz) and averaged for each participant. Epochs of 350 ms with correct responses and valid RT were time-locked to the onset of the vocal response (i.e. response-locked) and were extracted backwards (i.e. covering the 350 ms preceding the vocal onset). Epochs contaminated by eye blinking, eye-movements, movements or other noise artefact were excluded from averaging after visual inspection. The number of epochs per participant was set to equal across conditions (mean epochs per participant: 28, minimum of epochs per participant: 19) by randomly excluding trials within each of the conditions. Additionally, whenever possible, the epochs of matched triplets were included. Epoch extraction and averaging was computed for each participant using the Cartool software (Brunet et al., Citation2011). Response-locked ERPs were averaged separately per participant and per condition. Electrodes with signal artefacts were interpolated using 3-D splines interpolation (Perrin et al., Citation1987). The average of electrodes interpolated by participants was 26% (max = 31%; or up to 20 of the 64 electrodes). After interpolation, all accepted epochs were recalculated against the average reference.
2.4. EEG data analyses
ERP data of included participants were initially subjected to an outlier detection step using the RAGU software (Koenig et al., Citation2011), in which ERPs showing substantial disparity from the mean of all the examined individual ERPs are detected. To do so, the ERP data of each subject participant (i.e. all channels and all time points of the three conditions) is arranged in a one-dimensional vector, yielding one vector per subject. A matrix of correlations is then computed for all those vectors. The Multi-Dimensional Scaling (MDS) algorithm, which downscales high-dimensional spaces into lower dimensional ones, computes next a set of coordinates for each subject. These coordinates are chosen so that the Euclidean distances between all pairs of coordinates optimally represent the correlation among the ERP data of the corresponding subjects, with higher correlations resulting in smaller distances. Thus, from the MDS output of the correlation matrix, data of particular subjects that did not resemble the mean of the data from the other subjects were shown. In order to select specific participants that needed to be excluded, we relied on the auto-select outlier option proposed by RAGU, which identifies cases that are unlikely to be part of the normal distribution by calculating the Mahalanobis distance (Wilks, Citation1963). p-threshold for excluding outliers was set at 0.05.
Then, in order to establish differences in ERP mean amplitudes, the main effect and the decomposition of the effect of condition were performed by using the Threshold Free Cluster Enhancement (TFCE, Smith & Nichols, Citation2009) statistic implemented within the Permuco4brain R package by Frossard and Renaud (Citation2021; Citation2022 – https://github.com/jaromilfrossard/permuco4brain) with 5000 permutations.
Topographic consistency tests (TCT, Koenig & Melie-García, Citation2010) were next run on the averaged ERP data to verify whether a given scalp field was consistently activated by the event of interest in the time window of analysis. The TCT compares, time-point by time-point, the global field power (GFP) of the averaged ERPs to the empirical distribution of the GFP obtained after the random shuffle of the data across electrodes. Response-locked ERPs were subjected to the TCT (L2 normalisation, 5000 runs and alpha of 0.05) using the Ragu software (Koenig et al., Citation2011).
Afterwards, we performed a topographic analysis of variance (TANOVA) in order to determine differences in topographies across conditions. The procedure, implemented in the Ragu software (Wirth et al., Citation2008), uses randomisation statistics to ascertain whether observed topographic differences are likely to occur due to chance. Here, 5000 iterations were run and the alpha set to 0.05. Additionally, only topographic differences lasting more than 20 ms were considered. TANOVA was based on the same pre-processed and averaged data as the standard ERPs.
A topographic analysis (spatiotemporal segmentation) was subsequently performed to explore whether differences in global dissimilarity obtained in the TANOVA were due to different stable topographic patterns per se or to different time course of the same stable topographic patterns across conditions. The method described by Koenig et al. (Citation2014) and implemented in the Ragu software was used to determine the stable electrophysiological patterns (or topographic maps) that best explain the data at each time frame. Topographic maps reflect a particular spatial configuration of the global electric field generated by neural sources in response to a specific stimulus. These maps remain consistent for tens of milliseconds before quickly transitioning to a new arrangement, indicating changes in the overall network activity. Topographic maps were statistically tested by comparing each template map with the moment-by-moment scalp topography of each individual ERP. This procedure, called “back-fitting”, informs about how much a topographic map observed in a given condition in the grand averaged ERP actually explains each participant’s ERP data. Fitting was similarly performed with the RAGU software (Koenig et al., Citation2014), from which information on the presence and on the duration of each stable topographic configuration time point per time point was considered for statistical analyses.
Statistical analyses were performed using the mixed model lmer and glmer functions, from the mentioned lmerTest and Lme4 packages, in the R software. From the values of presence, the analysis of variance table and the generalised linear mixed model fit by maximum likelihood (Laplace Approximation) was obtained. As for maps duration, the p-values in type I, II or III anova and summary tables for linear mixed models via Satterthwaite’s degrees of freedom method was calculated. The models on presence and duration included condition as a fixed effect and participant as random intercept.
2.5. Results
2.5.1. Behavioural results
The triplet “point/pwo/kiss” was a posteriori excluded from the analysis given participants’ low accuracy rate on the pseudoword (i.e. /pwo/). On the 18 remaining triplets, children’s production accuracy was of 90% (SD = 6%) for words, of 78% (SD = 7%) for pseudowords and of 89% (SD = 6%) for non-speech. Results of the generalised mixed model for binomial distribution revealed no significant difference between accuracy for words and non-speech (z = 0.79 p = 0.43, β = 0.13, SE = 0.16) but accuracy for pseudowords was significantly lower relative to non-speech (z = −6.55 p < 0.001, β = −0.91, SE = 0.14). Mean response latencies (RTs in ms) were 601 (SD = 191) for words, 614 (SD = 190) for pseudowords and 632 (SD = 207) for non-speech. The linear mixed model showed a main effect of condition (F(2, 2073,8) = 6.30; p = 0.002), suggesting that the time required to reproduce the presented items was different across conditions. Contrasts revealed that RTs were significantly longer for non-speech gestures relative to both words (t(2070.3) = −3.51; p < 0.001, β = −30.99, SE = 8.84) and pseudowords (t(2075.5) = −2.21; p = 0.003, β = −20.32, SE = 9.21).
2.5.2. ERPs results
Outlier detection. From the MDS output of the correlation matrix no extreme outliers seemed present and the auto-select option did not eliminate any individual ERP.
Waveform analysis. The statistical analyses performed on the waveforms yielded no significant main effect of condition, suggesting no differences in ERPs’ amplitudes across the three different types of stimuli (see (a)).
Figure 2. (a) Results from the comparison on the mean amplitudes between speech and non-speech stimuli revealed no significant differences on any of the time points/electrodes. (b) Examples of waveforms for each condition at three (Fpz, Cz, Oz) locked to the vocal response. (c) Results of the TANOVA analysis showing no topographic differences across conditions. (d) Temporal distribution of the topographic maps revealed by the spatiotemporal segmentation analysis; each colour under the GFP represents the time covered by the corresponding map in the grand-averages from each condition. (e) Map templates corresponding to each topographic map, with positive values in red and negative values in blue.
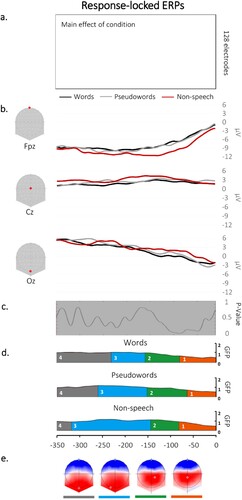
TCT. The TCT revealed consistency in the signal over the whole analysed time window (e.g. from the vocal onset to −350 ms) across conditions (see Appendix B).
TANOVA. The TANOVA analysis revealed no significant differences in topographies across conditions.
Microstate analysis. The microstate segmentation revealed 4 different electrophysiological template maps on the response-locked data (see (c)), accounting for 95.77% of the variance. On the grand averages, the third and fourth topographic maps appeared to be differently distributed between non-speech and words and, to a lesser extent, between non-speech and pseudowords.
Fitting on individual ERPs. The fitting procedure was performed with the aim of exploring differences in the temporal distribution of the 4 stable topographical patterns identified in the spatiotemporal segmentation. The presence of each topographic map in each individual ERP and duration per condition is shown in .
Table 2. Presence (%) and mean duration (ms) of each topographic map resulting from the back-fitting of the microstate segmentation to the individual participants’ ERP data in children.
Consistent with the results from the TANOVA, the back-fitting procedure revealed that the four topographic maps were equally present across conditions (map 1: χ2 = 0.95; p = 0.62; map 2: χ2 = 1.07; p = 0.59; map 3: χ2 = 0.25; p = 0.88; map 4: χ2 = 3.80; p = 0.15). Additionally, all the maps were similarly distributed across conditions (map 1: F(2,36) = 1.55; p = 0.22; map 2: F(2,36) = 0.56; p = 0.57; map 3: F(2,36) = 1.38; p = 0.26), except the map 4 (F(2,36) = 3.71; p = 0.03), which had significantly longer duration for words as compared to non-speech gestures (t = 2.72, p < 0.01).
2.6. Discussion
Behavioural results showed similar production accuracy between non-speech items and closely matched words; however, pseudowords were produced with lower accuracy relative to non-speech gestures. This result may be explained by a specific difficulty in processing pseudowords in 7–9 y.o, children given their infrequent encounter. Non-speech gestures, on the contrary, might be more familiar to children of that age, explaining the reported higher precision. Regarding production latencies, non-speech gestures were initiated slower as compared to both words and pseudowords, which suggests that planning the motor codes of sounded orofacial movements is more costly than planning speech sequences.
Behavioural differences between speech and non-speech stimuli, however, were not mirrored at the neural level since differences across conditions (i.e. words, pseudowords and non-speech) were neither yielded in terms of ERPs’ amplitudes (waveform analysis) nor in terms of ERP’s topographies (TANOVA and microstate analysis). Thus, despite longer production latencies for non-speech sequences (but better accuracy relative to pseudowords), ERPs do not differ on amplitudes and the same neural circuitry seems to be recruited during speech and non-speech motor planning with a similar spatiotemporal pattern. A unique isolated difference was observed on the duration of map 4 between words and non-speech, but those counterintuitive results (as it lasts longer for the fastest condition) are hard to interpret since map 4 is a truncated map appearing at the border of the analysed time-window.
Since motor plans of non-speech gestures are highly implausible to be stored in memory given their infrequent production, at first sight, the similarity of results across conditions might suggest that 7-to-9-year-old children encode all types of stimuli in the same way, i.e. they do not rely yet on stored speech motor plans. However, this interpretation is based on the absence of results and, before any further conclusion, it is necessary to assess if the same procedure and stimuli do not lead to null results in adolescents and adults.
3. Experiment 2: 14-to-16-year-old adolescents
3.1. Method
3.1.1. Participants
Twenty-three adolescents were recruited for this experiment. They were all right-handed and French native speakers, either mono or bilingual, with no reported language impairment or neurological disease. Similar to children, adolescents’ legal representatives as well as themselves gave their informed consent to participate in the study and were paid for their participation. All participants (n = 23) completed the task with an accuracy >60%; however, five of them were removed for different reasons: technical problems with the EEG recording, low quality EEG signal and/or many contaminated epochs in the ERP data. The eighteen remaining participants (8 men, mean age: 14.9 years, range: 14–16 years) were included in the analysis.
3.1.2. Materials
The materials were the same as those described in Experiment 1, including the 20 triplets of matched words, pseudowords and non-speech sequences.
3.1.3. Procedure
Participants underwent the same familiarisation and training phases as children in Experiment 1. The experiment’s procedure for adolescents was similar to the one detailed in , except that after the presentation of the exclamation mark indicating to stop the repetition of the syllable “bla”, a shorter blank of 100 ms (instead of 200 ms) was presented. Also, trials did not need to be manually launched by the experimenter, who did not stay next to the participant. Finally, all participants underwent the three blocks (e.g. with all the 202 stimuli, including 60 items x 3 delays and 22 fillers).
3.2. Behavioural analyses
The behavioural analyses and the criteria for coding the vocal responses were the same as those described in Experiment 1. Accuracy was similarly coded by the first author and by a second independent judge on a random subset of 325 items. Inter-rater agreement between judges was again high (93%, κ = 0.5).
3.3. EEG acquisition, pre-analysis and analysis
Acquisition and pre-analysis of the EEG data were the same as in Experiment 1, except that a 128-channel cap was used. Correct and valid epochs of 300 ms were time-locked to the onset of the vocal response (covering the 300 ms preceding the vocal onset) and were extracted for each participant. The mean number of epochs per participant was 32, with a minimum of 18. The average of electrodes interpolated were 19% (max = 25%; or up to 32 of the 128 electrodes).
The same EEG analyses as in Experiment 1 were computed.Footnote2
3.4. Results
3.4.1. Behavioural results
The triplet “point/pwo/kiss” was a posteriori excluded from the analysis due to the low accuracy rate on the pseudoword (i.e. /pwo/). From the 19 remaining triplets, adolescents’ production accuracy was of 96% (SD = 3%) for words, of 87% (SD = 5%) for pseudowords and of 90% (SD = 6%) for non-speech. The generalised mixed model for binomial distribution showed a significant difference between words and non-speech stimuli (z = 5.47 p < 0.001, β = 1.09, SE = 0.20), with the former set of items being more precise. No difference in accuracy was found between pseudowords and non-speech (z = −1.65 p = 0.09, β = −0.24, SE = 0.14). As for RT, mean latencies were 550 ms (SD = 152 ms) for words, 548 ms (SD = 155 ms) for pseudowords and 566 (SD = 153) for non-speech. The linear mixed model revealed a main effect of condition (F(2, 2446,6) = 5.44; p = 0.004). Contrasts showed that initiating the production of non-speech gestures was significantly longer as compared to both words (t(2446.3) = −2.85; p < 0.004, β = −15.74, SE = 5.53) and pseudowords(t(2447.5) = −2.90; p = 0.004, β = −16.38, SE = 5.66).
3.4.2. ERPs results
Outlier detection. One extreme outlier was identified from the MDS output of the correlation matrix. The auto-select option in RAGU indicated that the concerned participant was effectively an outlier. The participant was excluded and all the following ERP analysis were then performed on the 17 remaining participants.
Waveform analysis. The statistical analyses on ERP amplitudes across conditions yielded significant differences on clusters of left central electrodes as well as on posterior electrodes in a late time-window preceding the vocal onset (from the vocal onset to −70, see (a)). Although ERP amplitudes from non-speech gestures seem to be the ones differing from words and from pseudowords (see (c)), the decomposition of the main effect of condition revealed no differences in amplitudes either between words and non-speech or between pseudowords and non-speech (see (b)).
Figure 3. Results of the waveform analysis displayed on each electrode and each time point showing differences in amplitudes across conditions in left central and posterior electrodes preceding the vocal onset. (b) Absence of differences in mean amplitudes between words and non-speech and between pseudowords and non-speech stimuli on all time points/ electrodes. (c) Exemplars of averaged ERP waveforms (Fpz, Cz and Oz) for each condition, plotted in microvolts in function of time. (d) Periods of significant differences in topographies across conditions according to the TANOVA (in light yellow). (e) Temporal distribution of the topographic maps revealed by the spatiotemporal segmentation analysis are displayed in different colours under the GFP. (f) Map templates corresponding to each topographic map, with positive values in red and negative values in blue.
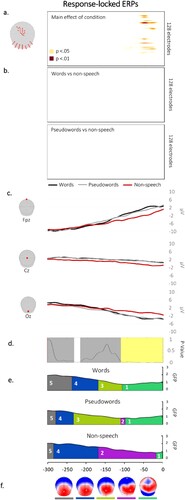
TCT. The TCT revealed consistency in the signal across conditions over the analysed time window (i.e. from 0 to −300 ms). See Appendix C.
TANOVA. A significant time-window of difference in the TANOVA was disclosed from the vocal onset to −116 ms (see (c), yellow time-window). Differences in topographies were also found earlier, from −217 to −233, however this time-window did not meet the established temporal criterion of lasting longer than 20 ms (see (c), white time-window).
Microstate analysis. The microstate segmentation revealed 5 different electrophysiological template maps (see (d)) accounting for 95.62% of the variance. On the grand averages, map 2 appeared to be mainly represented in non-speech stimuli while map 3 appeared to be exclusively present for speech stimuli (i.e. words and pseudowords). The remaining topographic maps, although visually present across conditions, seemed to be differently distributed for words, pseudowords and non-speech items.
Fitting on individual ERPs. In order to establish to what extent the topographic maps obtained from the microstate analysis explain individual participants’ ERP data, the back-fitting procedure was applied. The presence of each topographic map in each individual ERP and duration per condition is shown in .
Table 3. Presence (%) and mean duration (ms) of each topographic map resulting from the back-fitting of the microstate segmentation to the individual participants’ ERP data in adolescents.
Consistent with the results from the TANOVA, the back-fitting procedure revealed significant differences of presence across conditions for map 1 (χ2 = 14.47; p < 0.001), being less present for non-speech stimuli relative to words (z = 3.18; p < 0.002) and to pseudowords (z = 3.21; p < 0.002). No differences of duration were found for map 1 when present across conditions (F(2,34) = 1.70; p = 0.20). Map 2, although it seemed to be more represented in non-speech from the grand averages, was similarly present (χ2 = 0.22; p = 0.90) as well as similarly distributed (F(2,34) = 1.19; p = 0.32) between speech and non-speech items. On the contrary, map 3 differed between non-speech and pseudowords and, to a lesser extent, between non-speech and words. More specifically, despite the variable of presence not reaching the threshold of significance (χ2 = 5.02; p = 0.08), relevant contrasts (i.e. non-speech versus words and non-speech versus pseudowords) showed that map 3 was less present for non-speech as compared to pseudowords (z = 2.20; p = 0.03). As for the duration of map 3, a main effect of condition was found (F(2,34) = 4.70; p = 0.02). Contrasts indicated a reduced duration for non-speech relative to both pseudowords (t = 2.81, p < 0.01) and words (t = 2.47, p = 0.02). Maps 4 and 5 did not differ across conditions either in terms of presence (map 4: χ2 = 0.31; p = 0.85; map 5: χ2 = 2.04; p = 0.36) or duration (map 4: F(2,34) = 1.60; p = 0.22; map 5: F(2,34) = 0.66; p = 0.52).
3.5. Discussion
Behavioural findings from 14-to-16-year-old adolescents revealed higher precision in the production of words as compared to that of non-speech gestures; however, no difference in accuracy was found between pseudowords and non-speech gestures. Initiation latencies, on the contrary, were longer for non-speech relative to both words and pseudowords. Results at the neural level also yielded differences across types of stimuli, both on amplitudes and on ERPs topographies. In all analyses non-speech differed from speech in a late time-window preceding articulation. In addition, the microstate analysis indicated that an earlier map in the time-window −130 to −220 also differed between non-speech and pseudowords and, to a lesser extent, between non-speech and words. While map 1 likely corresponds to articulatory movements preceding the vocal onset because of its timing (Halle et al., Citation1957) and because of its topography (see Jouen et al., Citation2021), map 3 differing between speech and non-speech in an earlier time-window likely represents motor encoding processes. Thus, ERP differences reported in this group indicate neural differences between speech and non-speech motor planning in 14-to-16-year-old adolescents, with converging results across analyses in particular in the time-window close to articulation. Before any further discussion, and in order to validate the children’s and adolescents’ results using the same procedure, we turn to the group of adults, for which previous studies have already highlighted different encoding for speech and non-speech sequences.
4. Experiment 3: young adults
4.1. Method
4.1.1. Participants
Twenty-four right-handed adult French native speakers, either mono or bilingual, were recruited. No neurologic, psychiatric or language impairments were reported. They gave their informed consent to participate in the study and were paid for their participation. One participant was excluded for low accuracy (<60%) and five were removed because of many contaminated epochs in the ERP data. The eighteen remaining participants (8 men, mean age: 23.4 years, range: 19–30 years) were included in the analysis. Out of the eighteen participants included here, fourteen of them had participated in our previous study (Lancheros et al., Citation2020), in which the brain correlates underlying speech and non-speech motor planning were similarly investigated.
4.1.2. Materials
The materials were the same as those described in the previous experiments.
4.1.3. Procedure
Participants underwent the same familiarisation and training phases described in Experiment 2.
4.2. Behavioural analyses
The behavioural analyses and the criteria for coding the vocal responses were the same as those described in the previous experiments. Similarly, accuracy was coded by the first author and a random subset of 360 items was coded independently by the second author. Inter-rater agreement was again high (94%, κ = 0.6).
4.3. EEG acquisition, pre-analysis and analysis
Acquisition and pre-analysis of the EEG data were the same as in Experiment 2 with adolescents. The mean number of epochs per participant was 35, with a minimum of 20. The average of electrodes interpolated for adults was 13% (max = 20%; or up to 25 of the 128 electrodes).
The same EEG analyses as in previous groups were computed.Footnote3
4.4. Results
4.4.1. Behavioural results
Similar to the children’s and adolescents’ dataset, the triplet “point/pwo/kiss” was excluded given the participants’ low accuracy rate on the pseudoword (i.e. /pwo/). From the 19 remaining triplets, adults’ production accuracy was of 91% (SD = 9%) for words, of 85% (SD = 9%) for pseudowords and of 88% (SD = 9%) for non-speech. Results of the generalised mixed model for binomial distribution revealed no significant difference between words and non-speech (z = 1.87 p = 0.06, β = 0.27, SE = 0.15) although the precision of pseudowords significantly different from that of non-speech gestures (z = −2.49 p = 0.01, β = −0.33, SE = 0.13), with higher accuracy for the latter stimuli. Mean response latencies (in ms), were of 584 (SD = 179) for words, of 586 (SD = 175) for pseudowords and of 586 (SD = 180) for non-speech. The linear mixed model showed no main effect of condition (F(2, 2522.3) = 1.16; p = 0.31), suggesting that the time required to reproduce the speech and non-speech items was similar.
4.4.2. ERPs results
Waveform analysis. The statistical analyses performed on the waveforms yielded a significant main effect of condition in two time-windows: from about −50 ms to −130 ms before the vocal onset across the majority of electrodes (except for right anterior and central channels) and, in a lesser extent, from about −150 ms to −250 ms in frontal and left posterior channels (see (a)). The decomposition of the effect of condition revealed that the main differences in amplitudes in the later time-window were between words and non-speech and between pseudowords and non-speech in the earlier time-window (see (b)).
Figure 4. (a) Results of the waveform analysis displayed on each electrode and each time point, showing differences in amplitudes across conditions. (b) Results from the decomposition of the main effect of condition with contrasts between words and non-speech and between pseudowords and non-speech. (c) Exemplars of averaged ERP waveforms (Fpz, Cz and Oz) for each condition, plotted in microvolts in function of time. (d) Periods of significant differences in topographies across conditions according to the TANOVA (in light yellow). (e) Temporal distribution of the topographic maps revealed by the spatiotemporal segmentation analysis, plotted in colour under the GFP. (f) Map templates corresponding to each topographic map, with positive values in red and negative values in blue.
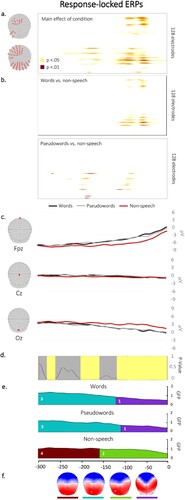
TCT. The TCT revealed consistency on the signal over the whole analysed time window for the three conditions (see Appendix D).
TANOVA. The TANOVA analysis showed significant differences in topographies across conditions in three time-windows: from the vocal onset to −125 ms and, from −160 to −205 ms and from −260 to −280 ms (see (d)).
Microstate analysis. The microstate segmentation revealed 4 different electrophysiological template maps on the response-locked data (see (e)) accounting for 97.55% of the variance. Different periods of topographic stability appeared for non-speech gestures during the analysed time-window.
Fitting on individual ERPs. To confirm differences in global electrophysiological patterns, the topographic map templates were fitted in the individual ERPs. Presence and duration of each topographic map per condition is show in .
Table 4. Presence (%) and mean duration (ms) of each topographic map resulting from the back-fitting of the microstate segmentation to the individual participants’ ERP data in adults.
Map 1, which seemed exclusively representative of non-speech stimuli on the grand-averaged ERPs, was similarly present across conditions in the individual ERPs (χ2 = 0.27; p = 0.87). However, its duration was found to differ between speech and non-speech items (F(2, 36) = 4.93; p = 0.01). More specifically, map 1 was significantly shorter for non-speech gestures as compared to words (t = 2.93; p < 0.01) and to pseudowords (t = 2.46; p < 0.03). Results from map 2 did not reveal differences in presence across conditions (χ2 = 2.52; p = 0.28) but its distribution was different (F(2, 36) = 1.92; p = 0.03), with non-speech being significantly longer relative to words (t = −2.70; p = 0.01). The difference in the map’s duration between non-speech and pseudowords was marginal (t = −1.98; p = 0.05). Maps 3 and 4 did not differ across conditions either in terms of presence (map 3: χ2 = 0.74; p = 0.69; map 4: χ2 = 1.04; p = 0.59) or duration (map 3: F(2,36) = 1.23; p = 0.30; map 4: F(2,36) = 2.10; p = 0.14).
4.5. Discussion
Behavioural results in adults revealed that pseudowords were produced with lower precision as compared to non-speech gestures, while there was no difference of accuracy between the production of orofacial movements and words. Regarding RTs, no differences were found across conditions. ERPs results yielded neural differences during the preparation of speech and non-speech motor codes. More precisely, amplitudes differed across an important number of electrodes, mainly in a time-window starting at about −130 to −50 ms from the actual vocal onset. Topographies similarly differed across conditions, according to the TANOVA and to the microstate analysis, specially before initiating the execution of speech and non-speech gestures. Those results indicate that the dynamics of the neural networks underlying the motor planning of speech and non-speech gestures differ in adults, as it has been previously reported (Lancheros et al., Citation2020).
5. General discussion
In the present study, we aimed at determining when in development motor plans of speech sequences are stored as a single unit that could be retrieved as such. In order to test the storage and retrieval of speech motor routines, speech stimuli were contrasted to non-speech gestures, whose motor plans are assumed not to be stored given their infrequent production and therefore have to be prepared on the flow each time they are produced. If planning the motor codes of speech sequences implied a different mechanism than planning non-speech motor targets (i.e. retrieval versus assembly, respectively), we expected to find quantitative and/or qualitative differences at the neural level, as previously shown in adults (Lancheros et al., Citation2020). We tested this hypothesis in three different age groups: 7-to-9-year-old children, 14-to-16-year-old adolescents and young adults.
Behavioural results yielded higher accuracy for the production of non-speech gestures as compared to that of pseudowords in children and adults, whereas non-speech items were produced less correctly relative to words in adolescents. Pseudowords being produced with lower accuracy might be due to the fact that non-existing speech items are often misperceived and are therefore incorrectly produced. Additionally, the criteria for detecting errors in the speech sequences, either words and pseudowords, was stricter than that of non-speech gestures, which might equally explain why the latter achieved higher accuracy in children and adults. Reaction times were significantly longer for non-speech gestures in comparison to both speech items (i.e. words and pseudowords) in children and adolescents, while the initiation of words, pseudowords and non-speech did not differ in adults. This divergent reaction time pattern across age groups suggests that planning the motor codes of sounded orofacial movements was more costly than planning speech sequences for children and adolescents. Contrarily, no difference in the planning cost between speech and non-speech items was evident in adults.
Results at the behavioural level, although informative, were nevertheless not necessarily reflected at the neurophysiological level. In fact, differences in the ERP amplitudes were found in adolescents and in adults but not in children. Specifically, the waveform analysis on the adolescents’ data revealed differences in ERP amplitudes across conditions in a late time-window preceding articulation, although the contrasts between non-speech and words and between non-speech and pseudowords did not yield significant results. As for the adult group, differences in amplitudes across conditions were found in two different time-windows: the first one preceding the vocal onset and mainly driven by the comparison between non-speech and words and, the second one, from −150 to −250 ms, primarily resulting from the contrast between non-speech and pseudowords. Those results clearly show a divergent neural pattern across groups, with the largest differences in ERP amplitudes between speech and non-speech in adulthood.
Similarly, periods of stable topographic patterns did not differ in children – except for a border map at the end of the backward analysed window –, whereas adolescents’ and adults’ topographies showed different distribution patterns across conditions in a time-window that likely represents motor encoding processes. More specifically, in adolescents, the spatiotemporal segmentation showed differences in topographies across conditions in two different time-windows: from the vocal onset to about −100 ms and from about −100 to −230 ms (map 1 and 3, respectively, in (e)). While the microstate identified in the former time-window likely represents the extent at which preparatory movements are initiated before the actual vocal output (Jouen et al., Citation2021), the latter time-window likely corresponds to motor processes occurring prior to the articulatory execution. The back-fitting in this early time-window indicated topographic differences mainly occurring between non-speech and pseudowords and, to a lesser extent between non-speech and words. Thus, the neural network represented by map 3 was activated in 13 out of 17 participants during the production of pseudowords, which was more than for the production of non-speech gestures. In the latter condition, map 3 was only activated in 7 participants. However, this effect was marginal when talking into account the three conditions. Importantly, differences in map 3 were mainly found in terms of duration, with the underlying neural circuit being recruited longer for pseudowords compared with non-speech gestures (i.e. 45 ms longer for the former condition). The duration of map 3 was also longer for words as compared to non-speech (i.e. 40 ms longer). In summary, those findings indicate that the neural circuit represented in map 3 was not restricted to a specific type of stimuli since the main effect of condition did not reach levels of significance. Instead, the results suggest that the brain circuit represented in map 3, differed in terms of its temporal distribution particularly between pseudowords and non-speech, but also between words and non-speech.
Concerning the adult group, differences in topographies across conditions on the TANOVA and on the spatiotemporal segmentation were shown in an extended time-window from the vocal onset to about −160 ms. The back-fitting revealed that the two maps comprised in this time interval (map 1 and 2 in (e)) were differently distributed between non-speech and words and, less strongly between non-speech and pseudowords. This suggests that pseudowords seem to be somehow intermediate between words and non-speech stimuli in the adult group. The findings in adults appear to contrast with those of adolescents in two aspects. Firstly, the topographic differences across conditions were found in a later time-window in adults compared to the 14-to-16-year-old group. However, these results likely reflect variations in motor encoding processes instead of representing preparatory orofacial movements preceding the vocal onset, given the underlying topography. This, in turn, indicates that the topography associated to the initiation of the preparatory movements that precede the vocal onset is only present in adolescents, suggesting that 14-to-16-year-olds anticipated the presentation of the response cue while children and adults might have waited until the question mark “?” appearing on the screen to launch the execution. Secondly, the differences in the temporal distribution of the topographies were primarily observed between words and non-speech stimuli in adults, whereas adolescents predominantly exhibited differences between pseudowords and non-speech stimuli. Indeed, although the differences in duration of map 3 in adolescents were larger between pseudowords and non-speech, the duration of map 3 during the production of words was quite close to that of pseudowords (i.e. 68 and 73.5, respectively). Importantly, the duration of the mentioned map for the two speech conditions were significantly different from that of non-speech gestures. This, however, needs to be further explored in future studies.
Summing up, despite the behavioural differences found between speech and non-speech in children, those findings were not mirrored at the neural level either in terms of ERP amplitudes or topographies. The absence of ERP differences between speech and non-speech in this population suggests no differences in the motor planning of these two oromotor behaviours. Oppositely, adolescents’ and adults’ brain networks did show different distribution patterns between speech and non-speech with the same material and procedure. Importantly, although children’s brain activity was recorded with 64 electrodes while a 128-electrode cap was used for adolescents and adults, when the data of the two later groups were down-sampled to 64 electrodes, even larger differences in terms of ERP amplitudes and topographies were obtained. Those neural divergences in the two older groups were found in a time-window that likely represents motor encoding processes, suggesting in general that the production of speech in 14-to-16-year-olds and in young adults is controlled by specialised neural networks. More importantly for the aim of this paper, our results also suggest different motor processes underlying the planning of speech and non-speech motor codes in adolescents and adults. This will be further discussed in the following sections.
5.1 Specialisation of speech (as compared to non-speech)
The task dependent model proposed by Ziegler (Citation2003) suggests that the extensive motor learning of speech to which we are subjected from a very early age has a direct impact at the neural level. In fact, according to this model, the repeated experience of speaking from early years is reflected in the emergence of a specialised neural architecture for speech. Non-speech gestures, contrarily, are claimed not to rely on such a specific neural representation since they are rarely rehearsed oromotor activities (Ziegler, Citation2003). The present study indirectly tested this assumption by comparing the neural activation of the motor processes underlying the production of speech and non-speech gestures. The ERPs results in adolescents and young adults are in line with the general claim of the task-dependent model of specialised brain circuits for speech given the fine-grained differences in the activation patterns found in the neural networks recruited for speech and non-speech; they are also in line with different activation patterns reported in the study summarised in the Introduction (Basilakos et al., Citation2017; Bonilha et al., Citation2006; Chang et al., Citation2009; Horwitz et al., Citation2003; Lancheros et al., Citation2020). However, the same was not true for the 7-to-9-year-old children, whose neural activation did not differ between speech and non-speech. Finding the same recruited brain networks for speech and non-speech with a similar pattern of activation in children suggests that the proposed specialised neural architecture for speech has not completely emerged between the ages of 7 and 9. Our results indeed suggest that the accomplishment of this speech specialisation might occur later in life, probably before the age of 14. In the next section, we will discuss what the neural results reported in the three age groups reveal in terms of the targeted motor planning processes.
5.2 Speech motor planning from childhood to adulthood
The storage of speech motor routines is assumed in most motor speech encoding models (see Introduction): it implies that whenever the speech targets stored as motor routines are about to be executed, they might be directly retrieved from memory in order to speed up the production. On the contrary, motor plans of rarely practiced sequences are proposed to be individually planed online, as it might be the case for non-speech gestures. The contrast between the production of speech and non-speech items was thus relevant here in order to determine in which age group(s) motor planning differed at the neural level between oromotor behaviours.
According to the neural results of the present study, only adolescents and adults showed different motor planning processes for the production of speech and non-speech sequences whereas no difference between the two oromotor behaviours was found in children. This suggests that different motor encoding processes are engaged during the planning of speech and non-speech in the two older groups (i.e. retrieval versus online assemblage for speech and non-speech respectively). Oppositely, children might mostly, although probably not completely, rely on the same encoding process when planning the motor codes of speech and non-speech gestures. Such common process likely corresponds to the online preparation of motor plans since many of the speech and non-speech behaviours are plausibly not enough rehearsed by the ages of 7–9 to be stored as stable motor routines. Thus, it might be that the specific motor organisation for speech is underway in 7–9-year-olds but that is not completely achieved yet, explaining why the differences between speech and non-speech are not captured at the neural level in this population. The exact age at which the speech specialisation is completed cannot be determined in this study.
The neural circuits of speech being completely specialised in adolescence is in line with kinematic studies on the development of speech motor control that also indirectly points to the extent at which speech motor plans are retrieved from memory. As reviewed in the introduction, an important variability and diminished coordinated movements have been reported in children’s speech up to early adolescence (e.g. Cheng et al., Citation2007; Smith & Goffman, Citation1998; Smith & Zelaznik, Citation2004). The high variability and the lack of temporal coordination of speech gestures is compatible with the hypothesis that speech production does not completely rely on stored motor speech routines until late childhood or early adolescence.
6. Conclusion
In this study, the neural dynamics underlying speech motor planning were compared to the production of non-speech sequences in children, adolescents and young adults in order to determine when in development speech motor plans are stored and retrieved as motor routines. Results suggest that it is only in early adolescence that highly frequent speech sequences undergo different motor planning processes as compared to rarely executed oromotor sequences. Those differences in motor encoding processes very likely correspond to the retrieval of motor routines for speech versus the online encoding of motor codes for non-speech. Children from 7 to 9 years of age did not show neural differences during the motor encoding of speech and closely matched orofacial movements, suggesting that their speech might not yet rely on stored routines. These results are in line with kinematic studies showing that speech-motor control skills do not reach an adult-like pattern until around twelve-fourteen years of age. However, building and storing motor speech routines is very likely a progressive process, meaning that routines corresponding to the most trained/used speech sequences (e.g. those corresponding to very frequent and simple CV syllables) are possibly stored earlier in childhood. This issue needs to be investigated in future studies.
Supplemental Material
Download MS Word (221.8 KB)Acknowledgements
The authors gratefully acknowledge the speech and language therapy graduate students Henriette Avond et Sara Gianvitorio for their help during recruitment and experimental phases.
Disclosure statement
No potential conflict of interest was reported by the author(s).
Additional information
Funding
Notes
1 The blank was initially of 100 ms but, during the pilot study, it became evident that children did not easily stop their productions at the presentation of the exclamation mark. We decided then to extend the duration of the blank to 200 ms.
2 EEG analyses were computed on the 128 electrodes for more precision. However, adolescents’ data were also down-sampled to 64 electrodes to make it more comparable with the children data. The general results for both amplitudes and topographies were similar between 64 and 128 electrodes. In the subsequent sections, results on the 128 electrodes will be presented for adolescents.
3 Similar to the adolescents’ data, EEG analyses were computed both on 64 and on 128 electrodes, yielding similar results in terms of amplitudes and topographies. Results on the 128 electrodes will be presented in the following sections.
References
- Baayen, R. H., Davidson, D. J., & Bates, D. M. (2008). Mixed-effects modeling with crossed random effects for subjects and items. Journal of Memory and Language, 59(4), 390–412. https://doi.org/10.1016/j.jml.2007.12.005
- Ballard, K. J., Robin, D. A., & Folkins, J. W. (2003). An integrative model of speech motor control: A response to Ziegler. Aphasiology, 17(1), 37–48. https://doi.org/10.1080/729254889
- Basilakos, A., Smith, K. G., Fillmore, P., Fridriksson, J., & Fedorenko, E. (2017). Functional characterization of the human speech articulation network. Cerebral Cortex, 28(5), 1816–1830. https://doi.org/10.1093/cercor/bhx100
- Bonilha, L., Moser, D., Rorden, C., Baylis, G. C., & Fridriksson, J. (2006). Speech apraxia without oral apraxia: Can normal brain function explain the physiopathology? Neuroreport, 17(10), 1027–1031. https://doi.org/10.1097/01.wnr.0000223388.28834.50
- Brunet, D., Murray, M. M., & Michel, C. M. (2011). Spatiotemporal analysis of multichannel EEG: CARTOOL. Computational Intelligence and Neuroscience, 2011, 1. https://doi.org/10.1155/2011/813870
- Chang, S.-E., Kenney, M. K., Loucks, T. M., Poletto, C. J., & Ludlow, C. L. (2009). Common neural substrates support speech and non-speech vocal tract gestures. Neuroimage, 47(1), 314–325. https://doi.org/10.1016/j.neuroimage.2009.03.032
- Chauveau, N., Franceries, X., Doyon, B., Rigaud, B., Morucci, J. P., & Celsis, P. (2004). Effects of skull thickness, anisotropy, and inhomogeneity on forward EEG/ERP computations using a spherical three-dimensional resistor mesh model. Human Brain Mapping, 21(2), 86–97. https://doi.org/10.1002/hbm.10152
- Cheng, H. Y., Murdoch, B. E., & Goozée, J. V. (2007). Temporal features of articulation from childhood to adolescence: An electropalatographic investigation. Clinical Linguistics & Phonetics, 21(6), 481–499. https://doi.org/10.1080/02699200701325043
- Frossard, J., & Renaud, O. (2021). permuco4brain: Massively Univariate Tests on Several Signals in Space [R package version 0.2.0]. https://github.com/jaromilfrossard/permuco4brain
- Frossard, J., & Renaud, O. (2022). The cluster depth tests: Toward point-wise strong control of the family-wise error rate in massively univariate tests with application to M/EEG. Neuroimage, 247, 118824. https://doi.org/10.1016/j.neuroimage.2021.118824
- Green, J. R., Moore, C. A., Higashikawa, M., & Steeve, R. W. (2000). The physiologic development of speech motor control: Lip and jaw coordination. Journal of Speech, Language, and Hearing Research, 43(1), 239–255. https://doi.org/10.1044/jslhr.4301.239
- Guenther, F. H. (2016). Neural control of speech. Mit Press.
- Halle, M., Hughes, G. W., & Radley, J. P. (1957). Acoustic properties of stop consonants. The Journal of the Acoustical Society of America, 29(1), 107–116. https://doi.org/10.1121/1.1908634
- Horwitz, B., Amunts, K., Bhattacharyya, R., Patkin, D., Jeffries, K., Zilles, K., & Braun, A. R. (2003). Activation of Broca’s area during the production of spoken and signed language: A combined cytoarchitectonic mapping and PET analysis. Neuropsychologia, 41(14), 1868–1876. https://doi.org/10.1016/S0028-3932(03)00125-8
- Jaeger, T. F. (2008). Categorical data analysis: Away from ANOVAs (transformation or not) and towards logit mixed models. Journal of Memory and Language, 59(4), 434–446. https://doi.org/10.1016/j.jml.2007.11.007
- Jouen, A.-L., Lancheros, M., & Laganaro, M. (2021). Microstate ERP analyses to pinpoint the articulatory onset in speech production. Brain Topography, 34(1), 29–40. https://doi.org/10.1007/s10548-020-00803-3
- Kawamoto, A. H., Liu, Q., Mura, K., & Sanchez, A. (2008). Articulatory preparation in the delayed naming task. Journal of Memory and Language, 58(2), 347–365. https://doi.org/10.1016/j.jml.2007.06.002
- Kent, R. D. (2015). Nonspeech oral movements and oral motor disorders: A narrative review. American Journal of Speech-Language Pathology, 24(4), 763–789. https://doi.org/10.1044/2015_AJSLP-14-0179
- Koenig, T., Kottlow, M., Stein, M., & Melie-García, L. (2011). Ragu: A free tool for the analysis of EEG and MEG event-related scalp field data using global randomization statistics. Computational Intelligence and Neuroscience, 2011, 1. https://doi.org/10.1155/2011/938925
- Koenig, T., & Melie-García, L. (2010). A method to determine the presence of averaged event-related fields using randomization tests. Brain Topography, 23(3), 233–242. https://doi.org/10.1007/s10548-010-0142-1
- Koenig, T., Stein, M., Grieder, M., & Kottlow, M. (2014). A tutorial on data-driven methods for statistically assessing ERP topographies. Brain Topography, 27(1), 72–83. https://doi.org/10.1007/s10548-013-0310-1
- Kröger, B. J., Kannampuzha, J., & Neuschaefer-Rube, C. (2009). Towards a neurocomputational model of speech production and perception. Speech Communication, 51(9), 793–809. https://doi.org/10.1016/j.specom.2008.08.002
- Kuznetsova, A., Brockhoff, P. B., & Christensen, R. H. (2017). Lmertest package: Tests in linear mixed effects models. Journal of Statistical Software, 82(13), 1–26. https://doi.org/10.18637/jss.v082.i13
- Laganaro, M., & Alario, F.-X. (2006). On the locus of the syllable frequency effect in speech production. Journal of Memory and Language, 55(2), 178–196. https://doi.org/10.1016/j.jml.2006.05.001
- Lancheros, M., Jouen, A., & Laganaro, M. (2020). Neural dynamics of speech and non-speech motor planning. Brain and Language, 203, 104742. https://doi.org/10.1016/j.bandl.2020.104742
- Landis, J. R., & Koch, G. G. (1977). The measurement of observer agreement for categorical data. Biometrics, 159–174. https://doi.org/10.2307/2529310
- Levelt, W. J. (1993). Speaking: From intention to articulation (Vol. 1). MIT press.
- McLeod, S., & Crowe, K. (2018). Children's consonant acquisition in 27 languages: A cross-linguistic review. American Journal of Speech-Language Pathology, 27(4), 1546–1571. https://doi.org/10.1044/2018_AJSLP-17-0100
- Mock, J. R., Foundas, A. L., & Golob, E. J. (2011). Modulation of sensory and motor cortex activity during speech preparation. European Journal of Neuroscience, 33(5), 1001–1011. https://doi.org/10.1111/j.1460-9568.2010.07585.x
- Moser, D., Fridriksson, J., Bonilha, L., Healy, E. W., Baylis, G., Baker, J. M., & Rorden, C. (2009). Neural recruitment for the production of native and novel speech sounds. Neuroimage, 46(2), 549–557. https://doi.org/10.1016/j.neuroimage.2009.01.015
- Namasivayam, A. K., Coleman, D., O’Dwyer, A., & Van Lieshout, P. (2020). Speech sound disorders in children: An articulatory phonology perspective. Frontiers in Psychology, 10. https://doi.org/10.3389/fpsyg.2019.02998
- Oldfield, R. C. (1971). The assessment and analysis of handedness: The Edinburgh inventory. Neuropsychologia, 9(1), 97–113. https://doi.org/10.1016/0028-3932(71)90067-4
- Parrell, B., Ramanarayanan, V., Nagarajan, S., & Houde, J. (2019). The FACTS model of speech motor control: Fusing state estimation and task-based control. PLoS Computational Biology, 15(9), e1007321. https://doi.org/10.1371/journal.pcbi.1007321
- Perrin, F., Pernier, J., Bertnard, O., Giard, M., & Echallier, J. (1987). Mapping of scalp potentials by surface spline interpolation. Electroencephalography and Clinical Neurophysiology, 66(1), 75–81. https://doi.org/10.1016/0013-4694(87)90141-6
- Picton, T. W., & Taylor, M. J. (2007). Electrophysiological evaluation of human brain development. Developmental Neuropsychology, 31(3), 249–278. https://doi.org/10.1080/87565640701228732
- Protopapas, A. (2007). Check vocal: A program to facilitate checking the accuracy and response time of vocal responses from DMDX. Behavior Research Methods, 39(4), 859–862. https://doi.org/10.3758/BF03192979
- Qu, Y., Tan, M., & Kutner, M. H. (1996). Random effects models in latent class analysis for evaluating accuracy of diagnostic tests. Biometrics, 797–810. https://doi.org/10.2307/2533043
- R Development Core Team. (2013). R: A language and environment for statistical computing.
- Sanders, E. (1972). When are speech sounds learned. Journal of Speech and Hearing Disorders, 37(1), 55–63. In. https://doi.org/10.1044/jshd.3701.55
- Schmidt, R. A. (1975). A schema theory of discrete motor skill learning. Psychological Review, 82(4), 225. https://doi.org/10.1037/h0076770
- Schmidt, R. A. (1976). The schema as a solution to some persistent problems in motor learning theory. In R. A. Schmidt (Ed.), Motor control (pp. 41–65). Elsevier.
- Schneider, W., Eschman, A., & Zuccolotto, A. (2002). E-Prime: User's guide. Psychology Software Incorporated.
- Segawa, J. A., Tourville, J. A., Beal, D. S., & Guenther, F. H. (2015). The neural correlates of speech motor sequence learning. Journal of Cognitive Neuroscience, 27(4), 819–831. https://doi.org/10.1162/jocn_a_00737
- Smith, A. (2006). Speech motor development: Integrating muscles, movements, and linguistic units. Journal of Communication Disorders, 39(5), 331–349. https://doi.org/10.1016/j.jcomdis.2006.06.017
- Smith, A., & Goffman, L. (1998). Stability and patterning of speech movement sequences in children and adults. Journal of Speech, Language, and Hearing Research, 41(1), 18–30. https://doi.org/10.1044/jslhr.4101.18
- Smith, A., & Zelaznik, H. N. (2004). Development of functional synergies for speech motor coordination in childhood and adolescence. Developmental Psychobiology, 45(1), 22–33. https://doi.org/10.1002/dev.20009
- Smith, S. M., & Nichols, T. E. (2009). Threshold-free cluster enhancement: Addressing problems of smoothing, threshold dependence and localisation in cluster inference. Neuroimage, 44(1), 83–98. https://doi.org/10.1016/j.neuroimage.2008.03.061
- Tilsen, S., Spincemaille, P., Xu, B., Doerschuk, P., Luh, W.-M., Feldman, E., & Wang, Y. (2016). Anticipatory posturing of the vocal tract reveals dissociation of speech movement plans from linguistic units. PloS one, 11(1), e0146813. https://doi.org/10.1371/journal.pone.0146813
- Walsh, B., & Smith, A. (2002). Articulatory movements in adolescents.
- Wilks, S. S. (1963). Multivariate statistical outliers. Sankhyā: The Indian Journal of Statistics, Series A (1961-2002), 25(4), 407–426. http://www.jstor.org/stable/25049292
- Wirth, M., Horn, H., Koenig, T., Razafimandimby, A., Stein, M., Mueller, T., Federspiel, A., Meier, B., Dierks, T., & Strik, W. (2008). The early context effect reflects activity in the temporo-prefrontal semantic system: Evidence from electrical neuroimaging of abstract and concrete word reading. Neuroimage, 42(1), 423–436. https://doi.org/10.1016/j.neuroimage.2008.03.045
- Ziegler, W. (2003). To speak or not to speak: Distinctions between speech and nonspeech motor control. Aphasiology, 17(2), 99–105. https://doi.org/10.1080/729255218