
ABSTRACT
The cognitive neuroscience of language aims at revealing how linguistic information is represented and manipulated in the brain to enable communication and meaningful behaviour. An important aspect of the underlying brain processes is the integration and transformation of information across multiple brain systems. In order to understand these processes, a detailed characterisation of brain connectivity is key. For the most accurate characterisation of brain connectivity, connectivity methods should make use of the full multivariate and multidimensional information available from neuroimaging data. This should include a characterisation of transformations between patterns of activation across brain regions, and in particular their dependence on stimulus features, task and context. Methods for this type of analysis in event-related experimental designs have only recently begun to emerge. This paper describes these novel developments and their potential to transform the neuroscience of language, with a focus on fMRI and EEG/MEG research.
Introduction
The neuroscience of language investigates how linguistic information is stored and processed in the brain in order to allow effective communication through the comprehension and production of messages. An essential aspect of this endeavour is the transformation of different types of information between different representations, such as patterns of brain activation representing visual or spoken word forms into the meaning of words and sentences, or patterns of brain activity representing our current mental state into motor programmes for a verbal utterance or laughter. It is a common assumption that different aspects of language, such as orthographic, phonological, semantic, and articulatory information, are represented in distributed patterns of neuronal activity (Hebb et al., Citation1971; Hoffman et al., Citation2018; Mcclelland & Rumelhart, Citation1985; Rogers et al., Citation2004; Tomasello et al., Citation2018). When we use language, we perform transformations among multiple representations of this kind depending on the task and context. For example, when naming an object we transform visual into semantic information, then into phonological information and finally a motor programme that leads to the utterance of the object name. A wealth of research has revealed the brain regions that are involved in these processes (Binder & Desai, Citation2011; Friederici & Gierhan, Citation2013; Hagoort, Citation2013; Jackson, Citation2021; Poeppel, Citation2014; Price, Citation2012; Pulvermuller, Citation2013), but we are still far from a full understanding of how these regions interact with each other, and in particular how they transform information among different representations.
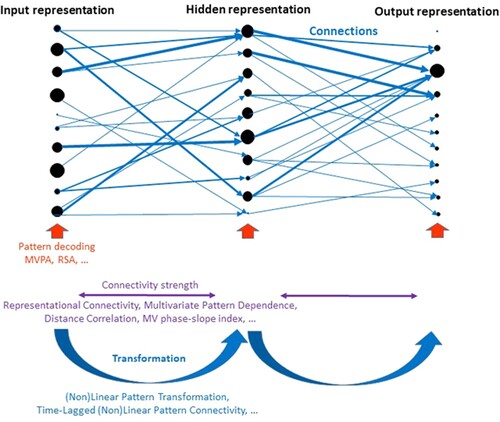
Recent research has begun to explicitly associate brain activity with layers of artificial neural networks in space (Khaligh-Razavi & Kriegeskorte, Citation2014) and time (Kietzmann, Spoerer, Sorensen, et al., Citation2019). A range of methods exists to characterise patterns of activation within these layers and compare them with patterns of real neural activation in different brain regions, e.g. using representational similarity analysis (Higgins et al., Citation2022; Karimi-Rouzbahani et al., Citation2022; Kriegeskorte, Citation2011; Naselaris et al., Citation2011). These methods can reveal whether similarity structures for patterns of activation between layers of neural networks and brain regions are similar, and therefore likely to represent similar types of information. For example, the similarity structure in visual brain areas at early latencies reflects low-level object features, which resembles the similarity structure among patterns in lower layers (i.e. close to the input) of a deep artificial neural network (Kietzmann, Spoerer, Sörensen, et al., Citation2019). In turn, higher layers of the network represent higher-level information about object categories, similar to more anterior temporal regions (e.g. inferior temporal cortex, ITC) in the brain at later latencies. However, this does not characterise the mapping between nodes in different layers of the network or voxels in different brain regions. It is still an open question whether these pattern transformations also show similarities between artificial neural network and real brain data (illustrated in ).
Figure 1. Illustration of the application of multivariate and multidimensional methods to characterise aspects of artificial or biological neural network architectures. The example network represents a simple feedforward network with an input layer, a hidden layer and an output layer. Each layer consists of 10 nodes (putatively corresponding to neurons or cell assemblies). The distribution of activation levels across all nodes within a layer (illustrated by the size of black circles) represents information at a particular stage of processing. The blue arrows illustrate connections between nodes of different layers, which transform activation patterns from one layer into another. In this example, it is assumed that a distributed input pattern is transformed into a sparse output pattern (e.g. a particular button press) via the hidden layer. Activation and connection strengths were chosen arbitrarily. The network is annotated at the bottom with different multivariate and multidimensional data analysis methods that characterise different aspects of the network. While methods to describe patterns within layers or regions as well as the strength of different types of connectivity have already been established, methods that characterise the transformations of patterns across layers or regions have only just begun to emerge (Basti et al., Citation2019; Basti et al., Citation2020; Rahimi, Jackson, Farahibozorg, & Hauk, 2022).
The investigation of brain connectivity is key in this endeavour. However, ‘brain connectivity’ is not a simple concept that can be captured in one number. A broad range of brain connectivity methods have been proposed, each describing a different type of relationship among the signals in different brain regions (Basti et al., Citation2020; Bastos & Schoffelen, Citation2015; Friston, Citation2011; Greenblatt et al., Citation2012; Seth et al., Citation2015; Valdes-Sosa et al., Citation2011). Until recently, most of these methods focused on univariate signals, i.e. brain activity within brain regions was pooled across voxels or vertices (commonly by averaging or principal component analysis). Thus, these methods are only sensitive to covariations of overall signal strength between regions. In order to characterise the transformations of brain representations across regions, we require connectivity methods that take the full multivariate information in each region into account.
A few methods been proposed for neuroimaging analysis that characterise relationships among patterns of activations across brain regions (Anzellotti & Coutanche, Citation2018; Basti et al., Citation2018; Basti et al., Citation2020; Geerligs & Henson, Citation2016). Nevertheless, while these methods can determine whether or not there is a certain relationship among those patterns, they typically do not describe the transformations of these patterns across regions in detail (illustrated in ). For example, is every voxel in region X connected to a specific voxel in region Y? Do multiple voxels from region X converge in one voxel in region Y, or vice versa? Only recently have methods become available that explicitly estimate the transformations between patterns of brain activity (Basti et al., Citation2018; Rahimi et al., Citation2022). Methods of this type have been referred to as ‘multi-dimensional connectivity’, i.e. taking into account multiple dimensions within regions, in order to distinguish them from ‘multi-variate connectivity’, which has usually been used to refer to methods that include more than two regions in the model (Basti et al., Citation2020; Rahimi, et al., Citation2022).
An analysis of pattern transformations is only informative if we can expect the mappings or projections between voxels of different regions to be structured in a meaningful way. Topographic maps are well established for sensory brain areas (e.g. Goldman-Rakic, Citation1988; Pantev et al., Citation1995; Penfield & Rassmussen, Citation1950; Sereno et al., Citation1994). With respect to connectivity, there is evidence that topological mappings between different regions exist for sensory brain systems, e.g. in visual cortex (Haak et al., Citation2018; Kaas, Citation1997). For neuroimaging researchers the crucial question is whether any relationships that exist among neurons at the microscopic level will be reflected systematically in our neuroimaging data at the macroscopic level. Studies using multivariate pattern analysis (MVPA) or representational similarity analysis (RSA) have shown that macroscopic patterns in individual ROIs carry valuable information about stimuli, tasks and brain states (Cichy et al., Citation2015; Kietzmann, Spoerer, Sörensen, et al., Citation2019; Kriegeskorte, Mur, and Bandettini, Citation2008; Stokes et al., Citation2015). Some authors have suggested that topographic maps and mappings also exist for higher-level cortical areas, e.g. in frontal and parietal regions (Hagler & Sereno, Citation2006; Ito et al., Citation2017; Jbabdi et al., Citation2013; O'Rawe & Leung, Citation2020; Silver & Kastner, Citation2009; Thivierge & Marcus, Citation2007). This has mostly been based on anatomical or resting-state connectivity. While this can provide an idea about possible or likely connection patterns, determining the actual connectivity for particular stimuli and tasks requires methods for event-related experimental designs, which have only recently become available (Basti et al., Citation2019; Basti et al., Citation2020; Rahimi, et al., Citation2022). Thus, little is known about transformations of distributed neural representations in the language domain.
In the following, we will first discuss how these methods could make an impact on the neuroscience of language. In order to further motivate this approach, we will then summarise previous research on topological relationships between brain regions for sensory and higher-level brain systems. Finally, we will briefly describe the methods that have been proposed to study pattern-to-pattern transformations in fMRI and EEG/MEG data.
Transforming the neuroscience of language
Topographic maps and mappings exist in various brain areas at different levels of the processing hierarchy. Some suggestions about their functional role beyond sensorimotor systems have already been made (Jbabdi et al., Citation2013; Thivierge & Marcus, Citation2007; Tinsley, Citation2009; Zajzon et al., Citation2019). How do these concepts relate to the neuroscience of language? How is the transformation of linguistic information between brain systems reflected in transformations of brain activity patterns across brain regions?
It is well-established that patterns of brain activity carry information about linguistic stimuli, e.g. about speech signals (Anumanchipalli et al., Citation2019; Blank et al., Citation2018; Kocagoncu et al., Citation2017), written words (Carota et al., Citation2017; Chan et al., Citation2011; Devereux et al., Citation2013; Gonzalez Andino et al., Citation2007), and object categories (Cichy et al., Citation2017; Clarke, Citation2020; Coutanche & Thompson-Schill, Citation2015; Kietzmann, Spoerer, Sorensen, et al., Citation2019; Kriegeskorte, Mur, Ruff, et al., Citation2008). The idea that conceptual information is represented in distributed patterns of brain activation is a core part of current neuroscientific approaches to language (Binder & Desai, Citation2011; Chen et al., Citation2017; Lambon Ralph et al., Citation2017; Martin, Citation2007; Pulvermuller, Citation2013). However, it is not yet known how these patterns are transformed across brain regions, and how these transformations are affected by stimulus category, task or context.
The concepts of topographical maps and mappings lend themselves to the analogy with channels of information flow in information processing systems. Information comes through different input channels, is distributed to the appropriate processing systems where information from different inputs is combined and abstracted depending on the task at hand, to finally result in signals to the appropriate output systems. An obvious problem with psycholinguistic information is that there is no obvious correspondence with the physical world and the sensorimotor periphery of our bodies, such as visual fields corresponding to areas on the retina, or somatotopic maps corresponding to different body parts. Information is abstracted away from its structure in sensory input areas already at very early stages of processing, such as letter and letter string processing (Vinckier et al., Citation2007). These abstract representations have to be processed in a highly flexible manner, depending on task demands and context, i.e. information from different brain systems has to be integrated. It is therefore unclear whether we will be able to find frequently occurring sub-structures of a larger network or of transformations within this network, so-called ‘motifs’ in graph theory, with a universal functional role (see and the next section for illustrations). In the following section, we will describe studies that have focussed on features of transformations that reflect intuitive connectivity patterns such as convergence, divergence and one-to-one mappings (Jbabdi et al., Citation2013; Thivierge & Marcus, Citation2007; Tinsley, Citation2009).
Here, we would also like to highlight a possible feature of transformation that is likely to be omnipresent and at the same time hard to analyse, i.e. many-to-many (M2M) mappings (every voxel can be connected to every other voxel). Distance in semantic space does not necessarily correspond to distance between neurons or neuron populations if the code is distributed. At the same time, even M2M mappings may still differ systematically depending on stimulus features or categories as well as on task and context. While these mappings may not be decomposable into a finite set of simple motifs, the above-mentioned concepts may still prove useful to characterise the sensitivity of M2M mappings to experimental manipulations. They may reflect a complex mixture of different connectivity patterns, but analysing some characteristics of this mixture may still inform us about the mechanisms of language processing. We will illustrate this here with two simplified examples.
The following examples were created with a focus on clarity, i.e. to illustrate the novel approach to connectivity analysis and its possible application to questions in the neuroscience of language. While they are inspired by current neuroscientific theories, we know that the reality is much more complex. Hopefully, our new methods will be enable us to disentangle some of these complexities in the future.
In we illustrate how pattern transformations could be applied to study the transformation of input word forms (e.g. speech and text) to semantic representations. We here do not commit to a particular model or brain areas, and make the simplified assumption that the word form will be transformed directly from peripheral brain areas into a semantic brain system, and will first reach a semantic core area which in turn has connections to distributed sensorimotor systems. In order to allow flexible information retrieval depending on context and task demands, the semantic system is linked to a distributed top-down system. Finally, the semantic system is linked to an output system, e.g. for a button press or speech act.
Figure 2. Possible pattern transformations involved in a simplified illustration of a word recognition task. The neural patterns associated with an input word form are transformed into a pattern in a multimodal semantic core area. We here assume the connectivity of the corresponding brain systems to be many-to-many. The pattern in the semantic core area is then transformed into a response (e.g. a button press if it refers to an animal). This likely involves convergent connectivity from a distributed semantic representation to a localised motor output. The semantic representation is affected by converging top-down signals from multiple brain systems reflecting task demands, context and mental state. The semantic representation also involves divergent connectivity to distributed sensorimotor areas. This connectivity is divergent to multiple modal brain areas (e.g. visual, auditory, motor cortices), but for each particular modality may be many-to-many. M2M: many-to-many; conv: convergent; div: divergent
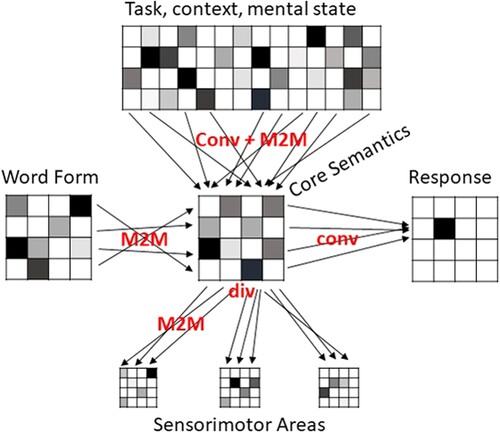
This illustration contains simplifications that will certainly have to be elaborated in the future. For example, we only included unidirectional feed-forward connections, while in reality interactions among brain systems including feedback connections is more likely. The terms ‘convergence’ and ‘divergence’ only make sense if a direction of information flow has been specified – a convergent flow in one direction is divergent in the other. For this reason, we simplified our toy example in order to provide a clear interpretation of the different pattern transformation.
We cannot expect a simple mapping between word forms (e.g. strings of letters or phonemes) and semantic representations in the semantic core area. Letters and phonemes in different positions are not indicative of the semantic category or identity of a particular stimulus. Word form and semantic representation are both distributed within their respective sub-systems. Thus, the pattern transformation between these two sub-systems will be M2M.
Furthermore, the same word can have multiple meanings depending on the context (MacGregor et al., Citation2020; Rodd, Citation2020; Rubinstein et al., Citation1970)}. The semantic information retrieved may also depend on the task demands (Chen et al., Citation2015; Clarke et al., Citation2011; Rahimi, et al., Citation2022; Rogers et al., Citation2005). Information about context and task demands is represented in brain systems distributed across multiple brain areas, likely to include the multiple demand system and inferior frontal brain areas (Binder & Desai, Citation2011; Hoffman et al., Citation2018; Jackson, Citation2021). Connections from this system may converge on the semantic representation system in order to enable the retrieval of context- and task-relevant information for an appropriate response. At the same time, because the systems are required to be flexible with respect to context and tasks, we cannot expect a simple connectivity pattern between individual regions. Thus, the transformation of patterns from the widely distributed top-down system to patterns in the semantic system will be generally convergent as well as M2M. Similarly, the connections from the semantic core system to multiple distributed sensorimotor areas will be divergent, while connections between the semantic core system and individual sensorimotor regions will be M2M. Finally, the selection of a response requires convergent connectivity of distributed patterns within the semantic system onto a particular response, e.g. a button press with a specific finger.
It is likely that pattern transformations can change over time, e.g. as a sentence unfolds word by word. illustrates how features of pattern transformations such as their sparsity may be related to experimental manipulations such as the predictability of a word in a sentence. The upper half shows an example for a simple three-word sentence with a predictable final word (‘Birds can fly’). We are all aware of most birds’ ability to fly and highly familiar with this concept. Flying is the one prominent ability that birds are known for.
Figure 3. Possible pattern transformations involved in a simplified illustration of sentence comprehension. Sentences are presented word by word. The neural patterns representing the meaning of each incoming word are represented by a 4-by-4 matrix. The pattern transformation (matrix next to black arrows) transforms each word into an evolving representation of the sentence meaning. We here assume that a predictable sentence ending (top) results in a sparser final transformation as well as sentence representation compared to an unpredictable sentence ending (bottom).
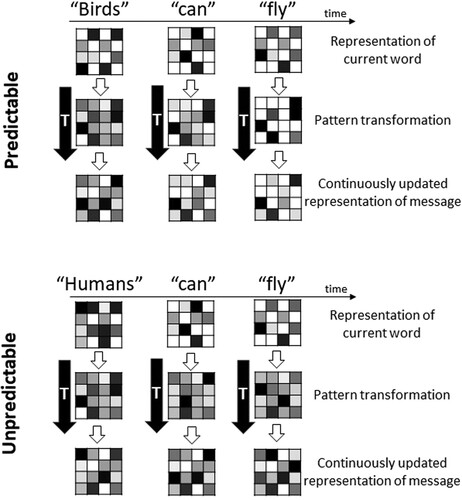
The first row of arbitrarily chosen 4-by-4 matrices illustrates the patterns representing the concept of the individual input words. The matrices in the second row (next to the thick black arrow) illustrate the transformation of these patterns into an output pattern that represents the current representation of the sentence meaning. Words are coming in one-by-one over time (e.g. by fixating them one after the other during reading, or hearing them in sequence during speech), and the representations of every input word are transformed differently, e.g. depending on preceding context and changing expectations, in order to update the sentence level meaning.
One possibility is that the activation patterns representing the input words only depend on the semantic content of the words, but the transformations from single word representations to sentence meaning and the patterns representing sentence meaning are shaped by context. In the example of a predictable sentence ending, the first word alone (‘Birds’) is not predictive of the overall sentence meaning. The transformation from single word to sentence meaning is therefore M2M, and the sentence meaning representation is still unspecified and widely distributed, since many possible representations are at least partially activated. With the next incoming word (‘can’), a prediction of the sentence meaning can be generated, leading to a sparser pattern transformation as well as a sparser sentence meaning representation. When the final word arrives (‘fly’), the prediction is confirmed, leading to an even sparser pattern transformation and the generation of a simple and sparse sentence meaning representation.
For unpredictable sentences (bottom half of ), the input patterns are similar to those for the predictable sentence before. In fact, only the first word differs. Humans are known to be able to do many things, and flying is usually not the first ability that comes to mind. Thus, the pattern transformations and sentence meaning representations do not become sparser over time. While the sentence is grammatical and meaningful, it refers to a less familiar concept that requires more information to make sense, e.g. that humans cannot naturally fly but need certain machines to do it.
While these examples are highly speculative, they show how the concept of pattern transformations could be used to test specific hypotheses in terms of pattern-to-pattern connectivity in neuroimaging data. In the following, we will discuss more ways in which experimental manipulations may affect pattern transformations.
In the above examples, we already discussed the possibility that context and task demands may modulate pattern transformations. It seems plausible that a task that requires the chain of information processing to converge on a specific representation, e.g. an individual name or face, should also show converging connectivity patterns. However, this depends on how semantic specificity of the representations is related to the sparseness or complexity of neuronal activity patterns that represent them. A specific concept may still be represented by a widely distributed pattern. While for concepts such as famous personalities sparse representations have been suggested (Quiroga, Citation2012), semantic representations are generally assumed to be widely distributed, possibly including multimodal brain areas (Binder & Desai, Citation2011; Lambon Ralph et al., Citation2017; Pulvermuller, Citation2013). Other tasks may require more divergent information flow, e.g. building associations with a specific concept (such as ‘name objects related to monkey!’).
In our illustrations we assumed that the information flow among brain systems is unidirectional, which lends itself to the characterisation in terms of transformation motifs (such as convergence and divergence). However, feedback connections and recurrent activation flow are common in the brain (Clarke et al., Citation2011; Kietzmann, Spoerer, Sörensen, et al., Citation2019; Lamme & Roelfsema, Citation2000). It has also been stated before that topographic maps can change over time (Tinsley, Citation2009), and therefore transformations can as well. Metabolic neuroimaging methods such as fMRI average brain activity over several seconds, and may thus conflate the effects of feedforward and feedback processes (Hauk, Citation2016). This problem is not specific to pattern-based decoding or transformation methods, but applies to conventional univariate analyses as well. The obvious way to address this would be to estimate pattern transformations using source-estimated EEG/MEG data (Rahimi, et al., Citation2022). Unfortunately, the spatial resolution of these data is fundamentally limited (Hauk et al., Citation2022; Hämäläinen et al., Citation1993; Molins et al., Citation2008), and the reliable estimation of all-to-all voxel-to-voxel (or vertex-to-vertex) transformations is currently not possible. Recent developments with non-cryogenic on-scalp sensors (e.g. ‘OPMs’) promise a significant improvement of spatial resolution of future MEG systems (Boto et al., Citation2018; Iivanainen et al., Citation2017). Furthermore, multidimensional connectivity methods can be applied to intracranial EEG or electrocorticography (ECoG) data, with the caveat that brain coverage with these invasive methods is usually very limited (Chen et al., Citation2016; Rogers et al., Citation2021). It will have to be seen how the ideas and concepts outlined above can be tested using spatio-temporal neuroimaging methods, with the exciting opportunity to describe the temporal dynamics of pattern transformations.
In the following two sections, we will first motivate the endeavour to analyse neural pattern transformation based on evidence for topographic mappings in sensory and higher-order cortical regions, and then describe analysis methods that have recently been proposed for this purpose.
The topographic organisation of brain regions and networks
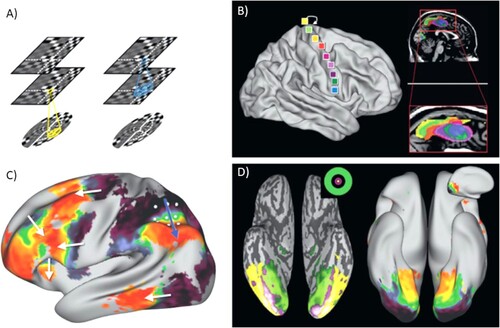
Before discussing methods to estimate pattern transformations from neuroimaging data, we will briefly present evidence for topographic maps and mappings between cortical regions, in order to motivate the search for systematic neuronal pattern transformations. Topographic maps are well established for sensorimotor brain areas (e.g. Goldman-Rakic, Citation1988; Kaas, Citation1997; Pantev et al., Citation1995; Patel et al., Citation2014; Penfield & Rassmussen, Citation1950; Sereno et al., Citation1994). For example, visual area V1 is retinotopically organised and contains a complete (although distorted) map of the image projected onto the retina (Felleman & Van Essen, Citation1991). Along the visual hierarchy, the topographical arrangement of neurons is preserved although receptive field sizes increase ((A)). Importantly, this topographic arrangement within regions is also reflected in topographic structural connectivity between regions, with neuronal fibres that originate close to each other also ending close to each other (Kaas, Citation1997). Such topographic connectivity has also been reported between primary motor areas and the supplementary motor area (SMA, (B)).
Figure 4. Examples of topographic projections based on anatomic and resting state data. (A) Illustration of retinotopy and topographic projections between visual areas V1 and V3. The topographical arrangement of neurons is preserved although receptive field sizes increase. (B) Somatotopy in the supplementary motor area (SMA) revealed by functional connectivity (resting state) between SMA and primary motor areas. Different colours in the SMA (right) correspond to connectivity with different seeds in primary motor cortex (left). (C) Resting-state connectivity (fMRI) between inferior parietal sulcus (white grid points). Colour coding indicates which grid point a voxel correlates most with. Similar gradients (white arrows) are observed in several brain regions. (D) Comparison between eccentricity maps (left) and resting-state functional connectivity maps (right, as in C with grid on medial surface of occipital lobe) for fMRI. This figure was published as in Jbabdi et al. (Citation2013), Copyright Elsevier.
For sensorimotor regions, a topographic organisation of neurons and their connections is plausible, as it allows efficient groupings of neurons that frequently interact and process related types of information (Kaas, Citation1997). The structure of sensorimotor regions ultimately reflects the physical structure of the real world, since visual features that are close to each other are likely to be part of the same object, sound frequencies that are close to each other are likely to reflect the same sound source, and fingers that are close to each other are likely to be used together. The processing of information in these areas is relatively automatised and rigid.
It is less clear whether topographic organisation can also be expected for higher level cortical areas. The information represented in these areas is usually abstract and needs to be processed flexibly depending on task, context and mental state. There is no obvious spatial structure that optimally represents this abstract information for flexible information processing. It is therefore surprising that topographic maps and mappings, where connectivity between areas preserves the spatial arrangements within areas, have also been reported in frontal, parietal and temporal areas, with evidence mostly based on structural MRI or resting state fMRI analyses (Hagler & Sereno, Citation2006; Ito et al., Citation2017; Jbabdi et al., Citation2013; Patel et al., Citation2014; Silver & Kastner, Citation2009; Thivierge & Marcus, Citation2007) ().
For example, voxels with high resting state correlations project to voxels that in turn show high resting state correlations among themselves. (C) shows how similar functional connectivity gradients can be observed in different parts of the cortex. Functional resting state connectivity was computed for seed regions in inferior parietal sulcus (IPS) and the whole cortex. The colour coding reflects which seed-point a voxel correlates most with. The white arrows highlight areas where the gradients observed in other cortical areas are similar to those in the original grid of seed points. (D) (right) shows a similar analysis for seed points in a grid along the medial surface of the occipital lobe, indicating that these connectivity gradients are a common feature in higher level cortices.
However, the functional relevance of these topographic arrangements is not yet established. In order to understand the mechanisms within a network, it would be useful to know the functions of at least some of its sub-structures where those can be identified. Frequently occurring sub-structures of a larger network are referred to as ‘motifs’ in graph theory (see for illustrations). Some general proposals for a role of certain motifs of topographical connections in higher-order cortical regions exist (Jbabdi et al., Citation2013; Thivierge & Marcus, Citation2007; Tinsley, Citation2009; Zajzon et al., Citation2019).
Figure 5. Examples of network motifs. (A) Motifs are frequently occurring smaller patterns of connectivity within a larger network. They may be considered as building blocks of the network serving particular computations of functions. This figure was published as Figure 14 in Costa et al. (Citation2007), Copyright Taylor & Francis. (B) Possible motifs for pattern-to-pattern connectivity between brain regions. (a) One-to-one connectivity, (b) Divergence, (c) Convergence. (C) This figure was published as in Tinsley (Citation2009), Copyright Elsevier.
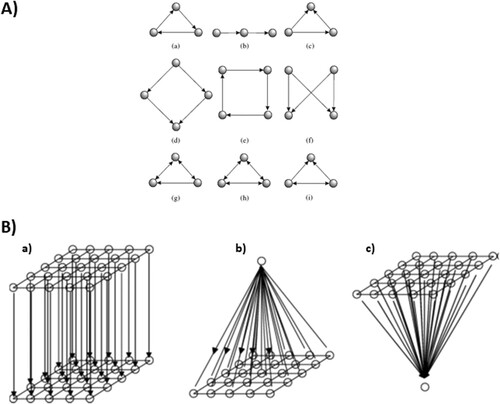
Some motifs lend themselves to an interpretation in terms of information flow: convergent projections may reflect the integration of information, e.g. from different receptive fields or different sensory areas; diverging projections may distribute information to different brain systems for different types of parallel processing, e.g. for decision making and retrieving associations from memory. Tinsley (Citation2009) associated point-to-point mappings with filtering, divergence with amplification and convergence with averaging. Thivierge and Marcus (Citation2007) highlighted the apparent prevalence of one-to-one mappings across the cortex, and propose that these have an essential role in analogical reasoning. For example, in order to complete the analogy ‘apple is to fruit as asparagus is to X’, one needs separate feature-to-feature mappings across two semantic categories.
The authors cited above acknowledge that ideas about the functional role of higher-order topographic connectivity is still speculative, and evidence is scarce and often circumstantial. Most of the evidence stems from anatomical connectivity and resting state studies. However, in order to determine the functional role of network connectivity and pattern transformations, we need to develop paradigms and methods to study them in task-based and event-related designs. In the following, we will briefly describe methods that have recently become available to test for pattern-to-pattern relationships between brain regions.
Methods for the estimation of pattern-to-pattern transformations
In this section, we briefly describe which methods are currently available to estimate multidimensional connectivity, in order to highlight that transformation-based connectivity methods have so far been largely neglected. We will focus in particular on methods that are suitable for task-based and event-related designs. For more detailed methodological information, see the recent review by Basti et al. (Citation2020) as well as the EEG/MEG studies by Rahimi, et al. (Citation2022) and (Citation2023).
In principle, these methods can be applied to both fMRI and EEG/MEG data. However, it is well-known that the BOLD response commonly measured with fMRI has very low temporal resolution in the range of several seconds, and is therefore rarely analysed in the frequency domain or on a sample-by-sample basis. In contrast, EEG/MEG have high temporal resolution in the millisecond range and can provide rich information in the time–frequency domain and on a more fine-grained temporal scale, but its limited spatial resolution complicates the interpretation of voxel-to-voxel relationships among regions. In the following, we will group different methods into categories depending on what type of information they are primarily based on, and will point out where appropriate for which measurement modality (i.e. fMRI or EEG/MEG) they are most suitable.
A measure that was introduced for fMRI analysis is Multivariate distance correlation, which reflects linear and nonlinear multidimensional relationships between two time-varying activation patterns (Geerligs & Henson, Citation2016; Székely et al., Citation2007). It measures whether distances between patterns at different time points in one region correlate with distances between patterns in another region. This measure is sensitive to a larger range of statistical dependencies between time series than a linear correlational approach, but it does not provide an estimate for the pattern-to-pattern transformations across regions.
Another category of functional connectivity methods is based on first computing multivariate metrics characterising pattern similarities per region, and then establishing region-to-region relationships for these metrics. For example, representational connectivity, based on representational similarity analysis (RSA (Kriegeskorte, Mur, & Bandettini, Citation2008; Laakso & Cottrell, Citation2000)), describes how the similarity structure of activation patterns in one region (e.g. the intercorrelation matrix of activity patterns for different stimuli) compares to the similarity structure of patterns in another region (Kriegeskorte, Mur, & Bandettini, Citation2008). This method is based on multivariate pattern information within each region, but the connectivity measure is not based on a voxel-by-voxel relationship between the regions. In other words, it measures whether the representational structures in two regions are similar or not, but does not describe how this structure is mapped from one region to another. This can be applied to fMRI data where activation patterns are first estimated for individual stimuli, as well as for EEG/MEG on a sample-by-sample basis.
In an approach specific to EEG/MEG the time course of similarity measures for a seed region is used to predict the corresponding time course of the target region, e.g. using metrics based on Granger-causality (Goddard et al., Citation2016; Karimi-Rouzbahani et al., Citation2022; Kietzmann, Spoerer, Sorensen, et al., Citation2019). This can reveal whether successful decoding of a specific type of information in one region at one latency can predict decoding of information in another region at another latency, but as before does not estimate the transformations among patterns.
A method that comes closer to estimating pattern transformations, Multivariate Pattern Dependence (MVPD), determines how well a multivariate time series in one region can predict that in another region (Anzellotti et al., Citation2017; Anzellotti & Coutanche, Citation2018). In this approach, the dimensionality of each multivariate time series is first reduced by using PCA and selecting only a few dominant principal components. The statistical dependency between the reduced time series can then be tested using linear regression. For example, if p principal components are chosen per region, then a square transformation matrix T with dimension p-x-p (i.e. p columns and p rows) can be estimated. The cross-validated goodness-of-fit for this transformation serves as a measure of functional connectivity between the regions. The statistical dependency between the reduced time series can also be estimated with nonlinear methods such as neural networks instead of linear regression (Anzellotti et al., Citation2017). In principle this method can be applied to fMRI as well as EEG/MEG data, but to our knowledge it has so far only been applied in the fMRI domain. The use of PCA to reduce the dimensionality of multidimensional time series requires the definition of a latency range. In the case of fMRI this prevents its application in event-related designs. While in principle this would be possible for EEG/MEG, this approach sacrifices temporal resolution, i.e. it cannot be applied on a millisecond-by-millisecond basis.
Furthermore, the application of PCA per region removes information about individual voxels, since every component reflects a weighted combination of all voxels within each region. Thus, as for representational connectivity and distance correlation, it provides a measure of functional connectivity strength but does not estimate the pattern transformation. Because PCA is applied over time, the method was applied to estimate connectivity across the whole datasets in two fMRI experiments, i.e. it did not distinguish connectivity between different tasks or stimuli (Anzellotti et al., Citation2017).
In principle, it is possible to take any unidimensional connectivity measure (e.g. correlation or coherence between time series) and apply it for every combination of voxels in two regions, which will result in a pattern-to-pattern connection matrix. Such an approach has been suggested for resting-state fMRI data (Cole et al., Citation2016; Ito et al., Citation2017). The transformation matrix between two regions is estimated based on the correlations of resting-state activation time-courses for voxel pairs of the two regions. These transformations can then be used to predict activity across regions for task-induced activation (‘information transfer mapping’). While this provides a pattern-to-pattern transformation matrix, it shares the limitation with MVPD above that it requires correlations over longer time periods (such as a whole block of data). It is therefore not well-suited for event-related experimental fMRI designs and sacrifices temporal resolution in the case of EEG/MEG.
A similar logic has been applied to EEG/MEG connectivity methods, where univariate methods such as (lagged) coherence and phase-slope index have been extended to the multidimensional case by applying them to all voxel-pairs between two regions and computing a summary metric (e.g. the mean). This has for example resulted in the multivariate phase-slope index (Basti et al., Citation2018) and the multivariate interaction measure (Ewald et al., Citation2012; Marzetti et al., Citation2013). So far, these methods have only been used to describe the strength of connectivity between regions, but not to characterise the pattern transformations. In principle, this information would be available from these methods, since connectivity strengths are estimated for every pair of voxels.
Only recently have methods been suggested to explicitly estimate the pattern transformations between regions for fMRI (Basti et al., Citation2019) and EEG/MEG data (Rahimi, et al., Citation2022) (illustrated in Figures and ). The approach is similar to MVPD as described above, but it is applied to activity patterns without reducing their dimensionality through PCA. Thus, the estimated transformations preserve the dimensionality of the patterns in the corresponding brain regions. As before, the cross-validated goodness-of-fit for this transformation can be used as a measure of functional connectivity between ROIs. Importantly, in this case the transformation contains information about the voxel-to-voxel dependencies between the regions.
Figure 6. Estimating features of pattern-to-pattern transformations between brain regions for event-related data. Activation patterns for individual stimuli are arranged as columns in one matrix per region (X and Y, respectively). The transformation T of patterns from X to Y can for example be estimated from the linear equation Y = TX using cross-validated ridge regression. Different metrics can be computed for the transformation T that describe different aspects of the regions’ pattern-to-pattern connectivity. This figure was published as in Basti et al. (Citation2019) (PLOS, Open Access).
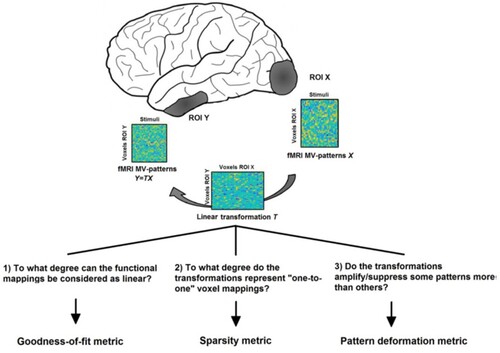
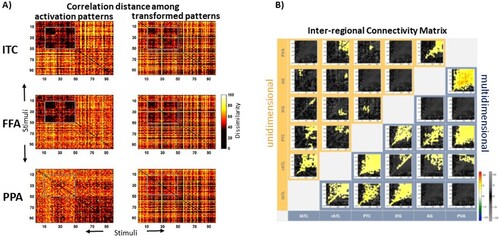
Figure 7. Examples of multidimensional connectivity results. (A) Representational dissimilarity matrices for fMRI patterns for pictures of objects. Every element within these matrices reflects the dissimilarity between patterns for two individual pictures (on the diagonal for identical pictures). Left panels: dissimilarity (correlation distance) among the multivariate fMRI activation patterns for inferior temporal cortex (ITC), fusiform face area (FFA) and parahippocampal place area (PPA). Right panels: Same as on the left, but here the multivariate patterns in ITC, FFA and PPA were estimated from linear transformations of patterns from early visual cortex (EVC). Some characteristic patterns of results in the left panels are also visible in the right panels, e.g. in the grey boxes for ITC and FFA that highlight dissimilarity values for face stimuli. Face stimuli do not pop out in the PPA. This shows that pattern transformations from EVC to higher-level areas capture stimulus-relevant information. This figure was published as in Basti et al. (Citation2019) (PLOS, Open Access). (B) Inter-regional Connectivity Matrix (ICM) for EEG/MEG source estimates for unidimensional (top left) and multidimensional (bottom right) connectivity. Shown is the statistical contrast between two word recognition tasks with different semantic processing depths. Each smaller matrix represents a Temporal Transformation Matrix (TTM), i.e. the explained variance for linear transformations of patterns across two regions (x- and y-axes of larger ICM, respectively) and two latencies (x- and y-axes of TTMs, respectively). The multidimensional method produces more statistically significant connectivity (in yellow) than its unidimensional counterpart. This figure was published as Figure 8 in Rahimi et al. (Citation2023) (Elsevier, Open Access).
This offers opportunities to define metrics that define particular features of the transformation. Basti et al. (Citation2019) proposed two such metrics in addition to the goodness-of-fit: (1) sparsity, describing to what degree the transformation consists of one-to-one mappings, and (2) pattern deformation, describing the degree to which the transformation rotates or rescales the patterns (). They applied this method to event-related data from an existing fMRI dataset. Instead of estimating the transformation matrix across the samples of the continuous time series (as in Anzellotti et al. (Citation2017)), they did so across activation patterns for individual stimuli in an event-related manner that allowed comparisons between different stimulus categories (faces and places). They found that the estimated transformations were surprisingly sparse. It is therefore an interesting tool for the investigation of connectivity for different types of linguistic stimuli.
Future methods developments should also provide measures that characterise network or transformation motifs (see ), especially with respect to those highlighted in our previous section and examples ( and ), i.e. convergence, divergence, one-to-one and many-to-many mappings.Footnote1 It will be exciting to investigate whether the results for these metrics obtained in real neural data resemble those obtained in different types of artificial neural networks, as has been suggested for pattern similarities between brain regions and network layers in a number of recent studies (Higgins et al., Citation2022; Karimi-Rouzbahani et al., Citation2022; Khaligh-Razavi & Kriegeskorte, Citation2014; Kietzmann, Spoerer, Sorensen, et al., Citation2019; Kriegeskorte, Citation2011; Naselaris et al., Citation2011).
Importantly, this method of estimating pattern transformations can be applied to EEG/MEG data on a sample-by-sample basis, which means it is suitable for event-related designs and exploits the full temporal resolution of EEG/MEG data. Not only can it estimate pattern transformations between pairs of regions, but it can also estimate these transformations for pairs of latencies. For example, one can test how patterns in left anterior temporal lobe at 100 ms are related to patterns in inferior frontal gyrus at 200 ms, and for all other combinations of latencies. This method has recently been introduced as Time-Lagged Multidimensional Pattern Connectivity (TL-MDPC, (Rahimi, Jackson, Farahibozorg, et al., Citation2023)). For any pair of regions this results in a temporal transformation matrix (TTM). If this is done for pairs among multiple regions, these TTMs can in turn be arranged into an Inter-regional Connectivity Matrix (ICM), as illustrated in (B) (based on (Rahimi, Jackson, Farahibozorg, et al., Citation2023)). As for MVPD (Anzellotti et al., Citation2017), these pattern-to-pattern relationships can also be estimated using nonlinear methods such as artificial neural networks. A nonlinear version of TL-MDPC has recently been reported to produce very similar results to its linear counterpart, suggesting that linear methods can provide a reasonable and computationally efficient approach to multidimensional connectivity (Rahimi et al., Citation2023).
Conclusion
Multidimensional connectivity methods have recently offered us powerful new approaches to investigate the human brain connectome. The ability to estimate the pattern-to-pattern transformations of brain activity across space and time will enable us to study the transformations of information across brain systems in more detail. While this will be applicable in all areas of cognitive neuroscience, it will be particularly exciting to see how this will transform the neuroscience of language.
Acknowledgments
For the purpose of open access, the authors have applied a CC BY public copyright license to any Author Accepted Manuscript version arising from this submission.
Disclosure statement
No potential conflict of interest was reported by the author(s).
Additional information
Funding
Notes
1 We would like to provide a novel definition of a ‘divergence and convergence index’ (DoCoI) here, although it has not been employed in any of the studies highlighted in this manuscript, in order to move this research forward: A DiCoI can be computed for a target voxel as follows:
Pick the largest connection strength C between target voxel and all other relevant voxels.
Compute the average difference between C and all other connection strengths (not including C), and divide by C.
This value will be 1 if all other connections are zero (i.e., connectivity is one-to-one), and zero if all other connections have the same strength (i.e., highly divergent from target voxel, or highly convergent towards target voxel). Thus:
Define the DiCoI as 1 minus the value obtained from 2 (such that higher values reflect larger convergence or divergence).
This index can be computed between all voxels within a target ROI and all voxels in other ROIs (or the whole brain), and averaged across target voxels.
References
- Anumanchipalli, G. K., Chartier, J., & Chang, E. F. (2019). Speech synthesis from neural decoding of spoken sentences. Nature, 568(7753), 493–498. https://doi.org/10.1038/s41586-019-1119-1
- Anzellotti, S., Caramazza, A., & Saxe, R. (2017). Multivariate pattern dependence. Plos Computational Biology, 13(11), e1005799. https://doi.org/10.1371/journal.pcbi.1005799
- Anzellotti, S., & Coutanche, M. N. (2018). Beyond functional connectivity: Investigating networks of multivariate representations. Trends in Cognitive Sciences, 22(3), 258–269. https://doi.org/10.1016/j.tics.2017.12.002
- Basti, A., Mur, M., Kriegeskorte, N., Pizzella, V., Marzetti, L., & Hauk, O. (2018a). Analysing linear multivariate pattern transformations in neuroimaging data. bioRxiv. https://doi.org/10.1101/497180
- Basti, A., Mur, M., Kriegeskorte, N., Pizzella, V., Marzetti, L., & Hauk, O. (2019). Analysing linear multivariate pattern transformations in neuroimaging data. PLoS One, 14(10), e0223660. https://doi.org/10.1371/journal.pone.0223660
- Basti, A., Nili, H., Hauk, O., Marzetti, L., & Henson, R. N. (2020). Multi-dimensional connectivity: A conceptual and mathematical review. Neuroimage, 221, 117179. https://doi.org/10.1016/j.neuroimage.2020.117179
- Basti, A., Pizzella, V., Chella, F., Romani, G. L., Nolte, G., & Marzetti, L. (2018b). Disclosing large-scale directed functional connections in MEG with the multivariate phase slope index. Neuroimage, 175, 161–175. https://doi.org/10.1016/j.neuroimage.2018.03.004
- Bastos, A. M., & Schoffelen, J. M. (2015). A tutorial review of functional connectivity analysis methods and their interpretational pitfalls. Frontiers in Systems Neuroscience, 9, 175. https://doi.org/10.3389/fnsys.2015.00175
- Binder, J. R., & Desai, R. H. (2011). The neurobiology of semantic memory. Trends in Cognitive Sciences, 15(11), 527–536. https://doi.org/10.1016/j.tics.2011.10.001
- Blank, H., Spangenberg, M., & Davis, M. H. (2018). Neural prediction errors distinguish perception and misperception of speech. The Journal of Neuroscience, 38(27), 6076–6089. https://doi.org/10.1523/JNEUROSCI.3258-17.2018
- Boto, E., Holmes, N., Leggett, J., Roberts, G., Shah, V., Meyer, S. S., & Brookes, M. J. (2018). Moving magnetoencephalography towards real-world applications with a wearable system. Nature, 555(7698), 657–661. https://doi.org/10.1038/nature26147
- Carota, F., Kriegeskorte, N., Nili, H., & Pulvermuller, F. (2017). Representational similarity mapping of distributional semantics in left inferior frontal, middle temporal, and motor cortex. Cerebral Cortex, 27(1), 294–309. https://doi.org/10.1093/cercor/bhw379
- Chan, A. M., Halgren, E., Marinkovic, K., & Cash, S. S. (2011). Decoding word and category-specific spatiotemporal representations from MEG and EEG. Neuroimage, 54(4), 3028–3039. https://doi.org/10.1016/j.neuroimage.2010.10.073
- Chen, L., Lambon Ralph, M. A., & Rogers, T. T. (2017). A unified model of human semantic knowledge and its disorders. Nature Human Behaviour, 1(3), 3. https://doi.org/10.1038/s41562-016-0039
- Chen, Y., Davis, M. H., Pulvermuller, F., & Hauk, O. (2015). Early visual word processing is flexible: Evidence from spatiotemporal brain dynamics. Journal of Cognitive Neuroscience, 27(9), 1738–1751. https://doi.org/10.1162/jocn_a_00815.
- Chen, Y., Shimotake, A., Matsumoto, R., Kunieda, T., Kikuchi, T., Miyamoto, S., & Lambon Ralph, M. A. (2016). The ‘when’ and ‘where’ of semantic coding in the anterior temporal lobe: Temporal representational similarity analysis of electrocorticogram data. Cortex, 79, 1–13. https://doi.org/10.1016/j.cortex.2016.02.015
- Cichy, R. M., Khosla, A., Pantazis, D., & Oliva, A. (2017). Dynamics of scene representations in the human brain revealed by magnetoencephalography and deep neural networks. Neuroimage, 153, 346–358. https://doi.org/10.1016/j.neuroimage.2016.03.063.
- Cichy, R. M., Ramirez, F. M., & Pantazis, D. (2015). Can visual information encoded in cortical columns be decoded from magnetoencephalography data in humans?. Neuroimage, 121, 193–204. https://doi.org/10.1016/j.neuroimage.2015.07.011
- Clarke, A. (2020). Dynamic activity patterns in the anterior temporal lobe represents object semantics. Cognitive Neuroscience, 11(3), 111–121. https://doi.org/10.1080/17588928.2020.1742678
- Clarke, A., Taylor, K. I., & Tyler, L. K. (2011). The evolution of meaning: Spatio-temporal dynamics of visual object recognition. Journal of Cognitive Neuroscience, 23(8), 1887–1899. https://doi.org/10.1162/jocn.2010.21544
- Cole, M. W., Ito, T., Bassett, D. S., & Schultz, D. H. (2016). Activity flow over resting-state networks shapes cognitive task activations. Nature Neuroscience, 19(12), 1718–1726. https://doi.org/10.1038/nn.4406
- Costa, L. D., Rodrigues, F. A., Travieso, G., & Boas, P. R. V. (2007). Characterization of complex networks: A survey of measurements. Advances in Physics, 56(1), 167–242. https://doi.org/10.1080/00018730601170527
- Coutanche, M. N., & Thompson-Schill, S. L. (2015). Creating concepts from converging features in human cortex. Cerebral Cortex, 25(9), 2584–2593. https://doi.org/10.1093/cercor/bhu057
- Devereux, B. J., Clarke, A., Marouchos, A., & Tyler, L. K. (2013). Representational similarity analysis reveals commonalities and differences in the semantic processing of words and objects. The Journal of Neuroscience, 33(48), 18906–18916. https://doi.org/10.1523/JNEUROSCI.3809-13.2013
- Ewald, A., Marzetti, L., Zappasodi, F., Meinecke, F. C., & Nolte, G. (2012). Estimating true brain connectivity from EEG/MEG data invariant to linear and static transformations in sensor space. Neuroimage, 60(1), 476–488. https://doi.org/10.1016/j.neuroimage.2011.11.084
- Felleman, D. J., & Van Essen, D. C. (1991). Distributed hierarchical processing in the primate cerebral cortex. Cerebral Cortex, 1(1), 1–47. https://doi.org/10.1093/cercor/1.1.1-a
- Friederici, A. D., & Gierhan, S. M. (2013). The language network. Current Opinion in Neurobiology, 23(2), 250–254. https://doi.org/10.1016/j.conb.2012.10.002
- Friston, K. J. (2011). Functional and effective connectivity: A review. Brain Connectivity, 1(1), 13–36. https://doi.org/10.1089/brain.2011.0008
- Geerligs, L., & Henson, R. N. (2016). Functional connectivity and structural covariance between regions of interest can be measured more accurately using multivariate distance correlation. Neuroimage, 135, 16–31. https://doi.org/10.1016/j.neuroimage.2016.04.047
- Goddard, E., Carlson, T. A., Dermody, N., & Woolgar, A. (2016). Representational dynamics of object recognition: Feedforward and feedback information flows. Neuroimage, 128, 385–397. https://doi.org/10.1016/j.neuroimage.2016.01.006
- Goldman-Rakic, P. S. (1988). Topography of cognition: Parallel distributed networks in primate association cortex. Annual Review of Neuroscience, 11(1), 137–156. https://doi.org/10.1146/annurev.ne.11.030188.001033
- Gonzalez Andino, S. L., Grave de Peralta, R., Khateb, A., Pegna, A. J., Thut, G., & Landis, T. (2007). A glimpse into your vision. Human Brain Mapping, 28(7), 614–624, https://doi.org/10.1002/hbm.20302. http://www.ncbi.nlm.nih.gov/entrez/query.fcgi?cmd=Retrieve&db=PubMed&dopt=Citation&list_uids=17133389
- Greenblatt, R. E., Pflieger, M. E., & Ossadtchi, A. E. (2012). Connectivity measures applied to human brain electrophysiological data. Journal of Neuroscience Methods, 207(1), 1–16. https://doi.org/10.1016/j.jneumeth.2012.02.025
- Haak, K. V., Marquand, A. F., & Beckmann, C. F. (2018). Connectopic mapping with resting-state fMRI. Neuroimage, 170, 83–94. https://doi.org/10.1016/j.neuroimage.2017.06.075
- Hagler, D. J., & Sereno, M. I. (2006). Spatial maps in frontal and prefrontal cortex. Neuroimage, 29(2), 567–577. https://doi.org/10.1016/j.neuroimage.2005.08.058
- Hagoort, P. (2013, July 12). MUC (memory, unification, control) and beyond. Frontiers in Psychology, 4, 416. https://doi.org/10.3389/fpsyg.2013.00416
- Hämäläinen, M. S., Hari, R., Ilmoniemi, R. J., Knuutila, J., & Lounasmaa, O. V. (1993). Magnetoencephalography - theory, instrumentation, and applications to noninvasive studies of the working human brain. Reviews of Modern Physics, 65(2), 413–497. https://doi.org/10.1103/RevModPhys.65.413
- Hauk, O. (2016). Only time will tell - why temporal information is essential for our neuroscientific understanding of semantics. Psychonomic Bulletin & Review, 23(4), 1072–1079. https://doi.org/10.3758/s13423-015-0873-9
- Hauk, O., Stenroos, M., & Treder, M. S. (2022). Towards an objective evaluation of EEG/MEG source estimation methods – The linear approach. Neuroimage, 255, 119177. https://doi.org/10.1016/j.neuroimage.2022.119177
- Hebb, D. O., Lambert, W. E., & Tucker, G. R. (1971). Language, thought and experience. The Modern Language Journal, 55(4), 212–222. https://doi.org/10.2307/323063.
- Higgins, C., Vidaurre, D., Kolling, N., Liu, Y., Behrens, T., & Woolrich, M. (2022). Spatiotemporally resolved multivariate pattern analysis for M/EEG. Human Brain Mapping, 43(10), 3062–3085. https://doi.org/10.1002/hbm.25835
- Hoffman, P., McClelland, J. L., & Lambon Ralph, M. A. (2018). Concepts, control, and context: A connectionist account of normal and disordered semantic cognition. Psychological Review, 125(3), 293–328. https://doi.org/10.1037/rev0000094
- Iivanainen, J., Stenroos, M., & Parkkonen, L. (2017). Measuring MEG closer to the brain: Performance of on-scalp sensor arrays. Neuroimage, 147, 542–553. https://doi.org/10.1016/j.neuroimage.2016.12.048
- Ito, T., Kulkarni, K. R., Schultz, D. H., Mill, R. D., Chen, R. H., Solomyak, L. I., & Cole, M. W. (2017). Cognitive task information is transferred between brain regions via resting-state network topology. Nature Communications, 8(1), 1027. https://doi.org/10.1038/s41467-017-01000-w
- Jackson, R. L. (2021). The neural correlates of semantic control revisited. Neuroimage, 224, 117444. https://doi.org/10.1016/j.neuroimage.2020.117444
- Jbabdi, S., Sotiropoulos, S. N., & Behrens, T. E. (2013). The topographic connectome. Current Opinion in Neurobiology, 23(2), 207–215. https://doi.org/10.1016/j.conb.2012.12.004
- Kaas, J. H. (1997). Topographic maps are fundamental to sensory processing. Brain Research Bulletin, 44(2), 107–112. https://doi.org/10.1016/s0361-9230(97)00094-4
- Karimi-Rouzbahani, H., Woolgar, A., Henson, R., & Nili, H. (2022). Caveats and nuances of model-based and model-free representational connectivity analysis. Frontiers in Neuroscience, 16, 755988. https://doi.org/10.3389/fnins.2022.755988
- Khaligh-Razavi, S. M., & Kriegeskorte, N. (2014). Deep supervised, but not unsupervised, models may explain IT cortical representation. PLoS Computational Biology, 10(11), e1003915. https://doi.org/10.1371/journal.pcbi.1003915.
- Kietzmann, T. C., Spoerer, C. J., Sörensen, L., Cichy, R. M., Hauk, O., & Kriegeskorte, N. (2019). Recurrence required to capture the dynamic computations of the human ventral visual stream. arXiv.
- Kietzmann, T. C., Spoerer, C. J., Sorensen, L. K. A., Cichy, R. M., Hauk, O., & Kriegeskorte, N. (2019). Recurrence is required to capture the representational dynamics of the human visual system. Proceedings of the National Academy of Sciences, 116(43), 21854–21863. https://doi.org/10.1073/pnas.1905544116
- Kocagoncu, E., Clarke, A., Devereux, B. J., & Tyler, L. K. (2017). Decoding the cortical dynamics of sound-meaning mapping. The Journal of Neuroscience, 37(5), 1312–1319. https://doi.org/10.1523/JNEUROSCI.2858-16.2016
- Kriegeskorte, N. (2011). Pattern-information analysis: From stimulus decoding to computational-model testing. Neuroimage, 56(2), 411–421. https://doi.org/10.1016/j.neuroimage.2011.01.061
- Kriegeskorte, N., Mur, M., & Bandettini, P. (2008). Representational similarity analysis - connecting the branches of systems neuroscience. Frontiers in Neuroscience, 2(1), 4, https://doi.org/10.3389/neuro.01.016.2008. http://www.ncbi.nlm.nih.gov/entrez/query.fcgi?cmd=Retrieve&db=PubMed&dopt=Citation&list_uids=19104670
- Kriegeskorte, N., Mur, M., Ruff, D. A., Kiani, R., Bodurka, J., Esteky, H., & Bandettini, P. A. (2008). Matching categorical object representations in inferior temporal cortex of man and monkey. Neuron, 60(6), 1126–1141, https://doi.org/10.1016/j.neuron.2008.10.043. http://www.ncbi.nlm.nih.gov/entrez/query.fcgi?cmd=Retrieve&db=PubMed&dopt=Citation&list_uids=19109916
- Laakso, A., & Cottrell, G. (2000). Content and cluster analysis: Assessing representational similarity in neural systems. Philosophical Psychology, 13(1), 47–76. https://doi.org/10.1080/09515080050002726
- Lambon Ralph, M. A., Jefferies, E., Patterson, K., & Rogers, T. T. (2017). The neural and computational bases of semantic cognition. Nature Reviews Neuroscience, 18(1), 42–55. https://doi.org/10.1038/nrn.2016.150
- Lamme, V. A., & Roelfsema, P. R. (2000). The distinct modes of vision offered by feedforward and recurrent processing. Trends in Neurosciences, 23(11), 571–579, https://doi.org/10.1016/S0166-2236(00)01657-X. http://www.ncbi.nlm.nih.gov/entrez/query.fcgi?cmd=Retrieve&db=PubMed&dopt=Citation&list_uids=11074267
- MacGregor, L. J., Rodd, J. M., Gilbert, R. A., Hauk, O., Sohoglu, E., & Davis, M. H. (2020). The neural time course of semantic ambiguity resolution in speech comprehension. Journal of Cognitive Neuroscience, 32(3), 403–425. https://doi.org/10.1162/jocn_a_01493
- Martin, A. (2007). The representation of object concepts in the brain. Annual Review of Psychology, 58(1), 25–45, https://doi.org/10.1146/annurev.psych.57.102904.190143. http://www.ncbi.nlm.nih.gov/entrez/query.fcgi?cmd=Retrieve&db=PubMed&dopt=Citation&list_uids=16968210
- Marzetti, L., Della Penna, S., Snyder, A. Z., Pizzella, V., Nolte, G., de Pasquale, F., & Corbetta, M. (2013). Frequency specific interactions of MEG resting state activity within and across brain networks as revealed by the multivariate interaction measure. Neuroimage, 79, 172–183. https://doi.org/10.1016/j.neuroimage.2013.04.062
- Mcclelland, J. L., & Rumelhart, D. E. (1985). Distributed memory and the representation of general and specific information. Journal of Experimental Psychology: General, 114(2), 159–188. https://doi.org/10.1037/0096-3445.114.2.159
- Molins, A., Stufflebeam, S. M., Brown, E. N., & Hamalainen, M. S. (2008). Quantification of the benefit from integrating MEG and EEG data in minimum l(2)-norm estimation. Neuroimage, 42(3), 1069–1077. https://doi.org/10.1016/j.neuroimage.2008.05.064
- Naselaris, T., Kay, K. N., Nishimoto, S., & Gallant, J. L. (2011). Encoding and decoding in fMRI. Neuroimage, 56(2), 400–410. https://doi.org/10.1016/j.neuroimage.2010.07.073
- O'Rawe, J. F., & Leung, H. C. (2020). Topographic mapping as a basic principle of functional organization for visual and prefrontal functional connectivity. Eneuro, 7(1), ENEURO.0532-19.2019. https://doi.org/10.1523/Eneuro.0532-19.2019.
- Pantev, C., Bertrand, O., Eulitz, C., Verkindt, C., Hampson, S., Schuierer, G., & Elbert, T. (1995). Specific tonotopic organizations of different areas of the human auditory cortex revealed by simultaneous magnetic and electric recordings. Electroencephalography and Clinical Neurophysiology, 94(1), 26–40, https://doi.org/10.1016/0013-4694(94)00209-4. http://www.ncbi.nlm.nih.gov/entrez/query.fcgi?cmd=Retrieve&db=PubMed&dopt=Citation&list_uids=7530637
- Patel, G. H., Kaplan, D. M., & Snyder, L. H. (2014). Topographic organization in the brain: Searching for general principles. Trends in Cognitive Sciences, 18(7), 351–363. https://doi.org/10.1016/j.tics.2014.03.008
- Penfield, W., & Rassmussen, T. (1950). The cerebral cortex of man. Macmillan.
- Poeppel, D. (2014). The neuroanatomic and neurophysiological infrastructure for speech and language. Current Opinion in Neurobiology, 28, 142–149. https://doi.org/10.1016/j.conb.2014.07.005
- Price, C. J. (2012). A review and synthesis of the first 20 years of PET and fMRI studies of heard speech, spoken language and reading. Neuroimage, 62(2), 816–847. https://doi.org/10.1016/j.neuroimage.2012.04.062
- Pulvermuller, F. (2013). How neurons make meaning: Brain mechanisms for embodied and abstract-symbolic semantics. Trends in Cognitive Sciences, 17(9), 458–470. https://doi.org/10.1016/j.tics.2013.06.004
- Quiroga, R. Q. (2012). Concept cells: The building blocks of declarative memory functions. Nature Reviews Neuroscience, 13(8), 587–597. https://doi.org/10.1038/nrn3251
- Rahimi, S., Farahibozorg, S. R., Jackson, R., & Hauk, O. (2022). Task modulation of spatiotemporal dynamics in semantic brain networks: An EEG/MEG study. Neuroimage, 246, 118768. https://doi.org/10.1016/j.neuroimage.2021.118768
- Rahimi, S., Jackson, R., Farahibozorg, S., & Hauk, O. (2023). Time lagged multidimensional pattern connectivity (TL MDPC): An EEG/MEG pattern transformation based functional connectivity metric. Neuroimage, 270, 119958. https://doi.org/10.1016/j.neuroimage.2023.119958.
- Rahimi, S., Jackson, R., & Hauk, O. (2023). Identifying nonlinear functional connectivity with EEG/MEG using nonlinear time-lagged multidimensional pattern connectivity (nTL-MDPC). bioRxiv. https://doi.org/10.1101/2023.01.19.524690
- Rodd, J. M. (2020). Settling into semantic space: An ambiguity-focused account of word-meaning access. Perspectives on Psychological Science, 15(2), 411–427. https://doi.org/10.1177/1745691619885860
- Rogers, T. T., Cox, C. R., Lu, Q., Shimotake, A., Kikuchi, T., Kunieda, T., Miyamoto, S., Takahashi, R., Ikeda, A., Matsumoto, R., & Lambon Ralph, M. A. (2021). Evidence for a deep, distributed and dynamic code for animacy in human ventral anterior temporal cortex. eLife, 10, 3052. http://doi.org/10.7554/eLife.66276
- Rogers, T. T., Hocking, J., Mechelli, A., Patterson, K., & Price, C. (2005). Fusiform activation to animals is driven by the process, not the stimulus. Journal of Cognitive Neuroscience, 17(3), 434–445. https://doi.org/10.1162/0898929053279531
- Rogers, T. T., Lambon Ralph, M. A., Garrard, P., Bozeat, S., McClelland, J. L., Hodges, J. R., & Patterson, K. (2004). Structure and deterioration of semantic memory: A neuropsychological and computational investigation. Psychological Review, 111(1), 205–235, https://doi.org/10.1037/0033-295X.111.1.205. http://www.ncbi.nlm.nih.gov/entrez/query.fcgi?cmd=Retrieve&db=PubMed&dopt=Citation&list_uids=14756594
- Rubinstein, H., Garfield, L., & Millikan, J. (1970). Homographic entries in the internal lexicon. Journal of Verbal Learning and Verbal Behavior, 9(5), 487–494. https://doi.org/10.1016/S0022-5371(70)80091-3
- Sereno, M. I., McDonald, C. T., & Allman, J. M. (1994). Analysis of retinotopic maps in extrastriate cortex. Cerebral Cortex, 4(6), 601–620. https://doi.org/10.1093/cercor/4.6.601
- Seth, A. K., Barrett, A. B., & Barnett, L. (2015). Granger causality analysis in neuroscience and neuroimaging. The Journal of Neuroscience, 35(8), 3293–3297. https://doi.org/10.1523/JNEUROSCI.4399-14.2015
- Silver, M. A., & Kastner, S. (2009). Topographic maps in human frontal and parietal cortex. Trends in Cognitive Sciences, 13(11), 488–495. https://doi.org/10.1016/j.tics.2009.08.005
- Stokes, M. G., Wolff, M. J., & Spaak, E. (2015). Decoding rich spatial information with high temporal resolution. Trends in Cognitive Sciences, 19(11), 636–638. https://doi.org/10.1016/j.tics.2015.08.016
- Székely, G. J., Rizzo, M. L., & Bakirov, N. K. (2007). Measuring and testing dependence by correlation of distances. The Annals of Statistics, 35(6), 2769–2794. https://doi.org/10.1214/009053607000000505
- Thivierge, J. P., & Marcus, G. F. (2007). The topographic brain: From neural connectivity to cognition. Trends in Neurosciences, 30(6), 251–259. https://doi.org/10.1016/j.tins.2007.04.004
- Tinsley, C. J. (2009). Creating abstract topographic representations: Implications for coding, learning and reasoning. Biosystems, 96(3), 251–258. https://doi.org/10.1016/j.biosystems.2009.03.003
- Tomasello, R., Garagnani, M., Wennekers, T., & Pulvermuller, F. (2018). A neurobiologically constrained cortex model of semantic grounding with spiking neurons and brain-like connectivity. Frontiers in Computational Neuroscience, 12. https://doi.org/10.3389/fncom.2018.00088
- Valdes-Sosa, P. A., Roebroeck, A., Daunizeau, J., & Friston, K. (2011). Effective connectivity: Influence, causality and biophysical modeling. Neuroimage, 58(2), 339–361, https://doi.org/10.1016/j.neuroimage.2011.03.058. http://www.ncbi.nlm.nih.gov/entrez/query.fcgi?cmd=Retrieve&db=PubMed&dopt=Citation&list_uids=21477655
- Vinckier, F., Dehaene, S., Jobert, A., Dubus, J. P., Sigman, M., & Cohen, L. (2007). Hierarchical coding of letter strings in the ventral stream: Dissecting the inner organization of the visual word-form system. Neuron, 55(1), 143–156, https://doi.org/10.1016/j.neuron.2007.05.031. http://www.ncbi.nlm.nih.gov/entrez/query.fcgi?cmd=Retrieve&db=PubMed&dopt=Citation&list_uids=17610823
- Zajzon, B., Mahmoudian, S., Morrison, A., & Duarte, R. (2019). Passing the message: Representation transfer in modular balanced networks. Frontiers in Computational Neuroscience, 13, 79. https://doi.org/10.3389/fncom.2019.00079