
Abstract
The FAS phonemic fluency test is a commonly used neuropsychological test of executive function and processing speed. Although Norwegian discrete norms have been developed for the FAS test, American regression-based norms are frequently used by clinicians in Norway.
However, language and cultural differences impact performance on the FAS test, and using foreign norms may not be appropriate. Moreover, while discrete norming relies on stratified subgroups of demographics, regression-based norming uses the entire sample to estimate the influence of demographics on performance and may thus improve normative estimates. Here we develop regression-based norms for the FAS phonemic fluency test based on n = 204 healthy Norwegian controls between the ages 40−84 from the Norwegian Dementia Disease Initiation cohort (DDI). We compare the proposed regression norms to published Norwegian discrete norms and American regression-based norms in an independent sample of n = 182 cognitively healthy adults reporting subjective cognitive decline (SCD). We found that years of education was the only significant predictor of FAS performance in our normative sample, accounting for 14.9% of the variance. Both the proposed regression-based norms and previously published discrete norms adequately adjusted for demographics in the independent sample. In contrast, the American norms underestimated the effect of education and overestimated the effect of age. While both the proposed Norwegian regression norms and the previously published discrete norms are suitable for use in Norway, the proposed regression norms may be less vulnerable to sub-stratification sample characteristics posed by discrete norming procedures, and thereby improve normative estimation.
Introduction
The FAS phonemic fluency test was originally developed by Spreen and Benton (Citation1969) as part of the Neurosensory Center Comprehensive Examination for Aphasia. The test is a measure of phonemic verbal fluency and requires patients to name as many words as possible starting with F, A and S in 60 seconds, respectively. Benton later revised the FAS phonemic fluency test, and included it in the Multilingual Aphasia Examination under a new name: Controlled Word Order Association Test (COWAT) (Benton & Hamsher, Citation1989). Phonemic fluency tests require patients to retrieve relevant words from memory, while inhibiting all words that do not fulfill the phonemic task demands. Test performance has been linked to executive control in the left frontal lobe (Robinson et al., Citation2012), and brain imaging studies have shown that individuals with frontal lobe lesions have corresponding deficits on phonemic fluency tasks (Baldo et al., Citation2006; Robinson et al., Citation2012). The FAS phonemic fluency test is often used in neuropsychological assessments, as impaired phonemic fluency is commonly seen in Alzheimer’s dementia, frontotemporal dementia, mild cognitive impairment (Nutter-Upham et al., Citation2008), Parkinson’s disease (Dadgar et al., Citation2013), aphasia (Basso et al., Citation1997) and other brain disorders (Henry & Crawford, Citation2004). The FAS phonemic fluency test also aids differentiation of Alzheimer’s Dementia and frontotemporal dementia (Perri et al., Citation2005), and is a valuable tool in clinical assessments, as well as in research.
Neuropsychological test norms allow us to compare individual patient performance to the expected normative performance in the population, while controlling for relevant demographic factors. Previous research show that performance on phonemic fluency tests is positively associated with years of education (Machado et al., Citation2009; Tallberg et al., Citation2008; Tombaugh et al., Citation1999). While some report that increasing age is related to worse performance on the FAS phonemic fluency test (Egeland et al., Citation2006; Loonstra et al., Citation2001), others do not (Bolla et al., Citation1990).
Several sets of norms have been published for the FAS phonemic fluency test (Heaton et al., Citation2004; Loonstra et al., Citation2001; Machado et al., Citation2009; Tombaugh et al., Citation1999). However, the majority are based on English-speaking samples. In Norway there is a long-standing practice of using English-based norms for the FAS phonemic fluency test, reasoning that such norms would prove appropriate due to cultural similarities. However, these norms may be less appropriate in a Norwegian sample. Indeed, we have recently shown that education affects performance on neuropsychological tests, such as the Trail Making Test, differently in a Norwegian sample compared to a US sample (Espenes et al., Citation2020), possibly owing to differences in schooling opportunities and cultural differences. Moreover, first letter word frequencies (i.e. FAS) may vary both within and between languages (Berkowitz & Donnerstein, Citation1982; Steenhuis & Ostbye, Citation1995; Vogel et al., Citation2020). This is also exemplified by phonemic fluency versions using CFL instead of FAS. The lower first letter frequencies compared to FAS make the CFL version more difficult, and participants name fewer words (Barry et al., Citation2008). Studies of FAS performance in English-speaking and French-speaking Canadians have shown different FAS phonemic fluency scores between language groups, even when adjusting for education (Steenhuis & Ostbye, Citation1995; Tuokko et al., Citation1995). A comparison of commonly used words in English and Norwegian showed that first letter frequencies differ. Norwegian has a larger percentage of words starting with F (8.8%) and S (13.4%), and fewer words starting with A (4.8%) compared to English (F = 4.7%, S = 12%, A = 6.7%) (Kilgarriff et al., Citation2014). Thus, using phonemic fluency test norms developed in a foreign language may be inappropriate.
To our knowledge, only one previous study has presented norms for the FAS phonemic fluency test based on a Norwegian sample (Egeland et al., Citation2006). However, this study made use of a conventional discrete norming procedure (i.e. the norms rely on stratified reference groups for comparison). While easy to use, conventional discrete norms require large sample sizes for accurate normative estimations (Oosterhuis et al., Citation2016). Moreover, the arbitrary grouping of continuous variables into stratified normative reference groups (e.g. age or education bands) may lead to a significant rise or fall in normed scores when moving from one stratum to the next. While this can be solved by creating more stratification groups, additional groupings require larger sample sizes (Oosterhuis et al., Citation2016). A popular alternative is to make use of regression-based norming procedures (Duff & Ramezani, Citation2015; Kirsebom et al., Citation2019; Testa et al., Citation2009; Van der Elst et al., Citation2006) that estimate linear or non-linear effects of demographics on test scores without the use of stratified reference groups. This approach is more efficient, as it uses the entire sample for normative estimation, and requires between 2.5 and 5.5 times smaller sample sizes than discrete norming procedures (Oosterhuis et al., Citation2016). Moreover, previous normative studies have used regression-based norming to create norms for the FAS phonemic fluency test (Cavaco et al., Citation2013; Heaton et al., Citation2004; Rodríguez-Lorenzana et al., Citation2020; Vicente et al., Citation2021; Vogel et al., Citation2020).
The aim of this study is to develop new regression-based test norms for the FAS phonemic fluency test for ages 40−84 years based on a Norwegian sample of healthy adults, and assess if local regression-based norms perform better in an independent Norwegian sample than the commonly applied American regression-based norms by Heaton et al. (Citation2004) and the published Norwegian discrete norms (Egeland et al., Citation2006). We hypothesize that (1), in a Norwegian sample, both previously published discrete norms and the proposed regression-based norms will be more appropriate than American regression-based norms. (2), that the proposed regression-based norms will show benefits in terms of improved normative estimation over previously published discrete norms. We compare the norms in an independent sample of cognitively healthy Norwegians who experience subjective cognitive decline, and discuss pertinent advantages of using local norms. Finally, we discuss the benefits of the regression-based norming procedure compared to discrete norming. As calculations of regression-based norms are more difficult than conventional discrete norms, we provide a free online normative calculator for ease of use.
Methods and materials
Participants
The present study is a part of the Dementia Disease Initiation (DDI), a multi-center study focused on research and early detection of dementia and other neurodegenerative diseases. Data in the DDI study were collected in collaboration with university hospitals in all health regions in Norway and is conducted at the following sites: Akershus University Hospital; St. Olav’s Hospital, Trondheim University Hospital; Stavanger University Hospital; Haugesund hospital; Betanien hospital; and UNN The University Hospital of North Norway. Participants were recruited between 2013 and 2020. Criteria for inclusion in the DDI study were ages from 40 to 80+ years and a native language of Swedish, Danish, or Norwegian. However, only native Norwegian speakers were included in the present study. Exclusion criteria were brain trauma or disorder, including clinical stroke, dementia, severe psychiatric disorder, severe somatic disease that might influence cognitive functions, intellectual disability, or other developmental disorders. All participants were assessed with a clinical interview and standardized clinical assessment following a case report form (CRF), neuropsychological testing, neurological examination, blood samples, and a majority also agreed to a lumbar puncture. The neuropsychological test battery included the FAS phonemic fluency test (Benton & Hamsher, Citation1989), the Visual Object and Space Perception Battery (VOSP) silhouettes test (Warrington & James, Citation1991), Trail making tests (TMT) A & B (Reitan & Wolfson, Citation1985), and the CERAD word list memory test (Fillenbaum et al., Citation2008). Neuropsychological testing was performed by licensed psychologists or study nurses, or by psychologists-in-training under the supervision of a licensed psychologist. Symptom of SCD or diagnosis of MCI were determined according to published criteria (Albert et al., Citation2011; Jessen et al., Citation2014). As both require the experience of subjective cognitive impairment or decline, SCD versus MCI was determined by normal or impaired cognition based on results ≤1.5 standard deviation above or below the normative mean on CERAD delayed memory recall (Kirsebom et al., Citation2019), TMT-B (Espenes et al., Citation2020), FAS phonemic fluency test (Heaton et al., Citation2004) and the VOSP silhouettes test (Warrington & James, Citation1991).
For the purposes of the current study, all participants diagnosed with MCI were excluded and only healthy controls (n = 204) and SCD participants (n = 182) were included. The healthy controls were primarily recruited from spouses of symptomatic patients included in DDI, and secondarily from volunteers responding to advertisements in media or news bulletins. All healthy controls fulfilled the general inclusion criteria, did not report symptoms of SCD, and were classified as healthy controls by medical professionals following the aforementioned standardized clinical evaluations. The healthy control sample was used for development of the regression-norms. The SCD participants were primarily recruited through clinical referrals to memory clinics and secondarily through advertisements in media. While reporting symptoms of cognitive decline, these participants were deemed cognitively healthy (i.e. performed within the normal range on neuropsychological tests) and where thus included as an independent sample for the purpose of norm validation. While both healthy controls and SCD participants completed the entire battery of neuropsychological tests as a part of the standardized clinical evaluation in DDI, only results from the FAS phonemic fluency test were used in the development and validation of the new test norms. For more detailed information regarding the clinical assessment and other procedures, see Fladby et al. (Citation2017).
Between samples comparisons of demographics and FAS performance
A study by Oosterhuis et al. (Citation2016) showed that a sample size of between 100 and 500 participants for regression-based norms should provide similar precision as sample sizes of between 3000 and 4000 using a discrete norming procedure. The normative sample used for developing FAS phonemic fluency norms in the current study comprised n = 204 healthy controls and should thus be adequate for regression-based norming. Our sample size is also similar to previous normative studies using regression-based norming (Kirsebom et al., Citation2019; Vogel et al., Citation2020). Participant data in the normative sample included age, sex, years of education and FAS total scores. Of 204 participants, 196 also had the separate F, A and S letter scores.
All participants in the SCD (n = 182) sample included information about age, sex, years of education, FAS total score and the separate F, A, and S letter scores. The SCD sample was used to validate the demographic adjustment of the proposed norms, and to compare the new norms to the previously published Norwegian and American norms. To ensure that the SCD sample was an adequate comparison to the healthy control sample, we performed summary independent t-tests comparing demographics and FAS raw test scores. This analysis showed no significant differences in age, years of education and raw test scores between the two samples (). Thus, we concluded that the SCD sample is appropriate to use as an independent sample for norm validation.
Table 1. Comparisons of demographics and FAS performance between the healthy controls and participants with subjective cognitive decline (SCD).
Ethics
The DDI study was approved from 2013 until 2025 by the Regional Committees for Medical and Health Research Ethics. The study has been conducted in compliance with the Helsinki declaration of 1964 and the Norwegian Health Research Act of 2009. All participants were informed of their right to withdraw at any time, and of potential risks and rewards. All participants signed written informed consent forms confirming their participation.
Testing procedure
Participants were instructed to name as many words as possible starting with the letters F, A and S. Each letter trial lasted 60 seconds. Names of people and places, numbers, as well as alternative versions of the same word, e.g. string and strings, were excluded.
Statistical analysis
Regression norming procedure
The regression-based norms were developed following procedures described in previously published literature (Espenes et al., Citation2020; Kirsebom et al., Citation2019; Testa et al., Citation2009; Van der Elst et al., Citation2006). For the present project, preliminary analyses showed that the FAS raw test scores followed normal distributions, thus normal transformation procedures were not required. To ensure that assumptions for regression analyses were met, we examined the normality of residuals visually through Q–Q plots. Outliers were screened by visually examining plots of Cook’s Distance values and standardized residuals. One outlier was identified and excluded from the analyses. The assumption of homoscedasticity was ensured by visually inspecting plots of residual and predicted values. In preliminary analyses we also assessed linear relationships between FAS performance and the demographic predictors years of education, age and sex in separate simple regression models.
Next, hierarchical regression models for letters F, A, S and FAS total were fitted by entering demographic variables and squared terms (years of education, years of education2, age, age2 and sex) into the regression analyses by order of assumed importance. Assumed importance was decided by following results from published normative studies on the FAS phonemic fluency test (Bolla et al., Citation1990; Egeland et al., Citation2006; Heaton et al., Citation2004; Tallberg et al., Citation2008; Tombaugh et al., Citation1999; Vogel et al., Citation2020). Since most studies find prominent effects of years of education (Heaton et al., Citation2004; Tallberg et al., Citation2008; Tombaugh et al., Citation1999; Vogel et al., Citation2020), this variable was entered first, followed by years of education2, age, age2 and sex. The final regression model comprised all significant predictors, which were then used to calculate normative performance.
Calculating normative performance
Demographically adjusted predicted scores can be calculated using the regression coefficients from the final normative regression model and the following formula: [intercept + (demographic variable*regression coefficient)]. This formula produces demographically adjusted predicted raw scores. To calculate demographically adjusted standardized z-scores we subtract the predicted raw score from the observed raw score and divide by the standard deviation of the residuals [z-score = (observed raw score – predicted raw score)/residual SD]. The resulting z-score may be converted to a T-score (M = 10, SD = 50) using the following formula: z-score*10 + 50.
Evaluating the demographic adjustment of the new norms in the independent SCD sample
Following the method described in the section above, we calculated demographically adjusted T-scores using the proposed regression-based norms, the Norwegian discrete norms by Egeland et al. (Citation2006) and the American regression-based norms by Heaton et al. (Citation2004) in the independent sample of SCD participants. Neither Heaton et al. (Citation2004) nor Egeland et al. (Citation2006) report scores for the separate letter trials. Thus, only the FAS total T-scores are compared. While the discrete norms by Egeland et al. (Citation2006) adjust for years of education only, the regression-based norms by Heaton et al. (Citation2004) adjust for both years of education and age. To investigate if the norms adequately adjust for demographic factors, multiple regression analyses were performed with the respective T-scores as the dependent variable and demographics (years of education, age, and sex) as independent variables. If results show significant associations between demographics and T-scores, we can assume that the norms do not adequately adjust for demographics, conversely a non-significant result will indicate adequate adjustment for demographics.
Comparing the new regression-based norms to previously published norms
To further evaluate the performance of the norms, T-scores derived from the Egeland et al. (Citation2006) norms and the Heaton et al. (Citation2004) norms were compared to the proposed regression norms using paired samples t-tests. Moreover, as Heaton et al. (Citation2004) report significant normative influence of both education and age, paired samples t-tests were also carried out between groups of high and low education split by high and low age. Groups were based on the median years of education (≤13 and ≥14 years) and median age (≤63 and ≥64 years) in the normative sample.
Norm calculator
In order to make the proposed norms accessible for clinicians and researchers, we have developed a pure HTML5/Javascript web-based norm calculator. The web application is self-contained, with minimal external dependencies for interface styling and internal computations. The result is a simple Graphical User Interface that allows inputting patients’ FAS total raw score and years of education to obtain demographically adjusted T-scores for each item. The calculator truncates the normative estimates to 3 SDs around the mean (i.e. T scores between 20 and 80). This was done for two reasons: (1) estimates beyond these limits cannot be estimated with sufficient precision and (2) it avoids unrealistic T-scores being produced by the regression coefficients if the user mistakenly inputs wrongful raw scores. The calculator is released as Open Source under Apache License 2.0 at https://github.com/DDI-NO/cowat-calc. and available at https://uit.no/ressurs/uit/cerad/cowat-calc.html
Results
The effect of demographic variables on FAS phonemic fluency scores
In the preliminary simple regression analyses, years of education was associated with increased performance on FAS total (F(1, 202)=35.3, β = 0.386, p < 0.001), and letters F (F(1, 194) = 29.5, β = 0.363, p < 0.001), A (F(1, 194) = 20.2, β = 0.307, p < 0.001) and S (F(1, 194) = 18.6, β = 0.296, p < 0.001). No significant associations between FAS performance, nor separate letter trials for neither age nor sex were demonstrated.
The hierarchical regression analyses showed that years of education was significantly associated FAS performance, and accounted for 14.9% of the variance on FAS total scores. However, when F, A and S were assessed separately, education accounted for 13.2% on F, whereas on A and S education only accounted for 8.9% and 8.8% of the variance. The letter S score was also significantly associated with years of education2. However, the squared term was not significantly associated with the FAS total, letter F or letter A scores. To avoid overfitting, we used the Bayesian Information Criterion (BIC) to evaluate the models with and without the squared term. According to the BIC the model with years of education as the only predictor yielded a slightly better fit compared to the model including the squared term. Thus, we decided to exclude years of education2 from the final model. Age, age2 and sex were not associated with FAS performance in any of the regression models. The final normative regression model and coefficients are reported in .
Table 2. Normative regression models for total FAS score and separate letter trials.
Evaluation of demographic adjustment in the independent SCD sample
Multiple regression analyses showed that the new regression-based norms adequately adjusted for demographics on F (F(3, 178) = 0.961, p = 0.413), A (F(3, 178) = 0.319, p = 0.811), S (F(3, 178) = 1.266, p = 0.288) and the FAS total score (F(3, 178) = 0.783, p = 0.505) in the independent SCD sample. The norms by Egeland et al. (Citation2006) adequately adjusted for demographics on the FAS total score in the SCD sample (F(3, 178) = 0.974, p = 0.406)). In contrast, the norms by Heaton et al. (Citation2004) showed a significant effect of both education (β = 0.215, partial r2 = 0.045, p < 0.01)) and age (β = 0.184, partial r2 = 0.033, p < 0.05). The demographically adjusted T-scores showed a positive relationship with age and education, where both higher age and longer education were associated with higher T-scores. This indicates that the norms by Heaton et al. (Citation2004) did not adequately adjust for demographic factors in the SCD sample (adjusted r2 = 0.053, F(2,179) = 6.089. p < 0.01).
Comparisons of proposed norms to previously published norms
Descriptive statistics and within-group comparisons are shown in . Within-group differences in T-score estimations for the different norms are illustrated in . When analyzing the entire sample, paired sample t-tests showed slightly, albeit statistically significant lower mean T-scores using the Norwegian Egeland et al. (Citation2006) norms compared to the proposed regression norms (Mdiff = 2.82, p < 0.001). In contrast, overall mean T-scores using Heaton et al. (Citation2004) norms were similar to the new regression-based norms. When comparing norms by age and educational groups, the Egeland et al. (Citation2006) norms showed significantly lower means compared to the new norms in all groups. However, the largest mean difference was shown in younger participants with higher education (Mdiff = 0.35, p < 0.001). In contrast, the T-scores produced with Heaton et al. (Citation2004) norms were significantly lower in younger participants with lower education (Mdiff = 1.53, p < 0.001) and higher in older participants with higher education (Mdiff = −1.92, p < 0.001).
Figure 1. Bar plot of within-group differences in T-scores for the proposed norms (A), the norms by Heaton et al. (Citation2004) (B), and norms by Egeland et al. (Citation2006) (C). The dashed line represents the expected normative mean (T = 50).
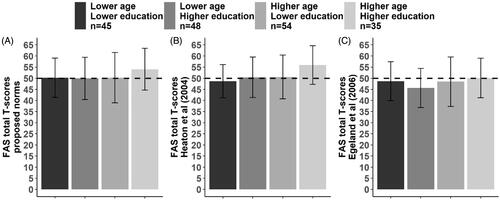
Table 3. Comparisons between normative estimates on FAS total T-scores in the independent SCD sample.
Discussion
In this study we propose demographically adjusted FAS phonemic fluency norms based on a sample of Norwegian adults between the ages of 40 and 84. We compared the new regression based norms to previously published Norwegian and American norms (Egeland et al., Citation2006; Heaton et al., Citation2004). We found that years of education was the only demographic variable associated with increased FAS total score, accounting for 14.9% of the variance. This is in line with previous normative studies demonstrating significant associations between years of education and performance on the FAS phonemic fluency test across different countries (Egeland et al., Citation2006; Machado et al., Citation2009; Olabarrieta-Landa et al., Citation2015; Tallberg et al., Citation2008; Vogel et al., Citation2020). Interestingly, normative studies of FAS phonemic fluency from Sweden (Tallberg et al., Citation2008) and Denmark (Vogel et al., Citation2020) report similar effects of education on test performance as the present study (approximately 13%), which might be explained by similarities in culture, language and educational opportunities between Scandinavian countries. As demonstrated, both the new regression-based norms as well as the previously published discrete Norwegian norms (Egeland et al. (Citation2006) adequately adjusted for demographics in our independent SCD sample. In contrast, the American Heaton et al. (Citation2004) norms were shown to inaccurately adjust for the normative effects of both age and education when applied to a Norwegian sample. This is not surprising since Heaton et al. (Citation2004) reported that education accounted for only 3% of the variance in scores in their sample, compared to roughly 13% in Scandinavian normative studies (Tallberg et al., Citation2008; Vogel et al., Citation2020). It is possible that the differences in demographic estimates may be caused by language or cultural factors not accounted for in the analyses. As previously mentioned, the English language contains more commonly used words beginning with the letter A than the Norwegian language (Kilgarriff et al., Citation2014). Low frequency words are thought to be more difficult to retrieve from memory, which could affect how many words participants produce (Barry et al., Citation2008; Borkowski et al., Citation1967). This is illustrated by the present study’s FAS letter scores, which correspond with the relative frequencies of the specific letters in the Norwegian language. Participants produce fewer words for the least frequent letter (A), and more words for the highly frequent letter S. Due to language differences many non-English studies of phonemic fluency use other letters than F, A and S. While highly frequent letters are often chosen, the relative frequency of the different letter triads (e.g. PMK, PMR, NAK) do not necessarily correspond to the frequency of F, A and S in the English language (Cavaco et al., Citation2013; Ghasemian-Shirvan et al., Citation2018; Lannoo & Vingerhoets, Citation1997). Using letters with higher or lower frequencies compared to F, A and S might change the difficulty of the test, and consequently affect the influence of demographics on test scores. However, studies using other letter triads report that years of education explain between 6% and 30% of the variance (Cavaco et al., Citation2013; Ghasemian-Shirvan et al., Citation2018; Kosmidis et al., Citation2004; Lannoo & Vingerhoets, Citation1997; St-Hilaire et al., Citation2016). Similarly, studies using F, A and S report that education accounts for 3–23% of the variance (Heaton et al., Citation2004; Olabarrieta-Landa et al., Citation2015; Tombaugh et al., Citation1999). As such, it appears that there is an unclear relationship between letter frequency, test difficulty and the effect of education on test scores. We were not able to test if differences in test difficulty affect the influence of demographics since Heaton et al. (Citation2004) only report norms for the FAS total score and not the separate letters. Clinicians and researchers applying norms should be aware that test difficulty and letter frequency may be possible sources of bias when employing phonemic fluency test norms based on foreign languages. Also, differences in educational opportunities, socio-economic status, language, and culture may cause differing estimations of demographics.
In addition to an effect of education, Heaton et al. (Citation2004) reported that increasing age was associated with lower FAS performance, accounting for 4% of the variance. In the present study, and in the previous Egeland et al. (Citation2006) study, no significant effects of age on performance were demonstrated. While some studies report effects of age on phonemic fluency measures, the association between increasing age and worse performance has been debated. Notably, vocabulary tend to increase with age rather than decrease (Ben-David et al., Citation2015; Verhaeghen, Citation2003). In contrast, processing speed tends to slow with age (Salthouse, Citation1996) and has been linked to age-related structural brain changes (Van den Heuvel et al., Citation2006). Consequently, it has been put forward that reduced processing speed, rather than knowing fewer words, may account for the observed association between declining phonemic fluency performance with increasing age (Elgamal et al., Citation2011). The study by Egeland et al. (Citation2006) initially found an age effect, showing that older participants performed slightly poorer compared to younger participants on the FAS phonemic fluency test. However, this effect was eliminated when taking the stronger influence of education into account. Moreover, their sample included ages from 16 through 77, putatively allowing for a slight linear effect of age on performance to be modeled. Similarly, Heaton et al. (Citation2004) provide linear regression-based norms from ages 20 through 85 years. The wide age range may in part explain the modest (4%), albeit significant effects of age modeled in their sample. In contrast, the present study included a sample with a narrower age range (40−84 years), providing a possible explanation for the non-significant age effect in our sample. While years of education was the only significant predictor of test performance in our study, these norms should only be applied to individuals with the same age range as our normative sample.
In line with most studies of FAS performance (Gladsjo et al., Citation1999; Heaton et al., Citation2004; Rodríguez-Lorenzana et al., Citation2020; Tombaugh et al., Citation1999; Vogel et al., Citation2020), we did not find any significant effect of sex on FAS scores. Similarly, neither Heaton et al. (Citation2004) nor Egeland et al. (Citation2006) found significant effects of sex. While some studies report that women perform slightly better than men on the FAS phonemic fluency test, possibly caused by stronger verbal abilities in women (Lezak et al., Citation2012), the reported effect sizes are small (Bolla et al., Citation1990; Cavaco et al., Citation2013; Loonstra et al., Citation2001). Possible sex effects might also be influenced by larger cultural factors, such as differences in access to education or socio-economic status. As Norway is regarded as one of the most gender equal countries in the world (World Economic Forum, Citation2019), such cultural factors may be less influential in a Norwegian sample. Similarly, normative studies from Denmark and Sweden, who are also ranked highly in terms of gender equality (World Economic Forum, Citation2019), fail to find any effect of sex on FAS scores (Tallberg et al., Citation2008; Vogel et al., Citation2020).
While the Norwegian norms by Egeland et al. (Citation2006) adjusted for demographics in the independent SCD sample, mean T-scores were significantly lower compared to the proposed regression-based norms. These differences were especially prominent in younger participants with higher education (Mdiff = −4.4). According to Egeland et al. (Citation2006), individuals with more than 15 years of education were expected to produce 52 (SD = 11.2) words in total. However, participants in this education group in our SCD sample named 48.8 (SD = 9.2) words on average. Although the participants in Egeland et al. (Citation2006) are close to the SCD sample in terms of mean years of education, their sample included more people in the upper education strata (>15 years). Thus, the norms’ strictness could be a result of a larger amount of highly educated individuals in the upper education stratification in Egeland et al. (Citation2006). Regression-based norming procedures model the linear effect of education on performance for the entire sample and are therefore less vulnerable to the limitations caused by sample characteristics of sub-group stratifications in discrete norming procedures. This may explain why the Heaton et al. (Citation2004) derived T-scores, while not adequately adjusting for demographics, were similar to the proposed regression norms. This indicates that the raw-score distribution in the Heaton et al. (Citation2004) normative sample is likely similar to the healthy control sample and SCD sample in this study. However, due to the differences in demographic adjustment between Heaton et al. (Citation2004) and the proposed norms, differences in estimated mean T-scores were visible only when comparing groups split by education and age. Specifically, the Heaton et al. (Citation2004) derived mean T-scores were slightly lower in younger individuals (≤63 years) with low education (≤13) and slightly higher in older individuals (≥64 years) with high education (≥14 years). These differences are likely caused by overestimating the influence of age in the Norwegian sample while underestimating the influence of education.
Interestingly, both Heaton et al. (Citation2004) and the proposed norms produced mean T-scores about 0.5 SD above the expected mean normative score (i.e. T = 50) (). However, this trend toward overestimation of T-scores in highly educated older adults was not found in the normative sample which the norms were based on (data not shown). Thus, this result is likely caused by sample characteristics of the present SCD sample and is not an artifact of the regression norming procedure. As the participants in the SCD sample were screened for cognitive impairment prior to inclusion in this study, no participant in this group scored lower than 1.5 SD below the normative mean on the DDI neuropsychological battery (see methods). While there were no significant differences between the normative sample and the SCD sample, sub analyses show that the highly educated older adults in the SCD sample produce more words than highly educated older adults in the normative sample (data not shown). The highly educated older adults in the SCD sample might therefore represent a group of higher preforming individuals compared to the normative sample, leading to higher T-scores. Indeed, the generally stricter Egeland et al. (Citation2006) norms, developed with conventional discrete norming procedures, also showed proportionally higher T-scores in these highly educated and older individuals compared to other age and education strata (). However, as the Egeland et al. (Citation2006) norms are generally stricter, the increase in scores is less visible compared to the proposed norms and the Heaton et al. (Citation2004) norms.
The present study is subject to some limitations. The test instructions used in this study are similar, albeit not identical to the instructions used by Heaton et al. (Citation2004) or Egeland et al. (Citation2006). While the instructions used in Egeland et al. (Citation2006) are very similar to our instructions, they do not specify its origin. There are no additional constraints in our instructions compared to Heaton et al. (Citation2004), but the phrasing is slightly different. Thus, some of the variation between normative studies may have been influenced by subtle differences in the test instruction and administration. Another limitation in this study is the lack of semantic fluency norms. It would be preferable to present norms for both the FAS phonemic fluency test and the semantic fluency test, as they are often administered together. Unfortunately, we did not have any data available for the semantic fluency test. Thus, for a complete evaluation of patients’ verbal fluency abilities clinicians must combine the proposed norms with previously published semantic fluency norms. It is also important to note that the proposed norms are not superior to the American norms, but that norms developed for their target population (i.e. American or Norwegian) may capture pertinent language or cultural factors that impact test performance. It is therefore preferable to use local test norms when they are available.
While the exact clinical implications of the new norms have to be investigated further, the current results indicate that the proposed norms are better at estimating FAS performance in a Norwegian sample compared to American norms. To further evaluate the clinical value of the new norms, future research should focus on participants with impaired performance, e.g. patients with neurodegenerative disorders such as Alzheimer’s disease, and frontotemporal dementia. This would provide valuable insight into the sensitivity of the FAS phonemic fluency norms compared to the use of foreign norms. Nevertheless, the current study provides Norwegian clinicians and researchers with locally adapted test norms and contributes to increased precision in neuropsychological testing in Norway.
Conclusions
We here propose Norwegian regression-based norms for the FAS phonemic fluency test for ages 40 through 84 with an educational range of 8–23 years. While the discrete norms by Egeland et al. (Citation2006) adjust for pertinent demographic influences in an independent sample of cognitively healthy Norwegian adults, they were consistently stricter than the proposed regression-based norms. This strictness is likely caused by sample characteristics in the sub-group stratifications, a potential shortcoming associated with discrete norming procedures. The norms by Heaton et al. (Citation2004), while widely used both clinically and in research, do not accurately adjust for education in a Norwegian sample. The Heaton et al. (Citation2004) norms are not adapted for use in foreign language populations and should therefore be avoided when evaluating Norwegian patients.
Acknowledgments
We thank Svein Ivar Bekkelund, Kjell-Arne Arntzen, Kai Müller, Claus Albretsen, Mari Thoresen Løkholm, Ida Harviken, Line Saether, Erna Utnes, Marianne Wettergreen, Berglind Gisladottir, Marit Knapstad, Reidun Meling, Synnøve Bremer Skarpenes and Elin Margrethe Solli for clinical examinations and essential help with the project.
Disclosure statement
No potential conflict of interest was reported by the author(s).
Data availability statement
The research data are not publicly available due to patient privacy restrictions. Data that support the study’s findings are available on request from the corresponding author.
Correction Statement
This article has been corrected with minor changes. These changes do not impact the academic content of the article.
Additional information
Funding
References
- Albert, M. S., DeKosky, S. T., Dickson, D., Dubois, B., Feldman, H. H., Fox, N. C., Gamst, A., Holtzman, D. M., Jagust, W. J., Petersen, R. C., Snyder, P. J., Carrillo, M. C., Thies, B., & Phelps, C. H. (2011). The diagnosis of mild cognitive impairment due to Alzheimer’s disease: Recommendations from the National Institute on Aging-Alzheimer’s Association workgroups on diagnostic guidelines for Alzheimer's disease. Alzheimer's & Dementia, 7(3), 270–279. https://doi.org/10.1016/j.jalz.2011.03.008.
- Baldo, J. V., Schwartz, S., Wilkins, D., & Dronkers, N. F. (2006). Role of frontal versus temporal cortex in verbal fluency as revealed by voxel-based lesion symptom mapping. Journal of International Neuropsychological Society, 12(6), 896–900. https://doi.org/10.1017/s1355617706061078
- Barry, D., Bates, M. E., & Labouvie, E. (2008). FAS and CFL forms of verbal fluency differ in difficulty: A meta-analytic study. Applied Neuropsychology, 15(2), 97–106. https://doi.org/10.1080/09084280802083863
- Basso, A., Burgio, F., & Prandoni, P. (1997). Semantic category and initial letter word fluency in left-brain-damaged patients. European Journal of Neurology, 4(6), 544–550. https://doi.org/10.1111/j.1468-1331.1997.tb00404.x.
- Ben-David, B. M., Erel, H., Goy, H., & Schneider, B. A. (2015). “Older is always better”: Age-related differences in vocabulary scores across 16 years. Psychology and Aging, 30(4), 856–862. https://doi.org/10.1037/pag0000051
- Benton, A. L., & Hamsher, K. D. (1989). Multilingual aphasia examination. AJA Associates.
- Berkowitz, L., & Donnerstein, E. (1982). External validity is more than skin deep: Some answers to criticisms of laboratory experiments. American Psychologist, 37(3), 245–247. https://doi.org/10.1037/0003-066X.37.3.245.
- Bolla, K. I., Lindgren, K. N., Bonaccorsy, C., & Bleecker, M. L. (1990). Predictors of verbal fluency (FAS) in the healthy elderly. Journal of Clinical Psychology, 46(5), 623–628. https://doi.org/10.1002/1097-4679(199009)46:5<623::Aid-jclp2270460513>3.0.Co;2-c
- Borkowski, J. G., Benton, A. L., & Spreen, O. (1967). Word fluency and brain damage. Neuropsychologia, 5(2), 135–140. https://doi.org/10.1016/0028-3932(67)90015-2.
- Cavaco, S., Gonçalves, A., Pinto, C., Almeida, E., Gomes, F., Moreira, I., Fernandes, J., & Teixeira-Pinto, A. (2013). Semantic fluency and phonemic fluency: regression-based norms for the Portuguese population. Archives of Clinical Neuropsychology, 28 (3), 262–271. https://doi.org/10.1093/arclin/act001
- Dadgar, H., Khatoonabadi, A. R., & Bakhtiyari, J. (2013). Verbal fluency performance in patients with non-demented Parkinson's Disease. Iranian Journal of Psychiatry, 8(1), 55–58.
- Duff, K., & Ramezani, A. (2015). Regression-based normative formulae for the repeatable battery for the assessment of neuropsychological status for older adults. Archives of Clinical Neuropsychology, 30(7), 600–604. https://doi.org/10.1093/arclin/acv052
- Egeland, J., Landrø, N. I., Tjemsland, E., & Walbaekken, K. (2006). Norwegian norms and factor-Structure of phonemic and semantic word list generation. The Clinical Neuropsychologist, 20(4), 716–728. https://doi.org/10.1080/13854040500351008
- Elgamal, S. A., Roy, E. A., & Sharratt, M. T. (2011). Age and verbal fluency: The mediating effect of speed of processing. Canadian Geriatrics Journal, 14(3), 66–72. https://doi.org/10.5770/cgj.v14i3.17
- Espenes, J., Hessen, E., Eliassen, I. V., Waterloo, K., Eckerström, M., Sando, S. B., Timón, S., Wallin, A., Fladby, T., Kirsebom, B.-E. (2020). Demographically adjusted trail making test norms in a Scandinavian sample from 41 to 84 years. The Clinical Neuropsychologist, 34: sup1, 1–17. https://doi.org/10.1080/13854046.2020.1829068
- Fillenbaum, G. G., van Belle, G., Morris, J. C., Mohs, R. C., Mirra, S. S., Davis, P. C., Tariot, P. N., Silverman, J. M., Clark C. M., Welsh-Bohmer, K. A., Heyman, A. (2008). Consortium to Establish a Registry for Alzheimer's Disease (CERAD): the first twenty years. Alzheimers Dement, 4(2), 96–109. https://doi.org/10.1016/j.jalz.2007.08.005
- Fladby, T., Pålhaugen, L., Selnes, P., Waterloo, K., Bråthen, G., Hessen, E., Almdahl, I. S., Arntzen, K.-A., Auning, E., Eliassen, C. F., Espenes, R., Grambaite, R., Grøntvedt, G. R., Johansen, K. K., Johnsen, S. H., Kalheim, L. F., Kirsebom, B.-E., Müller, K. I., Nakling, A. E., … Aarsland, D. (2017). Detecting at-risk Alzheimer's disease cases. Journal of Alzheimer's Disease, 60(1), 97–105. https://doi.org/10.3233/JAD-170231
- Ghasemian-Shirvan, E., Molavi Shirazi, S., Aminikhoo, M., Zareaan, M., & Ekhtiari, H. (2018). Preliminary normative data of Persian phonemic and Semantic Verbal Fluency Test. Iranian Journal of Psychiatry, 13(4), 288–295.
- Gladsjo, J. A., Schuman, C. C., Evans, J. D., Peavy, G. M., Miller, S. W., & Heaton, R. K. (1999). Norms for letter and category fluency: Demographic corrections for age, education, and ethnicity. Assessment, 6(2), 147–178. https://doi.org/10.1177/107319119900600204
- World Economic Forum (2019). Global Gender Gap Report 2020, Geneve, Switzerland, retrieved from: https://www.weforum.org/reports/global-gender-gap-report-2020
- Heaton, R., Miller, S. W., Taylor, M. J., & Grant, I. (2004). Revised comprehensive norms for an expanded Halstead-Reitan Battery: Demographically adjusted neuropsychological norms for African American and Caucasian adults. Psychological Assessment Resources.
- Henry, J. D., & Crawford, J. R. (2004). A meta-analytic review of verbal fluency performance in patients with traumatic brain injury. Neuropsychology, 18(4), 621–628. https://doi.org/10.1037/0894-4105.18.4.621.]
- Jessen, F., Amariglio, R. E., van Boxtel, M., Breteler, M., Ceccaldi, M., Chételat, G., Dubois, B., Dufouil, C., Ellis, K. A., van der Flier, W. M., Glodzik, L., van Harten, A. C., de Leon, M. J., McHugh, P., Mielke, M. M., Molinuevo, J. L., Mosconi, L., Osorio, R. S., Perrotin, A., … Wagner, M., Subjective Cognitive Decline Initiative (SCD-I) Working Group (2014). … Subjective Cognitive Decline Initiative Working, G. (2014). A conceptual framework for research on subjective cognitive decline in preclinical Alzheimer's disease. Alzheimer's & Dementia, 10(6), 844–852. https://doi.org/10.1016/j.jalz.2014.01.001
- Kilgarriff, A., Charalabopoulou, F., Gavrilidou, M., Johannessen, J. B., Khalil, S., Johansson Kokkinakis, S., Lew, R., Sharoff, S., Vadlapudi, R., & Volodina, E. (2014). Corpus-based vocabulary lists for language learners for nine languages. Language Resources and Evaluation, 48(1), 121–163. https://doi.org/10.1007/s10579-013-9251-2
- Kirsebom, B.-E., Espenes, R., Hessen, E., Waterloo, K., Johnsen, S. H., Gundersen, E., Botne Sando, S., Rolfseng Grøntvedt, G., Timón, S., & Fladby, T. (2019). Demographically adjusted CERAD wordlist test norms in a Norwegian sample from 40 to 80 years. The Clinical Neuropsychologist, 33(sup1), 27–39. https://doi.org/10.1080/13854046.2019.1574902
- Kosmidis, M. H., Vlahou, C. H., Panagiotaki, P., & Kiosseoglou, G. (2004). The verbal fluency task in the Greek population: Normative data, and clustering and switching strategies. Journal of the International Neuropsychological Society, 10(2), 164–172. https://doi.org/10.1017/S1355617704102014
- Lannoo, E., & Vingerhoets, G. (1997). Flemish normative data on common neuropsychological tests: Influence of age, education, and gender. Psychologica Belgica, 37(3), 141–155. https://doi.org/10.5334/pb.913.
- Lezak, M. D., Howieson, D. B., Bigler, E. D., & Tranel, D. (2012). Neuropsychological Asessement (5th ed.). Oxford University Press.
- Loonstra, A. S., Tarlow, A. R., & Sellers, A. H. (2001). COWAT metanorms across age, education, and gender. Applied Neuropsychology, 8(3), 161–166. https://doi.org/10.1207/s15324826an0803_5
- Machado, T. H., Fichman, H. C., Santos, E. L., Carvalho, V. A., Fialho, P. P., Koenig, A. M., Fernandes, C. S., Lourenço, R. A., Paradela, E. M. d P., & Caramelli, P. (2009). Normative data for healthy elderly on the phonemic verbal fluency task – FAS. Dementia & Neuropsychologia, 3(1), 55–60. https://doi.org/10.1590/S1980-57642009DN30100011
- Nutter-Upham, K. E., Saykin, A. J., Rabin, L. A., Roth, R. M., Wishart, H. A., Pare, N., & Flashman, L. A. (2008). Verbal fluency performance in amnestic MCI and older adults with cognitive complaints. Archives of Clinical Neuropsychology, 23(3), 229–241. https://doi.org/10.1016/j.acn.2008.01.005
- Olabarrieta-Landa, L., Rivera, D., Galarza-del-Angel, J., Garza, M. T., Saracho, C. P., Rodríguez, W., Chávez-Oliveros, M., Rábago, B., Leibach, G., Schebela, S., Martínez, C., Luna, M., Longoni, M., Ocampo-Barba, N., Rodríguez, G., Aliaga, A., Esenarro, L., García de la Cadena, C., Perrin, B. P., & Arango-Lasprilla, J. C. (2015). Verbal fluency tests: Normative data for the Latin American Spanish speaking adult population. NeuroRehabilitation, 37(4), 515–561. https://doi.org/10.3233/nre-151279
- Oosterhuis, H. E. M., van der Ark, L. A., & Sijtsma, K. (2016). Sample size requirements for traditional and regression-based norms. Assessment, 23(2), 191–202. https://doi.org/10.1177/1073191115580638
- Perri, R., Koch, G., Carlesimo, G. A., Serra, L., Fadda, L., Pasqualetti, P., Pettenati, C., & Caltagirone, C. (2005). Alzheimer's disease and frontal variant of frontotemporal dementia– a very brief battery for cognitive and behavioural distinction. Journal of Neurology, 252(10), 1238–1244. https://doi.org/10.1007/s00415-005-0849-1
- Reitan, R. M., & Wolfson, D. (1985). The Halstead-Reitan Neuropsychological Test Battery. Neuropsychology Press.
- Robinson, G., Shallice, T., Bozzali, M., & Cipolotti, L. (2012). The differing roles of the frontal cortex in fluency tests. Brain, 135(7), 2202–2214. https://doi.org/10.1093/brain/aws142
- Rodríguez-Lorenzana, A., Benito-Sánchez, I., Adana-Díaz, L., Paz, C. P., Yacelga Ponce, T., Rivera, D., & Arango-Lasprilla, J. C. (2020). Normative data for test of verbal fluency and naming on Ecuadorian adult population. Frontiers in Psychology, 11, 830. https://doi.org/10.3389/fpsyg.2020.00830
- Salthouse, T. A. (1996). The processing-speed theory of adult age differences in cognition. Psychological Review, 103(3), 403–428. https://doi.org/10.1037/0033-295x.103.3.403
- Spreen, O., & Benton, A. L. (1969). Neurosensory center comprehensive examination for aphasia: Manual of instructions (NECCEA). Victoria.
- Steenhuis, R. E., & Ostbye, T. (1995). Neuropsychological test performance of specific diagnostic groups in the Canadian Study of Health and Aging (CSHA). Journal of Clinical and Experimental Neuropsychology, 17(5), 773–785. https://doi.org/10.1080/01688639508405166
- St-Hilaire, A., Hudon, C., Vallet, G. T., Bherer, L., Lussier, M., Gagnon, J.-F., Simard, M., Gosselin, N., Escudier, F., Rouleau, I., & Macoir, J. (2016). Normative data for phonemic and semantic verbal fluency test in the adult French–Quebec population and validation study in Alzheimer’s disease and depression. The Clinical Neuropsychologist, 30(7), 1126–1150. https://doi.org/10.1080/13854046.2016.1195014
- Tallberg, I. M., Ivachova, E., Jones Tinghag, K., & Östberg, P. (2008). Swedish norms for word fluency tests: FAS, animals and verbs. Scandinavian Journal of Psychology, 49(5), 479–485. https://doi.org/10.1111/j.1467-9450.2008.00653.x
- Testa, S. M., Winicki, J. M., Pearlson, G. D., Gordon, B., & Schretlen, D. J. (2009). Accounting for estimated IQ in neuropsychological test performance with regression-based techniques. Journal of the International Neuropsychological Society, 15(6), 1012–1022. https://doi.org/10.1017/S1355617709990713
- Tombaugh, T. N., Kozak, J., & Rees, L. (1999). Normative data stratified by age and education for two measures of verbal fluency: FAS and animal naming. Archives of Clinical Neuropsychology, 14, 167–177. https://doi.org/10.1093/arclin/14.2.167
- Tuokko, H., Kristjansson, E., & Miller, J. (1995). Neuropsychological detection of dementia: an overview of the neuropsychological component of the Canadian Study of Health and Aging. Journal of Clinical and Experimental Neuropsychology, 17(3), 352–373. https://doi.org/10.1080/01688639508405129
- Van den Heuvel, D. M., Ten Dam, V. H., De Craen, A. J., Admiraal-Behloul, F., Olofsen, H., Bollen, E. L., … Van Buchem, M. A. (2006). Increase in periventricular white matter hyperintensities parallels decline in mental processing speed in a non-demented elderly population. Journal of Neurology, Neurosurgery & Psychiatry, 77(2), 149–153. https://doi.org/10.1136/jnnp.2005.070193
- Van der Elst, W., Boxtel, M., Breukelen, G., & Jolles, J. (2006). The Concept Shifting Test: Adult normative data. Psychological Assessment, 18(4), 424–432. https://doi.org/10.1037/1040-3590.18.4.424
- Verhaeghen, P. (2003). Aging and vocabulary score: A meta-analysis. Psychology and Aging, 18(2), 332–339. https://doi.org/10.1037/0882-7974.18.2.332
- Vicente, S. G., Benito-Sánchez, I., Barbosa, F., Gaspar, N., Dores, A. R., Rivera, D., & Arango-Lasprilla, J. C. (2021). Normative data for Verbal Fluency and Object Naming Tests in a sample of European Portuguese adult population. Applied Neuropsychology: Adult, 1–12. https://doi.org/10.1080/23279095.2020.1868472
- Vogel, A., Stokholm, J., & Jørgensen, K. (2020). Normative data for eight verbal fluency measures in older Danish adults. Neuropsychology, Development, and Cognition. Section B, Aging, Neuropsychology, and Cognition, 27(1), 114–124. https://doi.org/10.1080/13825585.2019.1593935
- Warrington, E., & James, M. (1991). A new test of object decision: 2D silhouettes featuring a minimal view. Cortex, 27(3), 377–383. https://doi.org/10.1016/S0010-9452(13)80033-0