
 ?Mathematical formulae have been encoded as MathML and are displayed in this HTML version using MathJax in order to improve their display. Uncheck the box to turn MathJax off. This feature requires Javascript. Click on a formula to zoom.
Abstract
The Sensory Gating Inventory (SGI) is an established self-report questionnaire that is used to assess the capacity for filtering redundant or irrelevant environmental stimuli. Translation and cross-cultural validation of the SGI are necessary to make this tool available to Dutch speaking populations. This study, therefore, aimed to design and validate a Dutch Sensory Gating Inventory (D-SGI). To this end, a forward-backward translation was performed and 469 native Dutch speakers filled in the questionnaire. A confirmatory factor analysis assessed the psychometric properties of the D-SGI. Additionally, test-retest reliability was measured. Results confirmed satisfactory similarity between the original English SGI and the D-SGI in terms of psychometric properties for the factor structure. Internal consistency and discriminant validity were also satisfactory. Overall test-retest reliability was excellent (ICC = 0.91, p < 0.001, 95% CI [0.87–0.93]). These findings confirm that the D-SGI is a psychometrically sound self-report measure that allows assessing the phenomenological dimensions of sensory gating in Dutch. Moreover, the D-SGI is publicly available. This establishes the D-SGI as a new tool for the assessment of sensory gating dimensions in general- and clinical Dutch speaking populations.
Introduction
To function efficiently in everyday life, identification and filtering of irrelevant sensory information are essential. The “gating out” of sensory information that is categorized as irrelevant is thought to counteract hypersensitivity or potential sensory inundation of higher order cognitive processes (Braff & Geyer, Citation1990). This is necessary to guide attention, helping to focus on and to follow particular aspects of the sensory environment (e.g., auditory rather than visual input), which can be influenced by fatigue (Hetrick et al., Citation2012). The neurocognitive mechanism underlying this capacity has been described as “sensory gating” (SG) (Adler et al., Citation1982; Venables, Citation1964). SG refers to the ability to adaptively process changing stimulus features (i.e., gating in) and inhibit repetitive stimulus features (i.e., gating out) (Venables, Citation1964). Accordingly, the most basic example of phenomenological SG is a reduced response to a repeated stimulus.
SG has been assessed by means of behavioral and neurophysiological measures (Micoulaud-Franchi et al., Citation2015; Citation2019). Initial research investigating SG relied on interviews, self-report measures or EEG recordings performed in persons with schizophrenia (Adler et al., Citation1982; Bunney et al., Citation1999). However, the first systematic attempt to quantify SG was the Structured Interview for Assessing Perceptual Anomalies (SIAPA) that was developed based on extensive interviews with schizophrenia patients (Bunney et al., Citation1999). Scored on a 5-point Likert scale, the SIAPA comprises fifteen items divided into auditory, visual, tactile, olfactory and gustatory domains, with three questions on hypersensitivity, inundation\flooding, and selective attention per domain. The Sensory Gating Inventory (SGI) then established a related self-report measure (Hetrick et al., Citation2012). It combined first person quotes by McGhie and Chapman, items from the SIAPA, selected questions from the Perceptual Aberration Scale (PAS), and new items (Hetrick et al., Citation2012; McGhie & Chapman, Citation1961). These initial 124 items were reviewed and scored on a 6-point Likert scale by university students (Hetrick et al., Citation2012). After principal factor analysis, various items were discarded and the questionnaire was further refined until 36 items remained and were subsequently validated (Hetrick et al., Citation2012). The final version of the SGI consists of 36 items, spread over four dimensions of perceptual anomalies: Perception Modulation (PM, 16 items), Over-Inclusion (OI, 7 items), Distractibility (D, 8 items) and Fatigue-Stress modulation (FS, 5 items). High SGI scores suggest impaired SG.
Paired tone paradigms are another widely applied experimental method to assess SG. Typically, participants show a suppressed neurophysiological response to the 2nd tone of a tone pair containing identical spectral information. This is, for example, different in persons with schizophrenia, who did not show the typical response suppression (Adler et al., Citation1982). For tactile paired-pulse stimulation, reduced SG has also been observed in healthy aging for a late middle latency neurophysiological response at frontal sites, while suppression for an earlier middle latency neurophysiological response was intact (Terrasa et al., Citation2018). In pathological aging, however, impaired SG and thus reduced neurophysiological suppression was observed in patients with Alzheimer’s (Thomas et al., Citation2010). Moreover and similar to healthy aging, young adults with autism spectrum disorder exhibited impaired SG for a late middle latency neurophysiological response, while there was no group difference for earlier neurophysiological SG (Chien et al., Citation2019). Lastly, for adults with attention-deficit hyperactivity disorder (ADHD), reduced response suppression was observed in combination with higher SGI scores, indicating impaired neurophysiological and behavioral SG (Micoulaud-Franchi et al., Citation2015). The findings by Micoulaud-Franchi et al. (Citation2015) suggest that the self-report measure parallels the neurophysiological findings.
The SGI has further been proposed as a diagnostic tool for ADHD (Sable et al., Citation2012). With the SGI-Brief, there is also a shortened version of the SGI that only contains ten items (Bailey et al., Citation2021). Another short version of the SGI has been implemented for adults with ADHD (Micoulaud-Franchi et al., Citation2017). Reflecting on the diagnostic capacity of these tools, the SGI has already been successfully validated in French, Persian, and Japanese (Micoulaud-Franchi et al., Citation2014; Mohebbi et al., Citation2019; Nobuyoshi et al., Citation2018). This wide application of the SGI across different pathologies makes an adaptation to further contexts valuable. A validated translation to Dutch is so far still lacking. The goals of this study were therefore to translate and subsequently validate a Dutch version of the SGI (D-SGI). Within the adapted approach, we expected to validate the SGI in its Dutch form and to find good test-retest reliability measures.
Methods
The ethical committee of Maastricht University approved the research project (ERCPN-OZL_233_06_02_2021_A1).
Transparency and openness
To foster reproducibility, the study data, the translated questionnaire (D-SGI) and the code to analyze the data are provided online and openly accessible (https://doi.org/10.34894/PT7SIX). This study was not pre-registered and we report all data exclusions or manipulations in the study.
Participants
Participants were recruited by word of mouth, flyers, and via online platforms. 703 responses were registered via an online platform, from which 469 responses were included in the data analysis. Some responses were excluded. This was due to spam (16), no consent to participate (33), failure to finish the questionnaire (149), incorrect reply to control questions (1), being a non-native Dutch speaker (8), and failure to start the questionnaire (27). The participants (Mage = 29 y, SDage = 11.7 y) were recruited from the general population and consisted of 120 males (25.6%), 348 females (74.2%) and 1 intersex (0.2%). Of the 469 responses, only 31 cases self-reported ADHD/ADD (8), ADHD/ADD with autism spectrum disorder (2), autism spectrum disorder (2), dyslexia (12), hearing loss (3), hearing loss and tinnitus (1), tinnitus (2), brain damage (1), thus no condition was systematically over-represented in the current sample.
Procedure
At the beginning of the online questionnaire (Qualtrics, Citation2020), participants were asked to provide their consent with the study protocol. They were then informed that they could stop at any point and that their responses would be treated anonymously. Inclusion criteria were that participants were native Dutch speakers and between 18–65 years old. When completed, participants could indicate whether they wanted to participate in the retest as well.
Material and translation of the questionnaire
The English SGI questionnaire consists of 36 self-report questions. The responses are scored using a 6-point Likert scale (0: “never true,” 1: “almost never,” 2 & 3: “sometimes true,” 4: “almost always,” 5: “always true”) (Hetrick et al., Citation2012). The four dimensions of the SGI assess (1) the perception of visual and sound stimuli (Perception Modulation or PM), (2) enhanced attention to details (Over-Inclusion or OI), (3) abilities to focus (Distractibility or D) and (4) the perception of light or sound when tired or stressed (Fatigue-Stress modulation or FS). After obtaining consent from the author of the original SGI (WPH), the questionnaire was translated into Dutch using a forward-backward procedure. First, two native Dutch speakers with high levels of English proficiency translated the English SGI. Then, a bilingual speaker of English and Dutch performed the backward translation. This backward translation was then sent to the original author and remaining inaccuracies and/or discrepancies were denoted and discussed with the team until a common agreement was found. The final translation in the order presented to the participants is provided in and the D-SGI here: https://doi.org/10.34894/PT7SIX.
Table 1. The English SGI items matched with their Dutch translations.
Analyses
All data processing and statistical analyses were performed in R (version 4.2.0) using Rstudio (version 2022.07.1). For the confirmatory factor analysis, the lavaan package (version 0.6–11) (Rosseel, Citation2012) was used, MVN: An R Package for Assessing Multivariate Normality (version 5.9) (Korkmaz et al., Citation2014) to assess multivariate normal distribution, Methods for the Behavioral, Educational, and Social Sciences (version 4.9.0) (i.e., MBESS) (Kelley et al., Citation2018) for ωcat and BCa, semTools: Useful Tools for Structural Equation Modeling (version 0.5–6) (Jorgensen et al., Citation2016) for the average variance extraction and irr: Various Coefficients of Interrater Reliability and Agreement (version 0.84.1) (Gamer et al., Citation2012) for the intraclass correlation coefficients. Lastly, semPlot: Path Diagrams and Visual Analysis of Various SEM Packages’ Output (version 1.1.6).
Confirmatory factor analysis (CFA)
Model specification
The model was specified based on the validated English SGI, containing the four latent factors Perception Modulation (PM, 16 items), Over-Inclusion (OI, 7 items), Distractibility (D, 8 items) and Fatigue-Stress Modulation (FS, 5 items). As in the English version, participants indicated their response on a 6-point Likert scale (0: “never true,” 1: “almost never,” 2 & 3: “sometimes true,” 4: “almost always,” 5: “always true”), with higher scores indicating dysfunctional SG. Furthermore, the second item for each factor was used as marker indicator and thus fixed to one. We chose the second item, because error variances for the second item were smaller. There were no correlated measurement errors for any pairs of indicators, hence resulting in an unsystematic measurement error. The four factors were permitted to correlate, and no cross-correlations were specified. The model is overidentified with 588 degrees of freedom df (df = 666–78) and goodness-of-fit evaluation applies.
Model estimation
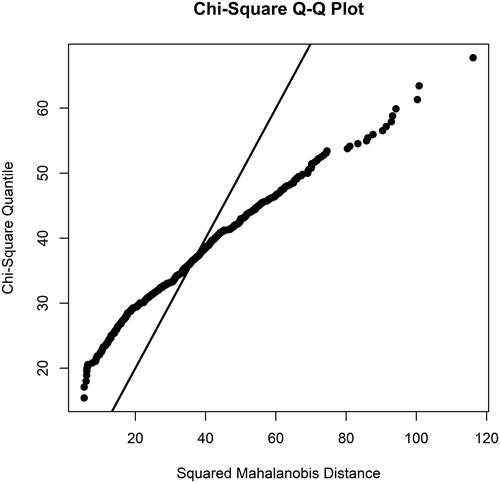
The most used factor estimation method is the maximum likelihood (ML) method. ML is based on two assumptions, (1) continuous indicators and (2) multivariate normal distribution of the variables (Brown & Moore, Citation2012). Regarding the first assumption, there is a debate whether or not 6-point Likert scales should be considered continuous or categorical (Joshi et al., Citation2015). Correspondingly, Likert scales can be either considered ordinal or summed up as interval estimates (Joshi et al., Citation2015). While Likert scales (i.e., containing several Likert items) may be analyzed as continuous data, Likert items should not be (Brown, Citation2011). Accordingly, we decided to treat the current data as categorical. For the second assumption, the Henze-Zirkler (Henze & Zirkler, Citation1990) and Mardia’s test (Mardia, Citation1970) for skewness and kurtosis were performed as previously recommended (Mecklin & Mundfrom, Citation2005). The Henze-Zirkler test (HZβ = 1.06, p < 0.001) and Mardia’s test (skewness: M1 = 15,623.81, p < 0.001); kurtosis: M2 = 57.97, p = < 0.001) both indicated a violation of the assumption of multivariate normality. Moreover, the Q-Q plot also depicted a non-normal multivariate distribution (). There are several model estimation functions for non-normally distributed categorical data, such as the unweighted least squares (ULS), diagonally weighted least squares (DWLS) or robust WLS (WLSMV) (Brown & Moore, Citation2012; Flora & Curran, Citation2004). For WLSMV, sample size requirements are more lenient. It has been shown that WLSMV produces accurate results with sample sizes varying from 100 to 1.000 with varying sample complexities (Flora & Curran, Citation2004). Therefore, we opted for the WLSMV function as the fitting function.
Figure 1. Chi-square Q-Q plot to assess multivariate normality for the D-SGI scores, suggesting deviations of multivariate normality.
Model evaluation
In the following, several goodness of fit measures are provided to give a comprehensive indication of the overall fit, considering that each index provides different information. For a good fit, the following guidelines were proposed by Hu and Bentler (Citation1999) and concern the standardized root mean square residual (SRMR) value (≤ 0.08), root mean square error of approximation (RMSEA) values (≤ 0.06, 90% CI ≤ 0.06), and comparative fit index (CFI) and Tucker-Lewis index (TLI) values (≥ 0.95). These recommended cutoff values may fluctuate based on the model. Localized areas of strain, or points of ill fit, were also assessed. Standardized expected parameter changes (SEPC) were inspected. The SEPC indicate how much a parameter is expected to change if it is freely estimated in another analysis (Whittaker, Citation2012). The bigger the SEPC, the higher the expected change and thus increased misspecification.
Internal consistency
One aspect of reliability, internal consistency, is frequently assessed with Cronbach’s Alpha (α). However, α assumes essential tau equivalence (i.e., true factor loadings are identical for all items, while error variances may vary), which is highly unlikely. Therefore, we report McDonald’s Categorical Omega (ωcat) (Dunn et al., Citation2014; Hayes & Coutts, Citation2020; McDonald, Citation1999; Raykov, Citation1998). ωcat is sensitive to violations of normality (Green & Yang, Citation2009), therefore we additionally employed the bias-corrected-and-accelerated bootstrap (BCa) method to correct the confidence interval (CI) for bias (Kelley & Pornprasertmanit, Citation2016). Values ≤ 0.80 indicate poor, between 0.80 and 0.89 adequate, between 0.90 and 0.95 good and ≥ 0.95 excellent internal consistency (Lance et al., Citation2006; Nunnally, Citation1978).
Discriminant validity and model comparisons
To assess whether the four different subscales measure distinct constructs, average variance extracted (AVE) was calculated. The AVE of each construct should be higher than the shared variance (i.e., squared interfactor correlation) between each pair of constructs (Farrell, Citation2010; Fornell & Larcker, Citation1981). Factor intercorrelations above 0.85 may imply poor discriminant validity (Brown & Moore, Citation2012; Cohen et al., Citation2003). The results of the four-factor solution were finally compared to a three-factor solution, which was based on findings from the discriminant validity analysis as well as to a unidimensional model.
Test-retest reliability
Participants who agreed to be contacted for the retest filled in the D-SGI again after 10–28 days (M = 14.99, SD = 2.38). 195 responses were registered; of which 29 responses were discarded due to missing email addresses (4), failure to start (19), repeated responses (2), and exceeding the 28 days limit (4). Accordingly, 166 responses entered the analysis. Intraclass correlation coefficients (ICC) and their 95% CI’s were used to evaluate test-retest reliability and the recommended cutoffs indicated poor (≤ 0.5), moderate (0.5–0.75), good (0.75–0.9) and excellent reliability (≥ 0.9) (Koo & Li, Citation2016). ICC calculation was based on a two-way mixed effects, single measurement, absolute agreement model (Koo & Li, Citation2016; Qin et al., Citation2019).
Results
Sample characteristics
The final sample consisted of 469 native Dutch speakers (Mage = 29, SD = 11.7). For the test-retest, the final sample consisted of 166 participants (Mage = 33.8, SD = 14.07). Global sum factors and sum scores per factor were computed. provides descriptive statistics of D-SGI items.
Table 2. Descriptive statistics of the D-SGI items.
Confirmatory factor analysis (CFA) and model comparisons
The majority goodness-of-fit indices suggested that the four-factor model fitted the data well: (robust) χ2 (588) = 3,041.4, p < 0.001, SRMR = 0.078, TLI = 0.980 and CFI = 0.981. Only the robust RMSEA = 0.094, 90% CI = 0.091–0.098) was higher than the cutoff value, thus suggesting poor model fit (). Standardized factor loadings ranged between 0.621–0.815 (Perception Modulation), 0.631–0.937 (Over-Inclusion), 0.823–0.908 (Distractibility) and 0.541–0.885 (Fatigue-Stress modulation). The Supplementary Material (see https://doi.org/10.34894/PT7SIX) provides unstandardized and standardized parameter estimates in addition to the standardized covariances and variances of the factors. The localized areas of ill fit were D1, D2 and D8 as summarized in . When comparing the four-factor model with a unidimensional or three-factor model, the overall fit indices indicated that the four-factor model describes the data most accurately (). The standardized parameter estimates are depicted in .
Figure 2. Standardized CFA model for the D-SGI. Perception Modulation (PM), Distractibility (D), Over-Inclusion (OI), Fatigue-Stress modulation (FS).
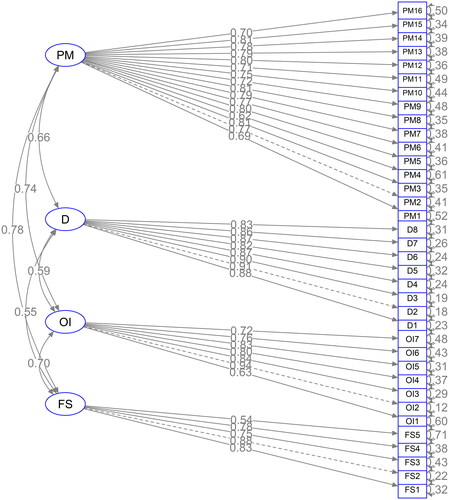
Table 3. Goodness-of-fit indices for the D-SGI.
Table 4. Excerpt of localized areas of ill fit.
Internal consistency
McDonalds categorical omega (ωcat) with 1.000 bootstrapping simulations of the 95% CI (see Kelley and Pornprasertmanit (Citation2016)) indicated excellent internal consistency for the Perception Modulation (ωcat = 0.97, 95% CI [0.97–0.96]) and Distractibility (ωcat = 0.98, 95% CI [0.99–0.96]) subscales. Good internal consistency was established for the Over-Inclusion subscale (ωcat = 0.92, 95% CI [0.94–0.90]), while for the Fatigue-Stress modulation subscale adequate internal consistency values were obtained (ωcat = 0.87, 95% CI [0.89–0.84]).
Discriminant validity
To assess the discriminant validity, the AVE was compared with the shared variance. Overall, the AVE was higher than the shared variance for the distractibility and over-inclusion subscales, indicating satisfactory discriminant validity (interactor correlations, shared variance and AVE values are provided in ). However, the AVE for the Perception Modulation subscale was smaller than the shared variance between Fatigue-Stress modulation and Perception Modulation. The AVE for the Fatigue-Stress modulation subscale was also smaller than the shared variance, suggesting poor discriminant validity. However, all interfactor correlations were below 0.85, suggesting good discriminant validity between all factors.
Table 5. Discriminant validity of the D-SGI.
Test-retest reliability
The intraclass correlation coefficient assessing the test-retest validity suggested excellent values for the overall SGI score (ICC = 0.91, p < 0.001, 95% CI [0.87–0.93]). The scores from the Perception Modulation subscale indicated good test-retest reliability (ICC = 0.85, p < 0.001, 95% CI [0.77–0.89]), for the Distractibility subscale excellent (ICC = 0.90, p < 0.001, 95% CI [0.90–0.92]), for the Over-Inclusion subscale good (ICC = 0.84, p < 0.001, 95% CI [0.79–0.82]) and lastly for the Fatigue-Stress modulation subscale good (ICC = 0.85, p < 0.001, 95% CI [0.81–0.89]) test-retest reliability.
Discussion
The aims of the current study were to translate the SGI into Dutch and validate the Dutch version in order to allow health practitioners to assess speakers of Dutch. The obtained results support the structural validation of the translated version of the SGI in the general Dutch population.
The psychometric properties were satisfactory, confirming the domains of sensory gating as first described by Hetrick et al. (Citation2012) and previously cross-culturally validated by Mohebbi et al. (Citation2019) or Micoulaud-Franchi et al. (Citation2014). Internal consistency was overall acceptable and ranged from excellent to adequate, indicating overall good reliability of the four dimensions. Consistent with the original SGI, as well as with the French and the Persian versions, the Fatigue-Stress modulation subscale was the dimension with the lowest reliability, possibly, because it only encompasses five items (Hetrick et al., Citation2012; Micoulaud-Franchi et al., Citation2014; Mohebbi et al., Citation2019). In general, it has been recommended to have more (relevant) indicators than fewer per factor (MacCallum et al., Citation1999) and a minimum of three items per factor (Brown & Moore, Citation2012). Moreover, the error variance for one item (FS5, “When I am driving at night, I am bothered by the bright lights of oncoming traffic.”) was particularly high (i.e., 0.71, ), suggesting that this item might measure something more than just the Fatigue-Stress modulation domain. This specific item (FS5) was also found to be problematic in the French version of the SGI (Micoulaud-Franchi et al., Citation2014). To increase the internal consistency of the FS subscale in the future, item FS5 should therefore be rephrased to reduce cross loading.
Other localized areas of strain were mostly related to the distractibility domain. Items D1 (“At times I have trouble focusing because I am easily distracted.”) and D2 (“I am easily distracted.”) were highly correlated. One of these items could therefore be removed from the questionnaire as both measure nearly identical aspects of distractibility. Moreover, D8 (“When I am in a group of people I have trouble listening to one person.”) is measured by multiple domains (e.g., PM and FS, see ). Thus, we suggest rephrasing D8 in future studies.
The reported goodness of fit parameters (i.e., SRMR, CFI, TLI) were unscaled (see Results section), as there is no theoretical justification to use the scaled fit indices (Brosseau-Liard et al., Citation2012; Brosseau-Liard & Savalei, Citation2014; Xia & Yang, Citation2019). For the sake of completeness, both scaled and unscaled estimates are presented in the Supplementary Material (see https://doi.org/10.34894/PT7SIX).
The discriminant validity, assessed by the AVE, was acceptable for the subscales of the D-SGI except for the shared variance between Perception Modulation and Fatigue-Stress modulation. This may indicate a considerable amount of overlap between the two constructs. Therefore, we compared the four-factor model to the most simple unidimensional model and to a three factor model, where we collapsed the Perception Modulation and the Fatigue-Stress modulation subscales, as the Fatigue-Stress modulation subscale had the lowest internal consistency and discriminant validity. The results confirm that the four-factor solution fits our data best (see ). In order to address this inconsistency in the model, we suggest to adapt the Fatigue-Stress modulation subscale and to subsequently reexamine the validity to assess if the discriminant validity improved.
The test-retest validity of the D-SGI was good to excellent for all subscales. This finding is consistent by the test-retest reliability measures of Hetrick et al. (Citation2012) and Mohebbi et al. (Citation2019). In the French validation, test-retest validity was not assessed (Micoulaud-Franchi et al., Citation2014). It is recommended that reliability coefficients (i.e., ICC) should exceed 0.80 (Polit, Citation2014), which was the case for all subscales of the D-SGI.
Nevertheless, the current study has some limitations. As the goal was to validate a questionnaire that has already been validated in other languages, it would have been beneficial to adopt and compare the specific methods of the previous validations to replicate and compare the results. However, in the previous studies, the specific estimation methods were undisclosed, except in the French SGI validation. The fitting function adopted in the current study was WLSMV. However, one could argue about this choice. WLSMV estimates the diagonal weight matrix using robust standard errors and a mean- and variance adjusted chi-square statistic (Brown & Moore, Citation2012; Muthén & Muthén, Citation1998). Unweighted least squares might also be appropriate and some argue that the robust ML-probit might have comparable power to WLSMV (Suh, Citation2015). We chose WLSMV because our sample was non-normally distributed and the factor indicators were categorical, as suggested by Brown and Moore (Citation2012). Moreover, the current sample size was moderate (i.e., < 500), and it has previously been shown that small to moderate sample sizes produce adequate test statistics using WLSMV (Flora & Curran, Citation2004). In addition, due to the small sample size in the test-retest, it was not possible to perform analyses on measurement invariance. Furthermore, the sampling method could be criticized. We provided the link to the online questionnaire publicly and shared it as widely as possible by contacting different institutions and colleagues and we were able to reach beyond the typical student population, which provides a more realistic picture of the general population. However, we did not obtain more detailed information about cognitive levels of the participants, such as IQ or years of education. We also did not obtain information on bilingualism or multilingualism in native Dutch speakers. Finally, the order of the items presented in this study was grouped, deviating from the order used by Hetrick et al. (Citation2012), Micoulaud-Franchi et al. (Citation2014) and Mohebbi et al. (Citation2019). This might have influenced the factor structure and might also explain our increased internal consistency values. However, previous research did not find evidence for differences in scale reliability or validity when items were grouped versus randomized (Schriesheim et al., Citation1989; Sparfeldt et al., Citation2006). Accordingly, we expect that this limitation did not heavily influence the current results.
Conclusions
In conclusion, the Dutch version of the SGI (D-SGI) proved to be a psychometrically satisfactory self-report measure for the assessment of phenomenological dimensions of SG. Moreover, test-retest reliability ranged from good to excellent. The D-SGI thus provides additional means to enhance understanding of SG in the general- and clinical Dutch speaking population. The SGI is a widely applied tool, which can now be used to create a SG profile of a wide variety of different pathologies, similarly to the English version. Although the SGI has originally been designed to investigate SG in schizophrenia, its implications benefit conditions such as ADHD or tinnitus. Linking the results of the SGI to neurophysiological data might increase understanding of SG across multiple modalities.
Authors’ contributions
Pia Brinkmann: Conceptualization, Methodology, Formal analysis, Writing - Original Draft, Supervision Marit Stolte: Methodology, Formal analysis, Investigation, Writing - Review & Editing Jana Devos: Conceptualization, Methodology, Writing - Review & Editing, Supervision Marcus Janssen: Writing - Review & Editing, Supervision Michael Schwartze: Writing - Review & Editing, Supervision Sonja Kotz: Writing - Review & Editing, Supervision. Conceptualization.
Consent for publication
No identifying information from participants is included.
Acknowledgments
We thank Nina Fliescher for her work and assistance with initial data collection.
Disclosure statement
The authors report there are no competing interests to declare.
Data availability Statement
The data and materials for all experiments are available at https://doi.org/10.34894/PT7SIX, and the experiment was not pre-registered.
Additional information
Funding
References
- Adler, L. E., Pachtman, E., Franks, R. D., Pecevich, M., Waldo, M. C., & Freedman, R. (1982). Neurophysiological evidence for a defect in neuronal mechanisms involved in sensory gating in schizophrenia. Biological Psychiatry, 17(6), 639–654. https://psycnet.apa.org/record/1983-01116-001
- Bailey, A. J., Moussa-Tooks, A. B., Klein, S. D., Sponheim, S. R., & Hetrick, W. P. (2021). The sensory gating inventory-brief. Schizophrenia Bulletin Open, 2(1), sgab019. https://doi.org/10.1093/schizbullopen/sgab019
- Braff, D. L., & Geyer, M. A. (1990). Sensorimotor gating and schizophrenia: human and animal model studies. Archives of General Psychiatry, 47(2), 181–188. https://doi.org/10.1001/archpsyc.1990.01810140081011
- Brosseau-Liard, P. E., & Savalei, V. (2014). Adjusting incremental fit indices for nonnormality. Multivariate Behavioral Research, 49(5), 460–470. https://doi.org/10.1080/00273171.2014.933697
- Brosseau-Liard, P. E., Savalei, V., & Li, L. (2012). An investigation of the sample performance of two nonnormality corrections for RMSEA. Multivariate Behavioral Research, 47(6), 904–930. https://doi.org/10.1080/00273171.2012.715252
- Brown, J. D. (2011). Likert items and scales of measurement. Statistics, 15(1), 10–14.
- Brown, T. A., & Moore, M. T. (2012). Confirmatory factor analysis. Handbook of Structural Equation Modeling, 361, 379.
- Bunney, W. E., Jr., Hetrick, W. P., Bunney, B. G., Patterson, J. V., Jin, Y., Potkin, S. G., & Sandman, C. A. (1999). Structured interview for assessing perceptual anomalies (SIAPA). Schizophrenia Bulletin, 25(3), 577–592. https://doi.org/10.1093/oxfordjournals.schbul.a033402
- Chien, Y.-L., Hsieh, M. H., & Gau, S. S.-F. (2019). P50-N100-P200 sensory gating deficits in adolescents and young adults with autism spectrum disorders. Progress in Neuro-Psychopharmacology & Biological Psychiatry, 95, 109683. https://doi.org/10.1016/j.pnpbp.2019.109683
- Cohen, J., Cohen, P., West, S., & Aiken, L. (2002). Applied multiple regression/correlation analysis for the behavioral sciences (3rd ed.). Routledge. https://doi.org/10.4324/9780203774441
- Dunn, T. J., Baguley, T., & Brunsden, V. (2014). From alpha to omega: A practical solution to the pervasive problem of internal consistency estimation. British Journal of Psychology (London, England: 1953), 105(3), 399–412. https://doi.org/10.1111/bjop.12046
- Farrell, A. M. (2010). Insufficient discriminant validity: A comment on Bove, Pervan, Beatty, and Shiu (2009). Journal of Business Research, 63(3), 324–327. https://doi.org/10.1016/j.jbusres.2009.05.003
- Flora, D. B., & Curran, P. J. (2004). An empirical evaluation of alternative methods of estimation for confirmatory factor analysis with ordinal data. Psychological Methods, 9(4), 466–491. https://doi.org/10.1037/1082-989X.9.4.466
- Fornell, C., & Larcker, D. F. (1981). Evaluating structural equation models with unobservable variables and measurement error. Journal of Marketing Research, 18(1), 39–50. https://doi.org/10.1177/002224378101800104
- Gamer, M., Lemon, J., Gamer, M. M., Robinson, A., & Kendall’s, W. (2012). Package ‘irr. Various Coefficients of Interrater Reliability and Agreement, 22, 1–32.
- Green, S. B., & Yang, Y. (2009). Commentary on coefficient alpha: A cautionary tale. Psychometrika, 74(1), 121–135. https://doi.org/10.1007/s11336-008-9098-4
- Hayes, A. F., & Coutts, J. J. (2020). Use omega rather than Cronbach’s alpha for estimating reliability. But…. Communication Methods and Measures, 14(1), 1–24. https://doi.org/10.1080/19312458.2020.1718629
- Henze, N., & Zirkler, B. (1990). A class of invariant consistent tests for multivariate normality. Communications in Statistics - Theory and Methods, 19(10), 3595–3617. https://doi.org/10.1080/03610929008830400
- Hetrick, W. P., Erickson, M. A., & Smith, D. A. (2012). Phenomenological dimensions of sensory gating. Schizophrenia Bulletin, 38(1), 178–191. https://doi.org/10.1093/schbul/sbq054
- Hu, L. t., & Bentler, P. M. (1999). Cutoff criteria for fit indexes in covariance structure analysis: Conventional criteria versus new alternatives. Structural Equation Modeling, 6(1), 1–55. https://doi.org/10.1080/10705519909540118
- Jorgensen, T. D., Pornprasertmanit, S., Schoemann, A. M., Rosseel, Y., Miller, P., Quick, C., … Preacher, K. (2016). Package ‘semTools.
- Joshi, A., Kale, S., Chandel, S., & Pal, D. K. (2015). Likert scale: Explored and explained. British Journal of Applied Science & Technology, 7(4), 396–403. https://doi.org/10.9734/BJAST/2015/14975
- Kelley, K., Lai, K., Lai, M. K., & Suggests, M. (2018). Package ‘MBESS.
- Kelley, K., & Pornprasertmanit, S. (2016). Confidence intervals for population reliability coefficients: Evaluation of methods, recommendations, and software for composite measures. Psychological Methods, 21(1), 69–92. https://doi.org/10.1037/a0040086
- Koo, T. K., & Li, M. Y. (2016). A guideline of selecting and reporting intraclass correlation coefficients for reliability research. Journal of Chiropractic Medicine, 15(2), 155–163. https://doi.org/10.1016/j.jcm.2016.02.012
- Korkmaz, S., Göksülük, D., & Zararsiz, G. (2014). MVN: An R package for assessing multivariate normality. R Journal, 6, 151–162.
- Lance, C. E., Butts, M. M., & Michels, L. C. (2006). The sources of four commonly reported cutoff criteria: What did they really say? Organizational Research Methods, 9(2), 202–220. https://doi.org/10.1177/1094428105284919
- MacCallum, R. C., Widaman, K. F., Zhang, S., & Hong, S. (1999). Sample size in factor analysis. Psychological Methods, 4(1), 84–99. https://doi.org/10.1037/1082-989X.4.1.84
- Mardia, K. V. (1970). Measures of multivariate skewness and kurtosis with applications. Biometrika, 57(3), 519–530. https://doi.org/10.1093/biomet/57.3.519
- McDonald, R. P. (1999). Test theory: A unified treatment. Psychology Press.
- McGhie, A., & Chapman, J. (1961). Disorders of attention and perception in early schizophrenia. The British Journal of Medical Psychology, 34(2), 103–116. https://doi.org/10.1111/j.2044-8341.1961.tb00936.x
- Mecklin, C. J., & Mundfrom, D. J. (2005). A monte carlo comparison of the Type I and Type II error rates of tests of multivariate normality. Journal of Statistical Computation and Simulation, 75(2), 93–107. https://doi.org/10.1080/0094965042000193233
- Micoulaud-Franchi, J.-A., Hetrick, W. P., Boyer, L., Bolbecker, A., Aramaki, M., Ystad, S., Richieri, R., El-Kaim, A., Faget, C., Faugere, M., Cermolacce, M., Kronland-Martinet, R., Lancon, C., & Vion-Dury, J. (2014). Validation of the French sensory gating inventory: A confirmatory factor analysis. Psychiatry Research, 220(3), 1106–1112. https://doi.org/10.1016/j.psychres.2014.08.025
- Micoulaud-Franchi, J.-A., Lopez, R., Cermolacce, M., Vaillant, F., Péri, P., Boyer, L., Richieri, R., Bioulac, S., Sagaspe, P., Philip, P., Vion-Dury, J., & Lancon, C. (2019). Sensory gating capacity and attentional function in adults with ADHD: a preliminary neurophysiological and neuropsychological study. Journal of Attention Disorders, 23(10), 1199–1209. https://doi.org/10.1177/1087054716629716
- Micoulaud-Franchi, J.-A., Lopez, R., Michel, P., Brandejsky, L., Bioulac, S., Philip, P., Lancon, C., & Boyer, L. (2017). The development of the SGI-16: A shortened sensory gating deficit and distractibility questionnaire for adults with ADHD. ADHD. Attention Deficit and Hyperactivity Disorders, 9(3), 179–187. https://doi.org/10.1007/s12402-016-0215-4
- Micoulaud-Franchi, J.-A., Vaillant, F., Lopez, R., Peri, P., Baillif, A., Brandejsky, L., Steffen, M. L., Boyer, L., Richieri, R., Cermolacce, M., Bioulac, S., Aramaki, M., Philip, P., Lancon, C., & Vion-Dury, J. (2015). Sensory gating in adult with attention-deficit/hyperactivity disorder: event-evoked potential and perceptual experience reports comparisons with schizophrenia. Biological Psychology, 107, 16–23. https://doi.org/10.1016/j.biopsycho.2015.03.002
- Mohebbi, M., Mahmoudian, S., Motevalian, S. A., Janani, L., Farhadi, M., & Daneshi, A. (2019). Developing the persian version of sensory gating inventory and assessing its validity and reliability. Basic and Clinical Neuroscience, 10(6), 597–607. https://doi.org/10.32598/BCN.9.10.360
- Muthén, L. K., & Muthén, B. O. (1998). Mplus user’s guide. Muthén & Muthén.
- Nobuyoshi, M., Kano, Y., Matsuda, N., Kono, T., Nonaka, M., Fujio, M., & Shimoyama, H. (2018). Reliability and validity of a Japanese version of the Sensory Gating Inventory (SGI). The Japanese Journal of Psychology, 89(5), 507–513. https://doi.org/10.4992/jjpsy.89.17314
- Nunnally, J. C. (1978). An overview of psychological measurement. Clinical diagnosis of mental disorders, 78, 97–146.
- Polit, D. F. (2014). Getting serious about test–retest reliability: a critique of retest research and some recommendations. Quality of Life Research, 23(6), 1713–1720. https://doi.org/10.1007/s11136-014-0632-9
- Qin, S., Nelson, L., McLeod, L., Eremenco, S., & Coons, S. J. (2019). Assessing test–retest reliability of patient-reported outcome measures using intraclass correlation coefficients: recommendations for selecting and documenting the analytical formula. Quality of Life Research, 28(4), 1029–1033. https://doi.org/10.1007/s11136-018-2076-0
- Qualtrics. (2020). Qualtrics,. Retrieved from https://www.qualtrics.com
- Raykov, T. (1998). A method for obtaining standard errors and confidence intervals of composite reliability for congeneric items. Applied Psychological Measurement, 22(4), 369–374. https://doi.org/10.1177/014662169802200406
- Rosseel, Y. (2012). lavaan: An R package for structural equation modeling. Journal of Statistical Software, 48(2), 1–36. https://doi.org/10.18637/jss.v048.i02
- Sable, J. J., Kyle, M. R., Knopf, K. L., Schully, L. T., Brooks, M. M., Parry, K. H., Diamond, R. E., Flink, L. A., Stowe, R., Suna, E., & Thompson, I. A. (2012). The sensory gating inventory as a potential diagnostic tool for attention-deficit hyperactivity disorder. Attention Deficit and Hyperactivity Disorders, 4(3), 141–144. https://doi.org/10.1007/s12402-012-0079-1
- Schriesheim, C. A., Kopelman, R. E., & Solomon, E. (1989). The effect of grouped versus randomized questionnaire format on scale reliability and validity: A three-study investigation. Educational and Psychological Measurement, 49(3), 487–508. https://doi.org/10.1177/001316448904900301
- Sparfeldt, J. R., Schilling, S. R., Rost, D. H., & Thiel, A. (2006). Blocked versus randomized format of questionnaires: A confirmatory multigroup analysis. Educational and Psychological Measurement, 66(6), 961–974. https://doi.org/10.1177/0013164405285906
- Suh, Y. (2015). The performance of maximum likelihood and weighted least square mean and variance adjusted estimators in testing differential item functioning with nonnormal trait distributions. Structural Equation Modeling, 22(4), 568–580. https://doi.org/10.1080/10705511.2014.937669
- Terrasa, J. L., Montoya, P., González-Roldán, A. M., & Sitges, C. (2018). Inhibitory control impairment on somatosensory gating due to aging: an event-related potential study. Frontiers in Human Neuroscience, 12, 280. https://doi.org/10.3389/fnhum.2018.00280
- Thomas, C., Vom Berg, I., Rupp, A., Seidl, U., Schröder, J., Roesch-Ely, D., Kreisel, S. H., Mundt, C., & Weisbrod, M. (2010). P50 gating deficit in Alzheimer dementia correlates to frontal neuropsychological function. Neurobiology of Aging, 31(3), 416–424. https://doi.org/10.1016/j.neurobiolaging.2008.05.002
- Venables, P. H. (1964). Input dysfunction in schizophrenia. Progress in Experimental Personality Research, 72, 1–47. http://www.ncbi.nlm.nih.gov/pubmed/14348121
- Whittaker, T. A. (2012). Using the modification index and standardized expected parameter change for model modification. The Journal of Experimental Education, 80(1), 26–44. https://doi.org/10.1080/00220973.2010.531299
- Xia, Y., & Yang, Y. (2019). RMSEA, CFI, and TLI in structural equation modeling with ordered categorical data: The story they tell depends on the estimation methods. Behavior Research Methods, 51(1), 409–428. https://doi.org/10.3758/s13428-018-1055-2