
Abstract
Objective
The objective of this study was to investigate clinical symptoms, cognitive performance and cortical activity following mild traumatic brain injury (mTBI).
Methods
We recruited 30 individuals in the sub-acute phase post mTBI and 28 healthy controls with no history of head injury and compared these groups on clinical, cognitive and cortical activity measures. Measures of cortical activity included; resting state electroencephalography (EEG), task related EEG and combined transcranial magnetic stimulation with electroencephalography (TMS-EEG). Primary analyses investigated clinical, cognitive and cortical activity differences between groups. Exploratory analyses investigated the relationships between these measures.
Results
At 4 weeks’ post injury, mTBI participants exhibited significantly greater post concussive and clinical symptoms compared to controls; as well as reduced cognitive performance on verbal learning and working memory measures. mTBI participants demonstrated alterations in cortical activity while at rest and in response to stimulation with TMS.
Conclusions
The present study comprehensively characterized the multidimensional effect of mTBI in the sub-acute phase post injury, showing a broad range of differences compared to non-mTBI participants. Further research is needed to explore the relationship between these pathophysiologies and clinical/cognitive symptoms in mTBI.
Introduction
Traumatic brain injury (TBI) has been estimated to affect 69 million people worldwide every year, with mild traumatic brain injuries (mTBI) accounting for around 80% of all TBIs (Dewan et al., Citation2018). There is significant heterogeneity in symptoms post mTBI, with some individuals reporting persistent symptoms and others rapidly returning to pre-injury functioning. Meta-analyses suggest a moderate overall effect size for the impact of mTBI on neuropsychological functioning and a large effect for clinic-based samples, but with prospective studies suggesting no residual impairment 3 months after injury (Belanger et al., Citation2005; Rohling et al., Citation2011). Meta-analyses have also suggested that mTBI increases the risk for development of neurological or psychiatric illnesses (Hellewell et al., Citation2020; Perry et al., Citation2016), and while most individuals return to work within 6 months, approximately 17% do not (Bloom et al., Citation2018). The factors that contribute to this variability in outcome following mTBI are currently poorly understood. A more nuanced characterization of how symptoms and pathophysiology interact may aid in our understanding of heterogeneous presentations. Further developing our understanding of the relationships between symptoms and pathophysiology may improve clinical decision-making precision around diagnosis and prognosis, as well as the development of targeted therapeutic interventions.
The mechanisms of mTBI injury and their effects on the brain are well established (Karr et al. Citation2014; Rohling et al. Citation2011; Xiao et al. Citation2015). In brief, due to the viscoelastic nature of the brain, bidirectional forces during injury result in shearing of cell membranes and cytoskeletal elements (Giza and Hovda Citation2014). Excitatory and inhibitory neural circuit imbalances post mTBI, commonly referred to as the “neurometabolic cascade” (Giza and Hovda Citation2014), are associated with neuronal dysfunction, disrupted connectivity and impaired cortical information processing (Zhou and Yu Citation2018). Indeed, there has been extensive neuroimaging research showing that clinical and cognitive symptoms correlate with structural and functional connectivity changes following mTBI (e.g. Fitzgerald and Crosson Citation2011; Kinnunen et al. Citation2011; Mayer et al. Citation2011; Palacios et al. Citation2017; Salmond et al. Citation2006; Yuh et al. Citation2014).
Frontoparietal regions and subcortical structures with critical frontal projections have been shown to be particularly susceptible to damage following mTBI (Eierud et al. Citation2014; Lipton et al. Citation2009). Frontal brain regions are implicated in networks relevant to cognition and emotion regulation, offering an explanatory mechanism for the cognitive symptoms that are common after mTBI, and highlighting these brain regions as areas of interest. mTBI, however, is not considered a focal injury, as disruptions to neuronal function impact both local and global brain network connectivity (Sharp et al. Citation2014). The pathophysiological complexity of mTBI highlights the importance of using complementary imaging modalities to understand the neural changes that occur throughout the brain and their relationships to symptoms.
Electroencephalography (EEG) is a noninvasive imaging method that can provide information on brain dynamics with millisecond precision, allowing brain activity to be measured at rest or during cognitive processing. Previous research has detected a range of EEG abnormalities following mTBI, both in the presence and absence of clinical and cognitive symptoms, highlighting the sensitivity of EEG as a measure of disrupted brain function (Broglio et al. Citation2011; Dockree and Robertson Citation2011; Haneef et al. Citation2013; Rapp et al. Citation2015). Transcranial magnetic stimulation (TMS) has also been used to investigate cortical activity changes post mTBI, however most of this work has been in the motor cortex (Major et al. Citation2015). While these motor cortex findings have varied considerably across studies, likely due to methodological variability, changes have been detected in a range of TMS components that reflect cortical reactivity (Chistyakov et al. Citation2001; De Beaumont et al. Citation2007; Citation2011; Citation2012; Miller et al. Citation2014; Tallus et al. Citation2012; Tremblay et al. Citation2011). In addition to their independent use, TMS and EEG can be combined to measure neural activity (with EEG) in response to the TMS pulse. TMS-EEG investigations of brain function outside of the motor cortex are of critical importance given the diffuse nature of mTBI and its cognitive consequences. When applied to the brain, TMS elicits a complex waveform of peaks and troughs, known as a TMS Evoked Potential (TEP), which can be measured using EEG. The TEP is understood to represent the summation of excitatory and inhibitory postsynaptic potentials from large populations of pyramidal neurons (Rogasch and Fitzgerald Citation2013). EEG captures the propagation of the TMS signal across the scalp, providing information on cortical reactivity, cortical oscillations and local and network connectivity (Rogasch and Fitzgerald Citation2013). To date, two published studies have measured TMS-EEG outside of the motor cortex in mTBI. These studies reported abnormalities in TEP components in participants an average of 5 years post mTBI (Tallus et al. Citation2013) and 2 years post mTBI (Opie et al. Citation2019). Both studies administered TMS to the dorsolateral prefrontal cortex (DLPFC) and neither study evaluated clinical symptom severity or cognitive performance. The research summarized above indicates that TMS-EEG and EEG studies have the potential to provide a greater understanding of the complex relationships between pathophysiology and clinical/cognitive symptoms following mTBI. However, to achieve this, studies need to assess neural activity in cognitively relevant brain regions (at rest, during cognitive processing and in response to external stimulation [i.e. TMS-EEG]), as well as clinical and cognitive symptoms, and the associations between these symptoms and the neural activity. This was the aim of the current study.
We compared individuals who had sustained a mTBI in the previous 4 weeks with individuals with no history of head injury on a comprehensive battery of clinical, cognitive and cortical activity measures. In addition to examining group differences in neuropsychological and neurophysiological measures, we also aimed to explore the relationships between these measures, to assess for interactions between symptoms and pathophysiology. We hypothesized that mTBI participants would report greater clinical symptoms compared to controls and show impairments on cognitive measures that are sensitive to effects of mTBI (e.g. attention, working memory, executive function and processing speed). We also predicted that mTBI participants will exhibit neurophysiological differences on measures of connectivity, functional activity and cortical reactivity (TEP’s) as assessed using resting EEG, task-related EEG and TMS-EEG respectively. The directionality of cortical activity responses were not hypothesized due to the small number of prior studies and heterogeneity in the literature.
Material and methods
Participants
A total of 58 participants were recruited (30 mTBI, 28 healthy controls). The 30 participants with mTBI were recruited from the emergency department and trauma wards of the Alfred Hospital, Melbourne (less than 1 month post injury, mean days since injury = 19.70, SD = 16.96, range 10-31, mean age at injury = 35.43 years, SD = 10.31). An age and sex-matched control group was also recruited through community advertising at the hospital where the mTBI participants were recruited, as well as at universities and through social media. These 28 participants had no history of any traumatic brain injury (mean age = 31.65 years, SD = 9.06). No participants had a history of seizures, psychiatric or neurological illnesses, unstable medical conditions, were pregnant or prescribed medication known to directly or significantly influence electroencephalographic (EEG) findings. mTBI was classified as GCS 13-15, loss of consciousness < 30 minutes and post-traumatic amnesia (PTA) < 24 hours (Carroll et al. Citation2004). This information was obtained from the medical records from the emergency department, so reflects the emergency department’s assessment of the mTBI severity. Where possible (based on participant recollection), the information was verified by participant self-report. All participants provided written informed consent prior to commencement of study procedures. The study received approval from both The Alfred and Monash University Ethics Committees (260/16).
Procedure
Each participant attended a single 3-hour experimental session where clinical, cognitive and cortical activity measures were assessed. Participants then underwent a session of intermittent Theta Burst Stimulation (iTBS) after which the cortical activity measures were repeated. This was performed to assess the potential modulation of cortical activity by iTBS, results of which will be reported in a separate study. Please note, the current manuscript will report the pre iTBS measures only. All measures are described in detail below.
Clinical and cognitive measures
Demographic information included age, date of birth, gender and years of education. The Mini International Neuropsychiatric Interview-Screen (Sheehan et al. Citation1998) was completed to rule out the presence of psychiatric or substance use disorders. Since the presence of a psychiatric or substance use disorder were exclusion criteria, none of the participants included in the study met the criteria for these conditions, so we have not presented the data from the MINI in our results (as all the data were 0 for all these disorders). The Edinburgh Handedness Inventory (Oldfield, Citation1971) determined handedness. A range of clinical measures to assess mood, fatigue and post concussive symptomology were administered (see Supplementary Materials Table 1 for details). Participants completed a comprehensive cognitive battery prior to the neurophysiological assessment. Measures administered included; Wechsler Test of Adult Reading (WTAR) which assesses premorbid cognitive ability by evaluating reading skills, providing a baseline for cognitive comparisons (Hartman, Citation2009), Trail Making Test Parts A and B (TMT) which assess attention, visual-motor tracking, and cognitive flexibility, with Part A measuring visual attention and processing speed, while Part B introduces cognitive shifting and measures executive functions (Bowie and Harvey, Citation2006), subtests from the Wechsler Adult Intelligence Scale-IV (Working Memory Index which evaluates the capacity to temporarily hold and manipulate information for cognitive tasks, and Processing Speed Index which measures the speed at which cognitive tasks are executed) (Hartman, Citation2009). The Rey Auditory Verbal Learning Test (RAVLT) evaluates verbal memory and learning by assessing the ability to learn and recall a list of words over several trials, indicating memory retention and retrieval (Rosenberg et al., Citation1984), the Brief Visual Memory Test (BVMT) assesses visual memory by presenting complex figures for reproduction, measuring the ability to recall and reproduce complex visual information (Benedict et al., Citation1996) and the Controlled Word Association Test measures verbal fluency and executive functions by requiring participants to generate words beginning with specific letters within a limited time, reflecting cognitive flexibility and language-related processes (Benton et al., Citation1994).
Cortical activity measures
EEG recording and tasks
EEG was recorded with TMS-compatible Ag/AgCl electrodes and a DC coupled amplifier (SynAmps2, Compumedics Neuroscan, Texas, USA). Fifty electrodes were used from a 64-channel Easycap EEG cap (AF3, AF4, F7, F5, F3, F1, Fz, F2, F4, F6, F8, FC5, FC3, FC1, FCz, FC2, FC4, FC6, T7, C5, C3, C1, Cz, C2, C4, C6, T8, CP5, CP3, CP1, CP2, CP4, CP6, P7, P5, P3, P1, Pz, P2, P4, P6, P8, PO7, PO3, POz, PO8, PO4, O1, Oz, O2). Electrodes were referenced on-line to CPz and grounded to FPz. All data was recorded with a high acquisition rate (10,000Hz) and low-pass filtered (DC- 2,000 Hz) using a large operating window (200 mV). Electrode impedances were below 5 kΩ at the start of each resting or task related EEG recording. EEG was recorded at rest and during a number of cognitive tasks (described below). Tasks were presented during EEG using Presentation® software (Version 18.0, Neurobehavioral Systems, Inc., Berkeley, CA, www.neurobs.com), as were instructions provided to participants prior to the resting EEG recordings. EEG pre-processing details are provided in the Supplementary Materials.
Resting EEG data
Participants sat quietly and relaxed in a dimly lit room during resting EEG recordings. Intra-auricular earphones were inserted, and participants instructed to keep their eyes open until they heard a brief tone, after which they should shut their eyes. Recordings of eyes open and eyes closed EEG activity were both 3 minutes in duration.
Working memory EEG Task - Digit span Backwards
Participants completed a computerized version of a backwards digit span task. Pseudo-randomized sequential auditory digits were presented aurally through earphones in a performance-adapted list length adjustment design. The stimuli consisted of the digits ‘1′ through ‘9′ and digits could not be repeated directly in any sequence. The task began with digit sequences consisting of 2 digits and the number of digits in each sequence increased by 1 digit every two trials. The task stopped when the participant had two consecutive errors at any given digit set size. A fixation cross was presented for 1000 ms to direct participant’s attention, followed by an interval of 1000 ms before the presentation of the first digit. Each digit was presented for 500 ms with a 1000 ms interval. Following presentation of all digits a recall prompt instructed participants to type their response using a keyboard and to press enter to record their response. To calculate participants’ raw digit span score, one point was given for each successful trial and the total points were summed (.
Figure 1. EEG task design. This figure shows the task design for the two electroencephalography tasks implemented in the study. Top: the backwards digit span task, where participants were required to listen to a list of digits, remember those digits, and enter the digits in reverse order using the keyboard after the list was complete. List size began at 2 digits, and increased by 1 digit every two trials until the participant made two consecutive errors. Bottom: the Go Nogo task, which presented ‘Go’ stimuli (that required a participant’s button press response) and ‘No go’ stimuli (that required participants to withhold their response). Go and No go stimuli were presented with equal frequency.
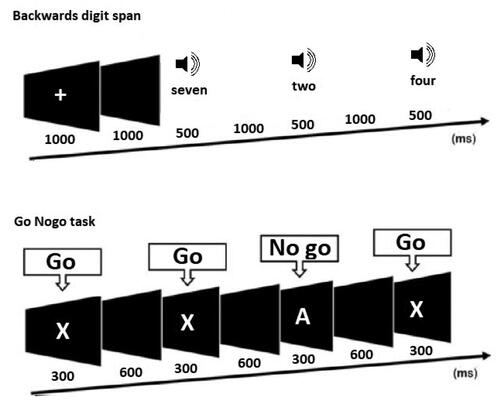
Sustained attention EEG Task - Continuous Performance Test (CPT)
Participants were required to respond with a left mouse click to target (‘Go’) stimuli and inhibit their response to non-target (‘No Go’) stimuli (Riccio et al. Citation2002). Letters were presented centrally on a computer screen for a time of 300 ms (inter stimulus interval of 900 ms) in a pseudo randomized order. ‘Go’ stimuli were the letter ‘X’ and ‘No Go’ stimuli were the letter ‘A’. The stimulus set consisted of 244 trials, 50% ‘target’ stimuli, 50% no go stimuli. 10 practice trials were completed prior to task commencing and during the task 30 trials were presented before a rest break was offered. ‘Go’ and ‘No Go’ stimuli were equally probable, so the comparison of brain responses between ‘target’ and ‘non-target’ stimuli was not confounded by the effect of differences in frequency of stimuli (Bailey, Freedman et al., Citation2019; Lavric et al. Citation2004) .
TMS-EEG data
TMS was delivered using a figure-of-eight MagVenture B-65 fluid-cooled coil (MagVenture A/S, Denmark) in a biphasic mode. The EEG cap was applied first, and then the resting motor threshold (RMT) was determined (by applying TMS over the cap) as the minimum stimulus intensity required to elicit at least three out of five motor evoked potentials (MEPs) > 0.05 mV in amplitude (Conforto et al. Citation2004) in the relaxed first dorsal interosseous muscles. TMS was administered to the left dorsolateral prefrontal cortex (DLPFC) at the F3 electrode using the 10/20 system of placement. Participants listened to white noise through intra-auricular earphones (Etymotic Research, ER3-14A, USA) to limit the influence of auditory processing of the TMS click (Rogasch et al. Citation2014). The sound level was adjusted for each participant until background noise was barely audible. Participants received 100 single pulses at an interval of 4 seconds (with a 10% jitter) at RMT 110%.
Analyses
All statistical analyses of clinical and cognitive measures were performed using R Studio (version 1.1.463) (R Core Team Citation2018). Resting EEG and TMS-EEG data were processed and analyzed offline using EEGLAB (Delorme and Makeig Citation2004), TMS-EEG Signal Analyzer (TESA) (Rogasch et al. Citation2017), FieldTrip (Oostenveld et al. Citation2011), BrainNet Viewer (Xia et al. Citation2013) and custom scripts on the MATLAB platform (version R2017a). EEG task-based data was analyzed using the Randomization Graphical User Interface (RAGU), an open-source MATLAB based toolbox (Koenig et al. Citation2011) previously demonstrated to detect between group differences in task-based EEG data (Bailey et al., Citation2014; Citation2015., Bailey, Raj et al., Citation2019). Data from two control participants were excluded due to equipment malfunction and experimenter error.
Clinical and cognitive measure analysis
Welch’s t-tests were used to evaluate clinical differences between the two groups as they are more robust to unequal variances and unequal sample sizes (Ruxton Citation2006). Cohen’s d was used to calculate effect sizes. One-way ANCOVAs were used to evaluate cognitive differences between the two groups, including premorbid intelligence (WTAR) as a covariate. Assumptions of normality, independence of the covariate and homogeneity of regression slopes were met.
Resting EEG data analysis
Following pre-processing (see Supplementary Materials) all participants had provided 60 or more noise free epochs of two seconds in length for eyes open (EO) and eyes closed (EC) conditions, providing enough trials for reliable analysis (EO mean total epochs = 79.95, SD = 8.70, EC mean total epochs = 87.68, SD = 6.84). For power computation, EEG data were submitted to a frequency transformation based on fast fourier transform using the ‘mtmfft’ method and Hanning taper (from 0.1 Hz to 100 Hz in steps of 0.2 Hz) to calculate the average power within four frequency bands: theta (4–8 Hz), alpha (8–12 Hz), beta (12–30 Hz) and gamma (30–45 Hz). Average total power was then calculated across all epochs within each frequency band for each condition, resulting in a single value for each participant, within each frequency band and each condition at each electrode. For statistical analysis of power, non-parametric cluster-based permutation statistics assessed differences in power between groups for each frequency band. Conducted in Fieldtrip (Oostenveld et al. Citation2011), cluster-based permutation tests provide a method for effectively controlling for multiple comparisons across numerous EEG electrodes and time-points (Maris and Oostenveld Citation2007). Clusters were defined as ≥ 2 neighboring electrodes with p < .05. Monte Carlo p-values were computed on 5000 random permutations. A primary critical α level set at p < .05 was used as the cluster-statistical significance for all analyses, controlling for multiple comparisons across space and time, with a secondary threshold for family-wise cluster based null hypothesis testing (p < .025; two-tailed test). For connectivity computation, the debiased estimator of the weighted phase lag index (wPLI) was used to compute connectivity from the fourier output of the ‘mtmfft’ frequency measure. The wPLI is conservative measure of phase synchronization between electrodes. wPLI provides a value for each pair of electrodes between 0 – 1, with higher values reflecting more connectivity between the two electrodes. For statistical analysis of connectivity, the wPLI values for each participant from both groups were averaged across time, epochs, and frequency, in the same frequency bands as power computations for both conditions (EO and EC). Network based statistics (NBS) (a non-parametric statistical method used to make statistical comparisons between large numbers of pairs using cluster based statistical methods to control for multiple comparisons) (Zalesky et al. Citation2010), was used to analyze differences between groups in each frequency band and each condition. Pairs with a test statistic exceeding the primary threshold (see section 2.4) provided the pairs for the cluster based null hypothesis test. BrainNet Viewer (Xia et al. Citation2013) was used to visualize significant connections, displaying graph theoretical networks as ball-and-stick models (see Supplementary Materials for additional details on wPLI and NBS methods).
Working memory EEG task - digit span backwards analysis
Following pre-processing (see Supplementary Materials) participants were included only if they had provided = >15 artifact-free correct epochs of 1 second in length. The final sample included 26 mTBI participants (Number of epochs; M = 38.78, SD = 17.35) and 23 control participants (Number of epochs; M = 31.27, SD = 13.73). Only individuals included in the EEG analysis were included in the digit span backwards behavioral analyses. For statistical analysis of ERP’s, measures of neural response strength and topography were calculated using RAGU with 5000 randomization runs, and a threshold of p < .05 (see Supplementary Materials).
Sustained attention EEG task - continuous performance test (CPT) analysis
Following pre-processing (see Supplementary Materials) participants were included if they had a minimum of 80 artifact-free correct epochs of 1 second in length for ‘Go’ and ‘No Go’ conditions. The sustained attention task was added to the protocol as an additional measure after recruitment had commenced, resulting in a smaller sample size. The final sample included a total of 17 control participants (Go-epochs: M = 112.70, SD = 4.59; No Go-epochs: M = 107.41, SD = 8.80) and 20 mTBI participants (Go-epochs: M = 111.10, SD = 5.78; No Go-epochs: M = 107, SD = 8.16). To assess whether behavioral performance differed between control and mTBI participants, separate two-way ANCOVAs were conducted for accuracy and reaction time, with group (control vs. mTBI), condition (‘Go’ vs ‘No Go’) as between and within subject factors respectively, and pre-morbid IQ (WTAR) as a covariate.
For statistical analysis of ERP’s, the Randomization Graphical User Interface (RAGU), an open-source MATLAB based toolbox was utilized (Koenig et al. Citation2011). RAGU is a multivariate approach that uses powerful, assumption free, randomization statistics to analyze multi-channel event related potential (ERP) data (Koenig et al. Citation2011). RAGU allows for comparisons of overall neural response strength (with the global field power - GFP test). Global brain activity can be described by the global field power (GFP), which is mathematically defined as the root of the mean of the squared potential differences at all K electrodes (i.e. Vi(t)) from the mean of instantaneous potentials across electrodes (i.e. Vmean(t)) (Lehmann and Skrandies, Citation1980). A measure of the strength of the electric field over the brain at each point in time, GFP is representative of the global brain response to an event. Local maxima of GFP curve represents instances of strongest field strength and highest topographic signal to noise ratio (Khanna et al., Citation2015). RAGU also allows for comparisons of the distribution of neural activity between group and condition, using topographic analysis of variance (TANOVA). The TANOVA is a non-parametric randomization test based on global dissimilarities between electric fields. In contrast to electrode-wise comparisons, the TANOVA computes global dissimilarity of the whole electrical field topographies between conditions or groups and tests for the significance of these topographic differences at each time point (Ruggeri et al., Citation2019). The TANOVA was implemented on the amplitude-normalized maps (GFP = 1), such that the results obtained are independent of variations in the global field strength. The rationale behind this approach is that it enables significant differences between conditions to be attributed to partially different sources of the evoked potential, and not to different strengths of similar source distributions. After observing periods above the duration threshold, post-hoc t-maps were produced to enable further investigation of the topographic distribution of the observed differences. A topographic consistency test (TCT) was then conducted to identify the periods in the epoch which there is positive evidence for a consistent distribution of scalp activity across participants within each group and time point (Koenig and Melie-Garcia Citation2010). This test compares the GFP of the grand mean topographical map across all participants within a condition or group against a null distribution of GFPs obtained from randomly permuting channels across the topographical maps then computing the grand mean. Since the GFP of the grand mean topographical map will differ from zero only if a consistent topographical activation pattern is provided across the included participants, this TCT test indicates whether a consistent topographical pattern of neural response is provided by the task.
To protect the results from false positives caused by multiple testing, additional testing checked whether the duration of continuous periods of significance observed in our data exceeded the duration of significant periods in > 95% of the randomized data. This ensured the duration of a significant time period exceeded chance. Five thousand permutations were conducted with an alpha of p < .05.
TMS-EEG data analysis
Following pre-processing (see Supplementary Materials) all participants provided a minimum of 55 artifact free epochs of 2 seconds in length. One mTBI participant was removed from the TMS-EEG analysis due to problems with the recording file. The final sample included 29 mTBI (Number of epochs; M = 94.3, SD = 7.48) and 26 control participants (Number of epochs; M = 97.7, SD = 3.05).
TEP analysis focussed on four separate peaks known to occur following stimulation of the prefrontal cortex, the N45, P60, N100 and P200 (Rogasch et al. Citation2014; Citation2015). Negative peaks were identified as the maximum occurring peaks between 0.035 and 0.050 s following the TMS pulse (N45), and 0.09 and 0.135 s (N100); while the positive peaks were identified as those occurring between 0.05 and 0.07 s (P60) and 0.15 and 0.24 s (P200). Cluster based analyses, as per resting EEG data, were performed to test for differences between groups (Control vs. mTBI) using t-test designs. For significant clusters, regions of interest were defined, and peak amplitude values extracted for TEP components.
Correlations
To assess relationships between clinical, cognitive and cortical activity measures Pearson’s correlations were used. To reduce the number of comparisons, associations were only explored between measures that significantly differentiated the groups. Clinical and cognitive measures included; mood, fatigue, PCS severity and verbal learning. Cortical activity measures included; resting alpha power and P60 and N100 TEP amplitude.
Results
Demographics for the mTBI and control participants are summarized in . The groups did not differ significantly on measures of sex, age and pre-morbid intelligence (all p > .05), however controls had a higher level of education (p = .035).
Table 1. Demographic information for control and mTBI.
Clinical measures
All individuals received a CT scan upon their admission to the Alfred Hospital, presence of hematoma, hemorrhage or fracture was classified as CT pathology positive in line with previous classification of “complicated” vs “uncomplicated” mTBI (Stippler et al., Citation2012). 43.3% of the mTBI participants had positive CT findings, so our sample should be considered to be a mix of complicated and uncomplicated mTBI participants.
Clinical characteristics of the mTBI group are presented in . “Other injury” was classified as orthopedic or musculoskeletal injuries co-occurring at the time of mTBI.
Table 2. Clinical characteristics of mTBI group.
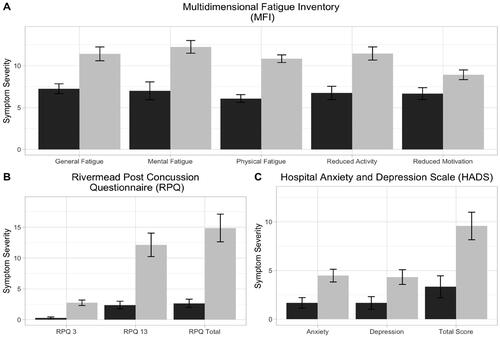
Measures for mood and symptom evaluation for control and mTBI participants are presented in . The mTBI group showed significantly greater scores on measures of anxiety, depression, fatigue and post-concussion symptoms (p < .05). 23.3% (n = 7) reported anxiety symptoms in the elevated range and 3.33% (n = 1) in the clinically significant range. For depressive symptoms, 16.7% (n = 5) of mTBI participants were in the elevated range and 6.67% (n = 2) in the clinically significant range. See Supplementary Table 2 for means and standard deviation.
Figure 2. Clinical symptoms for mild traumatic brain injury (mTBI) and control group participants. This figure shows participant’s symptom report on A) fatigue (measured by the Multidimensional Fatigue Inventory (MFI)), B) mood (measured by the Hospital Anxiety and Depression Scale (HADS)) and C) post-concussion symptom (measured by the Rivermead Post Concussion Symptom Questionnaire (RPQ)) measures. Control participants are indicated in black and mild traumatic brain injury (mTBI) participants in grey. Values depicted are means with standard error bars. See supplementary information (Table S2) for additional information. P values correspond to the outcome of Welch’s t-tests and all comparisons yielded p < .05.
Cognitive measures
None of our mTBI participants provided digit span task scores below 5, which is only one digit lower than the lowest performing control. Additionally, none of the mTBI participants were outliers in the TMT part A. As such, our results indicate that performance validity was unlikely to be an issue in the mTBI group, so no participants were removed due to this potential issue. Performance on cognitive tasks for control and mTBI participants are presented in . To account for the higher level of education in the control group, co-variate analyses were conducted for cognitive measures controlling for pre-morbid intelligence (WTAR). This measure was chosen instead of education as it did not violate the ANCOVA independence of covariate and dependent variable assumption. A one-way ANCOVA demonstrated that mTBI participants recalled fewer words on the first trial of the RAVLT, F(1, 51) = 6.13, FDR-p = 0.0467, ηp2 = 0.11. No other significant differences in cognitive performance on pencil and paper measures were shown (all FDR-p > 0.05). Differences in digit span performance accuracy were subjected to a Welch’s independent samples t-test. There was no significant effect of group, with the control group recalling a non-significantly higher number of items on the digit span task (M = 9.61, SD = 2.43, minimum = 6, maximum = 17) than the mTBI group (M = 8.50, SD = 2.57, minimum = 5, maximum = 14), t (47) = 1.55, p = 0.127. Differences in sustained attention task performance (reaction time and accuracy) were subjected to separate two-way (Group x Condition) ANCOVA’s (with premorbid IQ as a covariate). For reaction time, there was a significant effect of condition on reaction time after controlling for pre-morbid IQ, participants responding significantly faster to ‘No Go’ trials (M = 258.23, SD = 33.31) than ‘Go’ trials (M = 318.50, SD = 30.75), F (1,64) = 54.51, p < 0.01. For accuracy, a significant effect of condition after controlling for premorbid IQ was also demonstrated, control and mTBI participants responding more accurately to ‘Go’ trials (M = 0.997, SD = 0.004) than ‘No Go’ trials (M = 0.952, SD = 0.050), F (1, 67) = 29.39, p < 0.01). For reaction time and accuracy, no significant effect of group or significant interaction between group and condition was demonstrated (p > .05).
Table 3. Descriptive statistics and ANCOVA results for cognitive measures.
Cortical activity measures
Resting EEG data
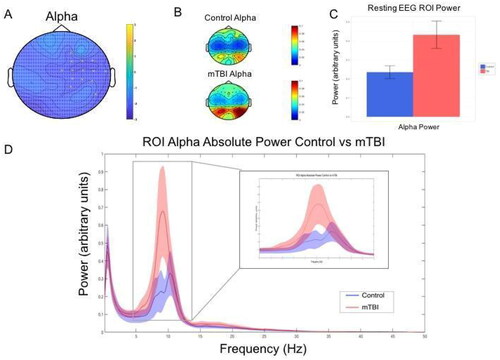
mTBI participants were shown to have greater alpha power in the right fronto-central region during the eyes closed condition (t = −30.02, FDR-p = 0.0431) (see ). No significant differences were demonstrated in theta, beta or gamma frequencies (FDR-p > .05).
Figure 3. Resting EEG alpha power group differences. This figure shows mild traumatic brain injury (mTBI) participants demonstrated significantly greater alpha power (8–12 Hz arbitrary units) during the eyes closed resting EEG condition compared to the control group. A—Topoplot showing adjacent electrodes (p < 0.025) clustering in in the right fronto-central region when testing for a difference in power in the alpha range (8-12 Hz) between groups. B—Topoplot showing the distribution of activity between groups for the region of interest (ROI) as identified by the clustering electrodes. C—Alpha power for ROI electrodes for control and mTBI participants (values depicted are means with standard error bars). D—Mean spectral power content from cluster ROI electrodes with 95% confidence interval shading.
Connectivity measures (wPLI)
Using the wPLI connectivity matrices for all electrode pairs, comparisons between control and mTBI participants demonstrated no significant differences in connectivity across theta (4-8Hz), alpha, (8-12hz), beta (12-30hz) and gamma (30-45Hz) bands between the two groups (FDR-p > .05) across eyes open and eyes closed conditions.
Working memory EEG task - digit span backwards
The GFP test showed a significant main effect of group from 617-655ms and 950-1000ms post digit presentation (exceeding the global duration control of 25 ms). However, these periods were during periods of topographical inconsistency in the TCT test, suggesting that any group differences during these periods may be the result of inconsistent neural activity patterns within groups, rather than a significant difference between the groups. As such, these differences were not interpreted further. The TANOVA demonstrated no significant topographical differences in the distribution of neural activity (see Supplementary Materials).
Sustained attention EEG Task - continuous performance test (CPT)
The 2 × 2 (Group x Condition) global field power (GFP) test showed a significant main effect of condition in a period from 376-428 ms post stimuli presentation (global count p = 0.0062, which exceeded the global duration control of 38 ms). Average GFP was significantly higher in response to the ‘Go’ compared to the ‘NoGo’ condition. No main effect of group or significant between group and condition interaction was demonstrated in the GFP test (FDR-p > .05). The TANOVA demonstrated no significant topographical differences in the distribution of neural activity for group at any point across the epoch (FDR-p > .05). A main effect of condition was demonstrated, see Supplementary Materials.
TMS-EEG data
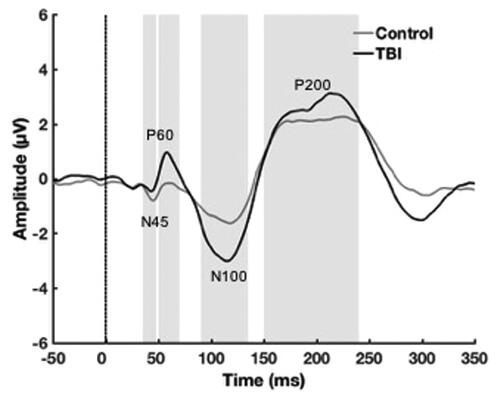
Single-pulse TMS over the left dorsolateral prefrontal cortex (DLPFC) resulted in a characteristic series of negative and positive peaks including N45, P60, N100 and P200. The grand average TEP for each group is displayed in , with the four peaks of interest (N45, P60, N100, P200) and their respective time windows outlined.
Figure 4. Transcranial-evoked potential (TEP) grand average waveforms. This figure plots TEP grand average waveforms following delivery of TMS pulse (shown with dotted line) across all electrodes for each group. Peak windows of interest (N45, P60, N100 and P200) that underwent analysis are delineated by grey shading.
Non-parametric cluster-based permutation tests revealed a significant difference between groups for the P60 TEP that was most pronounced in the left parieto-occipital region, where the mTBI group showed a larger amplitude P60 (t = 23.10, FDR-p = 0.0420) (). For the N100 TEP component there was a significant between group difference that was most pronounced in the right fronto-central region, where the mTBI group showed a larger amplitude N100 (t = 36.26, FDR-p = 0.0289) and in the left parieto-occipital region, where the mTBI group also showed a larger amplitude N100, but we note that the polarity of the N100 is reversed at these electrodes (t = − 31.66, FDR-p = 0.0289).
Figure 5. P60 And N100 topographies. A) Non-parametric cluster-based permutation tests revealed a significant difference between groups for the P60 TEP that was most pronounced in the left parieto-occipital region (t = 23.10, p = 0.012). The between group difference map can be viewed on the left, the TEP waveform in the middle depicts the averaged activity within this cluster, and the topography maps on the right depict the averaged activity within the P60 TEP window for each group. B) For the N100 TEP component there was a significant between group difference that was most pronounced in the right fronto-central region (t = 36.26, p = 0.0036) and in the left parieto-occipital region (t = - 31.66, p = 0.0058). The between group difference map can be viewed on the left, the TEP waveform in the middle depicts the averaged activity within the frontal cluster and the posterior cluster, and the topography maps on the right depict the averaged activity within the N100 TEP window for each group.
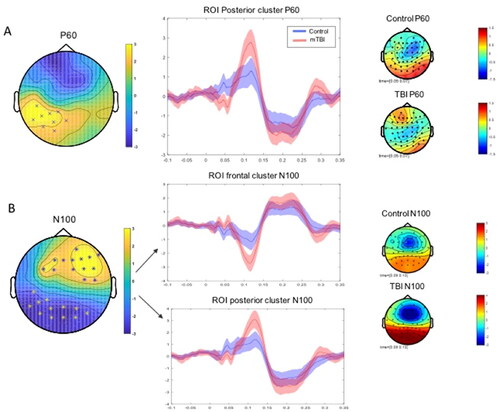
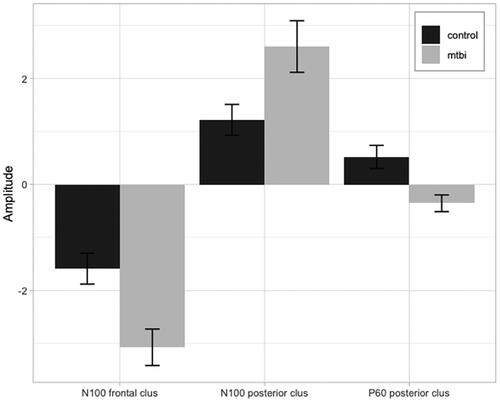
Electrodes identified as forming clusters when testing for the N100 and P60 TEP measures were used to develop regions of interest (ROI). ROI peak to peak mean amplitude was extracted (see ) to be used to explore relationships with clinical and cognitive measures.
Figure 6. Peak to peak amplitude. This figure plots transcranial evoked potential (TEP) peak to peak mean amplitude values and standard error for region of interest (ROI) analyses for N100 (frontal and posterior) and P60 (frontal) TEP components in control (black) and mTBI (grey) groups (as indicated in ).
Correlations
Associations between behavioral measures and neurophysiological markers of pathophysiology that significantly differentiated the groups were assessed using correlational analyses. Clinical and cognitive measures included; mood, fatigue, PCS severity and verbal learning. Cortical activity measures included; resting alpha power and P60 and N100 TEP amplitude. No significant associations were demonstrated between resting EEG alpha power and clinical or cognitive measures in either group (p > .05). For TEP measures, no associations between posterior or anterior N100 amplitude or posterior P60 amplitude and clinical or cognitive measures were demonstrated (p > .05).
Analyses separated by complicated vs uncomplicated mTBI
To test whether the significant results we detected in our primary analyses may have been driven by effects specifically within the complicated or uncomplicated mTBI sub-groups, we performed exploratory analyses where the mTBI group was split into complicated and uncomplicated mTBI. These exploratory analyses tested only the measures that differed between groups in our primary analyses. Firstly, a one-way ANCOVA demonstrated a significant main effect of group for the first trial of the RAVLT, F(2, 50) = 3.852, p = 0.028, ηp2 = 0.134. Post-hoc Tukey tests were conducted to determine the driver of this significant effect, which revealed that the uncomplicated mTBI group showed significantly worse performance compared to the control group (p = 0.022), while the complicated mTBI group did not significantly differ from either the control or uncomplicated mTBI group (all p > 0.05). However, we note that this is likely the result of the reduced statistical power provided by separating these groups, as the complicated and uncomplicated mTBI group performance overlapped considerably (see supplementary materials Figure S4).
Secondly, we examined resting EEG data alpha power and the TMS-EEG TEPs. Unfortunately, the cluster-based statistics we used to analyze the resting EEG data alpha power and the TMS-EEG TEPs are not appropriate to test ANOVA design statistics. To address this, we averaged the alpha power within the significant cluster from our primary analysis for each participant and submitted the averaged alpha power to a one-way ANOVA comparing the control group and the complicated and uncomplicated mTBI groups. This analysis did not demonstrate a significant effect of group, F(2, 51) = 2.725, p = 0.075, ηp2 = 0.093. However, we note that both mTBI groups showed a pattern of elevated alpha power compared to the control group in replication of our primary analysis, and that the null result is likely the result of the reduced statistical power provided by separating these groups (see supplementary materials Figure S5).
We undertook a similar analysis for the TEPs, averaging the P60 and N100 amplitudes within the significant clusters from our primary analyses for each participant. The one-way ANOVA comparing this averaged P60 amplitude across the control group and the complicated and uncomplicated mTBI groups showed a significant effect of group, F(2, 51) = 5.253, p = 0.008, ηp2 = 0.169. Post-hoc Tukey tests were conducted to determine the driver of this significant effect, which revealed that both the uncomplicated mTBI group and the complicated mTBI group showed lower P60 amplitudes compared to the control group (p = 0.025 and p = 0.029 respectively). The complicated and uncomplicated mTBI groups did not significantly differ from each other (p = 0.994). See supplementary materials Figure S6for a raincloud plot of this analysis.
Finally, the one-way ANOVA comparing the averaged frontal N100 amplitude across the control group and the complicated and uncomplicated mTBI groups showed a significant effect of group, F(2, 51) = 5.705, p = 0.006, ηp2 = 0.180. Post-hoc Tukey tests were conducted to determine the driver of this significant effect, which revealed that the uncomplicated mTBI group showed significantly larger (more negative) N100 amplitudes compared to the control group (p = 0.009), while the complicated mTBI group showed a trend toward significantly larger (more negative) N100 amplitudes compared to the control group (p = 0.052). The complicated and uncomplicated mTBI groups did not significantly differ from each other (p = 0.897). See supplementary materials Figure S7for a raincloud plot of this analysis.
Discussion
The current study comprehensively characterized the clinical, cognitive and neural impact of mTBI. A summary of all of our results can be viewed in . As expected, mTBI participants reported higher rates of post-concussive, depressive, anxious and fatigue symptoms than controls. Cognitively, the first trial of a verbal learning task, mTBI participant performance was significantly below that of age and gender matched controls, after controlling for premorbid IQ. Cortical activity changes were investigated with a variety of methods, including resting and task-based EEG and TMS-EEG. Overall, mTBI participants demonstrated increased alpha power at rest and altered cortical reactivity as measured via TMS-EEG. There were no significant correlations found between pathophysiology and the clinical/cognitive symptoms identified.
Table 4. A summary of the significant results reported in the study.
There are conflicting reports in the previous literature on mTBI of the presentation and persistence of symptoms and cognitive impairment. mTBI participants reported significantly greater symptoms on mood, fatigue and PCS measures compared to controls when assessed in the subacute phase. A history of pre-morbid psychopathology was carefully screened for and excluded, suggesting mood symptoms were not associated with preexisting psychiatric factors. However, levels of anxiety and depression symptoms were not, on average, in the clinically significant range. Cognitively, the mTBI group showed reduced performance an initial trial of the verbal learning task. Verbal learning deficits (as measured by reduced total immediate learning and delayed recall) are associated with moderate-severe TBI (Draper and Ponsford Citation2008) but have been less consistently demonstrated in mTBI (Albrecht et al. Citation2016; Ettenhofer and Abeles Citation2009). It has been suggested that the choice of verbal learning metric may mediate findings, with total immediate learning and delayed recall being insufficient to detect subtle deficits (Bigler Citation2008). Our mTBI group demonstrated impaired initial acquisition (i.e. the first learning trial) but comparable total recall, suggesting a slower rate of learning but equivalent performance across time. This may be due to reduced usage of efficient internally driven strategies that facilitate learning (Geary et al. Citation2010). Learning and memory are closely linked with attention, working memory and executive functioning (McCabe et al. Citation2010), suggesting it is possible that reduced initial acquisition may be mediated by fluctuating attention, reduced planning and strategy generation in mTBI participants. However, we note that our study did not provide behavioral evidence of fluctuating attention in the mTBI group, as CPT performance was essentially at ceiling for both groups. Commensurate performance on other cognitive measures, but increased fatigue, may reflect increased effort to maintain task performance in our mTBI group. Having established group level differences our study next looked to characterize relevant cortical activity changes.
Our mTBI group demonstrated greater right fronto-central alpha power during an eyes closed condition compared to control participants. This finding is somewhat inconsistent with previous literature, with greater delta and theta and reduced alpha power having been previously reported. However, the previous literature differs from our study - one study reported mTBI had occurred in the past 12 months (Gosselin et al. Citation2009), one used a military mTBI sample (Lewine et al. Citation2019) and another has been criticized for misclassifying moderate to severe injuries as mTBI (Korn et al. Citation2005). The dynamic nature of mTBI, neural changes evolving across recovery (Coyle et al. Citation2018; Eierud et al. Citation2014) and variability in findings based on injury severity, suggest our results may not be comparable due to divergent samples. Interpretation of our findings is further complicated by controversy regarding the functional significance of alpha power. Resting and task-related alpha has been associated with contradictory physiological and cognitive processes. The dominant theory links alpha oscillations to inhibitory function (Jensen and Mazaheri Citation2010), however, these conclusions have been drawn from studies predominantly focused on cognitive tasks (Jensen and Mazaheri Citation2010; Palva and Palva Citation2007; Sadaghiani et al. Citation2012). Physiologically, alpha activity originates from thalamo-cortical neurons (Lorincz et al. Citation2009) by means of GABA-ergic interneurons (Hughes et al. Citation2011). Resting state thalamo-cortical networks have been shown to be disrupted in mTBI (Tang et al. Citation2011) and thalamic damage has been hypothesized to contribute to impairments post mTBI (Grossman and Inglese Citation2016). As such, increased right fronto-central alpha power may be related to the underlying pathophysiology of mTBI, however further investigations are needed. Network based analyses, that investigate inter regional connectivity, are of relevance due to the diffuse nature of mTBI. Long-distance connectivity has been shown to be decreased and short-distance connectivity increased, suggesting changes to the functional architecture following mTBI (Cao and Slobounov Citation2010). Increases in connectivity in the frontal areas of the brain are hypothesized to reflect mechanisms compensating for structural connectivity losses (Palacios et al. Citation2013) or increased effort in recruiting the appropriate neural networks (Caeyenberghs et al. Citation2014). We used wPLI, a synchronization measure, to assess whole brain connectivity at rest. No differences between groups were demonstrated in the theta, alpha, beta or gamma bands. This is inconsistent with reported decreases in low-gamma frequency band (25-40Hz) (Wang et al. Citation2017) or increased gamma activity (30-45Hz) during a working memory task in mTBI (Bailey et al. Citation2017). Although our sample is comparable, differences in methodology may account for our differential findings. wPLI is a conservative measure of connectivity, and although it controls for false positives from volume conduction, it also may have failed to identify true differences between the groups by being overly rigorous.
We also recorded EEG during cognitive tasks. No differences were detected between the mTBI group and control group in a backwards digit span working memory task. This is not consistent with previous research demonstrating EEG abnormalities (which were only sometimes concurrent with reduced behavioral performance) during working memory tasks (Arakaki et al. Citation2018; Kaltiainen et al. Citation2019; Theriault et al. Citation2011). One potential explanation for our null result here is that the task used did not place sufficient demands on cognitive functions to reveal differences in behavior or neural activity between the mTBI and control groups. However, variability in task stimuli, cognitive load, method of data quantification and type of EEG measures limit comparisons with previous research. Our measure of neural response strength, global field power (GFP) is widely used in clinical neurophysiology as a parameter of total underlying brain activity (Bailey, Freedman et al., Citation2019; Bailey et al., Citation2014; Payne et al., Citation2020; Wang et al., Citation2020). No differences in pattern of activation (topography) were demonstrated. These results suggest that perhaps neural activity related to working memory is not altered in mTBI participants.
We also sought to assess inhibitory control and sustained attention using a continuous performance task (CPT), also known as a Go/No Go task. Our results did not show differences in GFP, a measure of neural response strength, or neural topographies, which is consistent with previous research in a group of mild-moderate TBI using an emotional Go/NoGo task paradigm (Bailey et al. Citation2014; Citation2015). Our task presented ‘Go’ and ‘No Go’ trials with 50% probability and an inter-stimulus interval of 900 ms, which may have insufficiently taxed response inhibition processes to discriminate between the groups. As a consequence, neither group may have been generating sufficient amplitudes of response inhibition processes for comparison of these processes (Wessel, Citation2018). The lack of behavioral differences may also be due to a ceiling effect in the behavioral data – as average performance in both groups was over 90% for ‘Go’ and ‘No Go’ stimuli.
The application of TMS over the left DLPFC with concurrent EEG is a promising approach to measuring neural activity in mTBI. Significantly greater right fronto-central N100 and smaller left parieto-occipital P60 and greater N100 amplitudes were demonstrated in mTBI participants compared to controls. TEPs are broadly considered a measure of cortical reactivity, with some evidence that the N100 amplitude may reflect, in part, GABAB mediated inhibition (Premoli et al. Citation2014). While the P60 component has been shown to be sensitive to changes in excitability (Voineskos et al., Citation2019). Our N100 finding is consistent with the single known study that has administered TMS outside of the motor cortex in mTBI. Tallus et al. (Citation2013) investigated TEP’s in symptomatic and asymptomatic mTBI participants on average five years since injury. Results demonstrated latency delays for early TEP components and higher N100 amplitudes in symptomatic participants, compared to asymptomatic and controls (Tallus et al. Citation2013). Changes were interpreted as suggestive of altered brain reactivity and connectivity in mTBI and possibly related to compensatory mechanisms of recovery. The smaller P60 and increased N100 amplitudes seen in mTBI suggest changes to synaptic excitation and inhibition, and the balance between the two, with likely consequences for neuronal signaling and communication.
However, it is currently unclear whether these changes reflect ongoing pathophysiology, compensatory reorganization or the early stages of recovery. Accurately characterizing how the balance of neural circuits underlies symptom recovery may assist in the development of diagnostic and prognostic indicators and improve our understanding of symptom heterogeneity post mTBI. We did not see any significant correlations between the measures of pathophysiology and the persistent clinical/cognitive symptoms identified. There are a number of possible reasons for this including, the analyses being underpowered, narrow inclusion of pathophysiologies and narrow focus on specific clinical/cognitive symptoms. A true lack of any association between pathophysiology and clinical/cognitive symptoms is unlikely, and this question requires further investigation with larger samples and broader inclusion of changes in cortical activity and symptomatology.
Several limitations should be noted. Regarding the characteristics of the sample used in the current study, we note that our sample included participants who had both positive and negative CT findings (as is common in samples of mTBI; Isokuortti et al., Citation2018; Stippler et al., Citation2012), and who attended a hospital emergency department after their head injury. As such, the results of our study could be considered to reflect findings from the more severe end of the mTBI spectrum. While the current sample was small when considering our sub-analysis of individuals with positive CT findings compared to individuals with negative CT findings we note that both the complicated and uncomplicated mTBI groups showed similar patterns of results across all of the measures that were significant in our main analyses, that the complicated and uncomplicated mTBI groups showed some common significant differences compared to controls, and these two subgroups did not significantly differ from each other in any measure that we assessed. Although mTBI groups can be difficult to recruit, making it difficult to recruit a sufficient sample size to analyze complicated and uncomplicated mTBI separately, this has been suggested to be best practice (Arciniegas, Citation2011). However, our sub-sample analysis suggested that the complicated and uncomplicated mTBI groups show more commonalities than differences. Future research with larger sample sizes may be able to provide more information on how the current findings are affected by the presence of hematoma, hemorrhage or fracture.
Approximately 50% of mTBI individuals sustained a concurrent injury in addition to their mTBI and 16.7% (n = 5) were taking analgesic medication. mTBI participants have been shown to report a similar number of PCS to trauma patients (Landre et al. Citation2006), suggesting pain, medication or other factors may be mediating their symptom report and cognitive performance. Use of orthopedic control groups has previously been recommended to help determine whether subjective symptoms are specific to the mTBI, and we recommend that future research include such a control group to ensure potential differences in behavior or neural activity results can be considered specific to mTBI. There is some evidence however, that cognitive findings are unrelated to pain intensity or mood disturbances (Carroll et al. Citation2014). A second limitation is that most participants were assessed in the medium (11-20 days) and long (21-31 days) time windows post injury, a period during which recovery rapidly occurs and symptoms resolve for most individuals with mTBI (McCrea et al. Citation2009). Therefore, group differences may have been more apparent if assessment had occurred closer to injury time and it is possible that individuals in the short (0-10 days) time window differed in symptoms and pathophysiology. Additionally, there may have been variability in recovery across the acute phase we sampled, with those individuals who were assessed at 11 days post-injury having recovered less than those who were assessed at 31 days post-injury.
Third, the control group had a higher level of education than the mTBI group and although we included pre-morbid IQ as a covariate, this difference may have mediated cognitive performance. In particular, the same number of practice trials was provided for all participants prior to their completion of the CPT task. If some participants were able to learn the task more quickly, this may have biased performance toward those participants. Instead, future research could provide participants with practice trials until a threshold level of performance is reached to ensure all participants understand the task equally before beginning. However, we do note that task performance was over 95% accurate on average. Regarding cortical activity measures, we used the F3 scalp location as an approximate landmark for the DLPFC, over which single pulse TMS was administered. Although this method has been shown to provide a relatively accurate estimate of the DLPFC (Rusjan et al. Citation2010), future research utilizing MRI-based neuro-navigational software could help to further increase accuracy when targeting this region. Lastly, cluster-based permutation tests are useful at identifying significant differences between groups. They do not, however, establish the brain region or time window of an effect, limiting the spatial and temporal inferences of reported differences.
The present study comprehensively characterized the multidimensional effect of mTBI in the sub-acute phase post injury, a broad range of clinical, cognitive and cortical activity consequences being reported. Collectively, the differences between mTBI and control groups may indicate neurophysiological markers of altered excitatory and inhibitory processes which impact neural signaling. Improved understanding of these factors and how they contribute to symptom heterogeneity could assist with the development of potential therapeutic targets.
Supplementary Material_Coyle_Bailey etal R3.docx
Download MS Word (597.1 KB)Disclosure statement
No potential conflict of interest was reported by the author(s).
Additional information
Funding
References
- Albrecht, M. A., Masters, C. L., Ames, D., & Foster, J. K, AIBL Research Group. (2016). Impact of Mild Head Injury on Neuropsychological Performance in Healthy Older Adults: Longitudinal Assessment in the AIBL Cohort. Frontiers in Aging Neuroscience, 8(105), 1–11. https://doi.org/10.3389/fnagi.2016.00105
- Arakaki, X., Shoga, M., Li, L., Zouridakis, G., Tran, T., Fonteh, A. N., Dawlaty, J., Goldweber, R., Pogoda, J. M., & Harrington, M. G. (2018). Alpha desynchronization/synchronization during working memory testing is compromised in acute mild traumatic brain injury (mTBI). PloS One, 13(2), e0188101. https://doi.org/10.1371/journal.pone.0188101
- Arciniegas, D. B. (2011). Clinical electrophysiologic assessments and mild traumatic brain injury: state-of-the-science and implications for clinical practice. International Journal of Psychophysiology: official Journal of the International Organization of Psychophysiology, 82(1), 41–52. https://doi.org/10.1016/j.ijpsycho.2011.03.004
- Bailey, N. W., Hoy, K. E., Maller, J. J., Segrave, R. A., Thomson, R., Williams, N., Daskalakis, Z. J., & Fitzgerald, P. B. (2014). An exploratory analysis of Go/Nogo event-related potentials in major depression and depression following traumatic brain injury. Psychiatry Research, 224(3), 324–334. https://doi.org/10.1016/j.pscychresns.2014.09.008
- Bailey, N. W., Hoy, K. E., Maller, J. J., Upton, D. J., Segrave, R. A., Fitzgibbon, B. M., & Fitzgerald, P. B. (2015). Neural evidence that conscious awareness of errors is reduced in depression following a traumatic brain injury. Biological Psychology, 106, 1–10. https://doi.org/10.1016/j.biopsycho.2015.01.011
- Bailey, N. W., Freedman, G., Raj, K., Sullivan, C. M., Rogasch, N. C., Chung, S. W., Hoy, K. E., Chambers, R., Hassed, C., Van Dam, N. T., Koenig, T., & Fitzgerald, P. B. (2019). Mindfulness meditators show altered distributions of early and late neural activity markers of attention in a response inhibition task. PloS One, 14(8), e0203096. https://doi.org/10.1371/journal.pone.0203096
- Bailey, N. W., Raj, K., Freedman, G., Fitzgibbon, B. M., Rogasch, N. C., Van Dam, N. T., & Fitzgerald, P. B. (2019). Mindfulness meditators do not show differences in electrophysiological measures of error processing. Mindfulness, 10(7), 1360–1380. https://doi.org/10.1007/s12671-019-1096-3
- Bailey, N. W., Segrave, R. A., Hoy, K. E., Maller, J. J., & Fitzgerald, P. B. (2014). Impaired upper alpha synchronisation during working memory retention in depression and depression following traumatic brain injury. Biological Psychology, 99, 115–124. https://doi.org/10.1016/j.biopsycho.2014.03.008
- Bailey, N. W., Rogasch, N. C., Hoy, K. E., Maller, J. J., Segrave, R. A., Sullivan, C. M., & Fitzgerald, P. B. (2017). Increased gamma connectivity during working memory retention following traumatic brain injury. Brain Injury, 31(3), 379–389. https://doi.org/10.1080/02699052.2016.1239273
- Belanger, H. G., Curtiss, G., Demery, J. A., Lebowitz, B. K., & Vanderploeg, R. D. (2005). Factors moderating neuropsychological outcomes following mild traumatic brain injury: A meta-analysis. Journal of the International Neuropsychological Society: JINS, 11(3), 215–227. https://doi.org/10.1017/S1355617705050277
- Benedict, R. H., Schretlen, D., Groninger, L., Dobraski, M., & Shpritz, B. (1996). Revision of the Brief Visuospatial Memory Test: Studies of normal performance, reliability, and validity. Psychological Assessment, 8(2), 145–153. https://doi.org/10.1037/1040-3590.8.2.145
- Benton, A. L., Hamsher, D. S., & Sivan, A. B. (1994). Controlled oral word association test. Archives of Clinical Neuropsychology.
- Bigler, E. D. (2008). Neuropsychology and clinical neuroscience of persistent post-concussive syndrome. Journal of the International Neuropsychological Society: JINS, 14(1), 1–22. https://doi.org/10.1017/S135561770808017X
- Bloom, B., Thomas, S., Ahrensberg, J. M., Weaver, R., Fowler, A., Bestwick, J., Harris, T., & Pearse, R. (2018). A systematic review and meta-analysis of return to work after mild traumatic brain injury. Brain Injury, 32(13-14), 1623–1636. https://doi.org/10.1080/02699052.2018.1532111
- Bowie, C. R., & Harvey, P. D. (2006). Administration and interpretation of the Trail Making Test. Nature Protocols, 1(5), 2277–2281. https://doi.org/10.1038/nprot.2006.390
- Broglio, S. P., Moore, R. D., & Hillman, C. H. (2011). A history of sport-related concussion on event-related brain potential correlates of cognition. International Journal of Psychophysiology: official Journal of the International Organization of Psychophysiology, 82(1), 16–23. https://doi.org/10.1016/j.ijpsycho.2011.02.010
- Caeyenberghs, K., Leemans, A., Leunissen, I., Gooijers, J., Michiels, K., Sunaert, S., & Swinnen, S. P. (2014). Altered structural networks and executive deficits in traumatic brain injury patients. Brain Structure & Function, 219(1), 193–209. https://doi.org/10.1007/s00429-012-0494-2
- Cao, C., & Slobounov, S. (2010). Alteration of cortical functional connectivity as a result of traumatic brain injury revealed by graph theory, ICA, and sLORETA analyses of EEG signals. IEEE Transactions on Neural Systems and Rehabilitation Engineering: a Publication of the IEEE Engineering in Medicine and Biology Society, 18(1), 11–19. https://doi.org/10.1109/TNSRE.2009.2027704
- Carroll, L. J., Cassidy, J. D., Cancelliere, C., Cote, P., Hincapie, C. A., Kristman, V. L., Holm, L. W., Borg, J., Nygren-de Boussard, C., & Hartvigsen, J. (2014). Systematic review of the prognosis after mild traumatic brain injury in adults: cognitive, psychiatric, and mortality outcomes: results of the International Collaboration on Mild Traumatic Brain Injury Prognosis. Archives of Physical Medicine and Rehabilitation, 95(3 Suppl), S152–S173. https://doi.org/10.1016/j.apmr.2013.08.300
- Carroll, L. J., Cassidy, J. D., Peloso, P. M., Borg, J., von Holst, H., Holm, L., Paniak, C., & Pépin, M, WHO Collaborating Centre Task Force on Mild Traumatic Brain Injury. (2004). Prognosis for mild traumatic brain injury: results of the WHO Collaborating Centre Task Force on Mild Traumatic Brain Injury. Journal of Rehabilitation Medicine, 36(43 Suppl), 84–105. https://doi.org/10.1080/16501960410023859
- Chistyakov, A., Soustiel, J., Hafner, H., Trubnik, M., Levy, G., & Feinsod, M. (2001). Excitatory and inhibitory corticospinal responses to transcranial magnetic stimulation in patients with minor to moderate head injury. Journal of Neurology, Neurosurgery, and Psychiatry, 70(5), 580–587. https://doi.org/10.1136/jnnp.70.5.580
- Conforto, A. B., Z'Graggen, W. J., Kohl, A. S., Rösler, K. M., & Kaelin-Lang, A. (2004). Impact of coil position and electrophysiological monitoring on determination of motor thresholds to transcranial magnetic stimulation. Clinical Neurophysiology: official Journal of the International Federation of Clinical Neurophysiology, 115(4), 812–819. https://doi.org/10.1016/j.clinph.2003.11.010
- Coyle, H. L., Ponsford, J., & Hoy, K. E. (2018). Understanding individual variability in symptoms and recovery following mTBI: A role for TMS-EEG? Neuroscience and Biobehavioral Reviews, 92, 140–149. https://doi.org/10.1016/j.neubiorev.2018.05.027
- De Beaumont, L., Lassonde, M., Leclerc, S., & Theoret, H. (2007). Long-term and cumulative effects of sports concussion on motor cortex inhibition. Neurosurgery, 61(2), 329–337. https://doi.org/10.1227/01.NEU.0000280000.03578.B6
- De Beaumont, L., Mongeon, D., Tremblay, S., Messier, J., Prince, F., Leclerc, S., Lassonde, M., & Théoret, H. (2011). Persistent motor system abnormalities in formerly concussed athletes. Journal of Athletic Training, 46(3), 234–240. https://doi.org/10.4085/1062-6050-46.3.234
- De Beaumont, L., Tremblay, S., Poirier, J., Lassonde, M., & Theoret, H. (2012). Altered bidirectional plasticity and reduced implicit motor learning in concussed athletes. Cerebral Cortex, 22(1), 112–121. https://doi.org/10.1093/cercor/bhr096
- Delorme, A., & Makeig, S. (2004). EEGLAB: an open source toolbox for analysis of single-trial EEG dynamics including independent component analysis. Journal of Neuroscience Methods, 134(1), 9–21. https://doi.org/10.1016/j.jneumeth.2003.10.009
- Dewan, M. C., Rattani, A., Gupta, S., Baticulon, R. E., Hung, Y.-C., Punchak, M., Agrawal, A., Adeleye, A. O., Shrime, M. G., Rubiano, A. M., Rosenfeld, J. V., & Park, K. B. (2018). Estimating the global incidence of traumatic brain injury. Journal of Neurosurgery, 130(4), 1080–1097. https://doi.org/10.3171/2017.10.JNS17352
- Dockree, P. M., & Robertson, I. H. (2011). Electrophysiological markers of cognitive deficits in traumatic brain injury: A review. International Journal of Psychophysiology: official Journal of the International Organization of Psychophysiology, 82(1), 53–60. https://doi.org/10.1016/j.ijpsycho.2011.01.004
- Draper, K., & Ponsford, J. (2008). Cognitive functioning ten years following traumatic brain injury and rehabilitation. Neuropsychology, 22(5), 618–625. https://doi.org/10.1037/0894-4105.22.5.618
- Eierud, C., Craddock, R. C., Fletcher, S., Aulakh, M., King-Casas, B., Kuehl, D., & LaConte, S. M. (2014). Neuroimaging after mild traumatic brain injury: review and meta-analysis. NeuroImage. Clinical, 4, 283–294. https://doi.org/10.1016/j.nicl.2013.12.009
- Ettenhofer, M. L., & Abeles, N. (2009). The significance of mild traumatic brain injury to cognition and self-reported symptoms in long-term recovery from injury. Journal of Clinical and Experimental Neuropsychology, 31(3), 363–372. https://doi.org/10.1080/13803390802175270
- Fitzgerald, D. B., & Crosson, B. A. (2011). Diffusion weighted imaging and neuropsychological correlates in adults with mild traumatic brain injury. International Journal of Psychophysiology: official Journal of the International Organization of Psychophysiology, 82(1), 79–85. https://doi.org/10.1016/j.ijpsycho.2011.02.011
- Geary, E. K., Kraus, M. F., Pliskin, N. H., & Little, D. M. (2010). Verbal learning differences in chronic mild traumatic brain injury. Journal of the International Neuropsychological Society: JINS, 16(3), 506–516. https://doi.org/10.1017/S135561771000010X
- Giza, C. C., & Hovda, D. A. (2014). The new neurometabolic cascade of concussion. Neurosurgery, 75(Suppl 4), S24–S33. https://doi.org/10.1227/NEU.0000000000000505
- Gosselin, N., Lassonde, M., Petit, D., Leclerc, S., Mongrain, V., Collie, A., & Montplaisir, J. (2009). Sleep following sport-related concussions. Sleep Medicine, 10(1), 35–46. https://doi.org/10.1016/j.sleep.2007.11.023
- Grossman, E. J., & Inglese, M. (2016). The Role of thalamic damage in mild traumatic brain injury. Journal of Neurotrauma, 33(2), 163–167. https://doi.org/10.1089/neu.2015.3965
- Haneef, Z., Levin, H. S., Frost, J. D., & Mizrahi, E. M. (2013). Electroencephalography and quantitative electroencephalography in mild traumatic brain injury. Journal of Neurotrauma, 30(8), 653–656. https://doi.org/10.1089/neu.2012.2585
- Hartman, D. E. (2009). Wechsler Adult Intelligence Scale IV (WAIS IV): return of the gold standard. Applied Neuropsychology, 16(1), 85–87. https://doi.org/10.1080/09084280802644466
- Hellewell, S. C., Beaton, C. S., Welton, T., & Grieve, S. M. (2020). Characterizing the risk of depression following mild traumatic brain injury: a meta-analysis of the literature comparing chronic mTBI to non-mTBI populations. Frontiers in Neurology, 11, 350. https://doi.org/10.3389/fneur.2020.00350
- Hughes, S. W., Lorincz, M. L., Blethyn, K., Kekesi, K. A., Juhasz, G., Turmaine, M., Parnavelas, J. G., & Crunelli, V. (2011). Thalamic gap junctions control local neuronal synchrony and influence macroscopic oscillation amplitude during EEG alpha rhythms. Frontiers in Psychology, 2(193), 1–13.
- Isokuortti, H., Iverson, G. L., Silverberg, N. D., Kataja, A., Brander, A., Öhman, J., & Luoto, T. M. (2018). Characterizing the type and location of intracranial abnormalities in mild traumatic brain injury. Journal of Neurosurgery, 129(6), 1588–1597. https://doi.org/10.3171/2017.7.JNS17615
- Jensen, O., & Mazaheri, A. (2010). Shaping functional architecture by oscillatory alpha activity: gating by inhibition. Frontiers in Human Neuroscience, 4, 186–186. https://doi.org/10.3389/fnhum.2010.00186
- Kaltiainen, H., Liljeström, M., Helle, L., Salo, A., Hietanen, M., Renvall, H., & Forss, N. (2019). Mild traumatic brain injury affects cognitive processing and modifies oscillatory brain activity during attentional tasks. Journal of Neurotrauma, 36(14), 2222–2232. https://doi.org/10.1089/neu.2018.6306
- Karr, J. E., Areshenkoff, C. N., & Garcia-Barrera, M. A. (2014). The neuropsychological outcomes of concussion: a systematic review of meta-analyses on the cognitive sequelae of mild traumatic brain injury. Neuropsychology, 28(3), 321–336. https://doi.org/10.1037/neu0000037
- Khanna, A., Pascual-Leone, A., Michel, C. M., & Farzan, F. (2015). Microstates in resting-state EEG: Current status and future directions. Neuroscience and Biobehavioral Reviews, 49, 105–113. https://doi.org/10.1016/j.neubiorev.2014.12.010
- Kinnunen, K. M., Greenwood, R., Powell, J. H., Leech, R., Hawkins, P. C., Bonnelle, V., Patel, M. C., Counsell, S. J., & Sharp, D. J. (2011). White matter damage and cognitive impairment after traumatic brain injury. Brain: a Journal of Neurology, 134(Pt 2), 449–463. https://doi.org/10.1093/brain/awq347
- Koenig, T., & Melie-Garcia, L. (2010). A method to determine the presence of averaged eventrelated fields using randomization tests. Brain Topography, 23(3), 233–242. https://doi.org/10.1007/s10548-010-0142-1
- Koenig, T., Kottlow, M., Stein, M., & Melie-García, L. (2011). Ragu: A Free Tool for the Analysis of EEG and MEG Event-Related Scalp Field Data Using Global Randomization Statistics. Computational Intelligence and Neuroscience, 2011, 938925–938914. https://doi.org/10.1155/2011/938925
- Korn, A., Golan, H., Melamed, I., Pascual-Marqui, R., & Friedman, A. (2005). Focal cortical dysfunction and blood-brain barrier disruption in patients with Postconcussion syndrome. Journal of Clinical Neurophysiology: official Publication of the American Electroencephalographic Society, 22(1), 1–9. https://doi.org/10.1097/01.wnp.0000150973.24324.a7
- Landre, N., Poppe, C. J., Davis, N., Schmaus, B., & Hobbs, S. E. (2006). Cognitive functioning and postconcussive symptoms in trauma patients with and without mild TBI. Archives of Clinical Neuropsychology: The Official Journal of the National Academy of Neuropsychologists, 21(4), 255–273. https://doi.org/10.1016/j.acn.2005.12.007
- Lavric, A., Pizzagalli, D. A., & Forstmeier, S. (2004). When 'go’ and 'nogo’ are equally frequent: ERP components and cortical tomography. The European Journal of Neuroscience, 20(9), 2483–2488. https://doi.org/10.1111/j.1460-9568.2004.03683.x
- Lehmann, D., & Skrandies, W. (1980). Reference-free identification of components of checkerboard-evoked multichannel potential fields. Electroencephalography and Clinical Neurophysiology, 48(6), 609–621. https://doi.org/10.1016/0013-4694(80)90419-8
- Lewine, J. D., Plis, S., Ulloa, A., Williams, C., Spitz, M., Foley, J., Paulson, K., Davis, J., Bangera, N., Snyder, T., & Weaver, L. (2019). Quantitative EEG biomarkers for mild traumatic brain injury. Journal of Clinical Neurophysiology: official Publication of the American Electroencephalographic Society, 36(4), 298–305. https://doi.org/10.1097/WNP.0000000000000588
- Lipton, M. L., Gulko, E., Zimmerman, M. E., Friedman, B. W., Kim, M., Gellella, E., Gold, T., Shifteh, K., Ardekani, B. A., & Branch, C. A. (2009). Diffusion-tensor imaging implicates prefrontal axonal injury in executive function impairment following very mild traumatic brain injury. Radiology, 252(3), 816–824. https://doi.org/10.1148/radiol.2523081584
- Lorincz, M. L., Kekesi, K. A., Juhasz, G., Crunelli, V., & Hughes, S. W. (2009). Temporal framing of thalamic relay-mode firing by phasic inhibition during the alpha rhythm. Neuron, 63(5), 683–696. https://doi.org/10.1016/j.neuron.2009.08.012
- Major, B. P., Rogers, M. A., & Pearce, A. J. (2015). Using transcranial magnetic stimulation to quantify electrophysiological changes following concussive brain injury: a systematic review. Clinical and Experimental Pharmacology & Physiology, 42(4), 394–405. https://doi.org/10.1111/1440-1681.12363
- Maris, E., & Oostenveld, R. (2007). Nonparametric statistical testing of EEG- and MEG-data. Journal of Neuroscience Methods, 164(1), 177–190. https://doi.org/10.1016/j.jneumeth.2007.03.024
- Mayer, A. R., Mannell, M. V., Ling, J., Gasparovic, C., & Yeo, R. A. (2011). Functional connectivity in mild traumatic brain injury. Human Brain Mapping, 32(11), 1825–1835. https://doi.org/10.1002/hbm.21151
- McCabe, D. P., Roediger, H. L., McDaniel, M. A., Balota, D. A., & Hambrick, D. Z. (2010). The relationship between working memory capacity and executive functioning: evidence for a common executive attention construct. Neuropsychology, 24(2), 222–243. https://doi.org/10.1037/a0017619
- McCrea, M., Iverson, G. L., McAllister, T. W., Hammeke, T. A., Powell, M. R., Barr, W. B., & Kelly, J. P. (2009). An Integrated Review of Recovery after Mild Traumatic Brain Injury (MTBI): Implications for Clinical Management. The Clinical Neuropsychologist, 23(8), 1368–1390. https://doi.org/10.1080/13854040903074652
- Miller, N. R., Yasen, A. L., Maynard, L. F., Chou, L. S., Howell, D. R., & Christie, A. D. (2014). Acute and longitudinal changes in motor cortex function following mild traumatic brain injury. Brain Injury, 28(10), 1270–1276. https://doi.org/10.3109/02699052.2014.915987
- Oldfield, R. C. (1971). The assessment and analysis of handedness: The Edinburgh inventory. Neuropsychologia, 9(1), 97–113. https://doi.org/10.1016/0028-3932(71)90067-4
- Oostenveld, R., Fries, P., Maris, E., & Schoffelen, J.-M. (2011). FieldTrip: Open Source Software for Advanced Analysis of MEG, EEG, and Invasive Electrophysiological Data. Computational Intelligence and Neuroscience, 2011, 156869–156869. https://doi.org/10.1155/2011/156869
- Opie, G., Foo, N., Killington, M., Ridding, M. C., & Semmler, J. G. (2019). TMS-EEG measures of cortical inhibition and neuroplasticity are altered following mild traumatic brain injury. Journal of Neurotrauma, 36(19), 2774–2784. https://doi.org/10.1089/neu.2018.6353
- Palacios, E. M., Sala-Llonch, R., Junque, C., Roig, T., Tormos, J. M., Bargallo, N., & Vendrell, P. (2013). Resting-state functional magnetic resonance imaging activity and connectivity and cognitive outcome in traumatic brain injury. JAMA Neurology, 70(7), 845–851. https://doi.org/10.1001/jamaneurol.2013.38
- Palacios, E. M., Yuh, E. L., Chang, Y. S., Yue, J. K., Schnyer, D. M., Okonkwo, D. O., Valadka, A. B., Gordon, W. A., Maas, A. I., Vassar, M., Manley, G. T., & Mukherjee, P. (2017). Resting-State functional connectivity alterations associated with six-month outcomes in mild traumatic brain injury. Journal of Neurotrauma, 34(8), 1546–1557. https://doi.org/10.1089/neu.2016.4752
- Palva, S., & Palva, J. M. (2007). New vistas for alpha-frequency band oscillations. Trends in Neurosciences, 30(4), 150–158. https://doi.org/10.1016/j.tins.2007.02.001
- Payne, J. R., Baell, O., Geddes, H., Fitzgibbon, B., Emonson, M., Hill, A. T., Van Dam, N. T., Humble, G., Fitzgerald, P. B., & Bailey, N. W. (2020). Experienced meditators exhibit no differences to demographically matched controls in theta phase synchronization, P200, or P300 during an auditory oddball task. Mindfulness, 11(3), 643–659. https://doi.org/10.1007/s12671-019-01287-4
- Perry, D. C., Sturm, V. E., Peterson, M. J., Pieper, C. F., Bullock, T., Boeve, B. F., Miller, B. L., Guskiewicz, K. M., Berger, M. S., Kramer, J. H., & Welsh-Bohmer, K. A. (2016). Association of traumatic brain injury with subsequent neurological and psychiatric disease: a meta-analysis. Journal of Neurosurgery, 124(2), 511–526. https://doi.org/10.3171/2015.2.JNS14503
- Premoli, I., Castellanos, N., Rivolta, D., Belardinelli, P., Bajo, R., Zipser, C., Espenhahn, S., Heidegger, T., Muller-Dahlhaus, F., & Ziemann, U. (2014). TMS-EEG signatures of GABAergic neurotransmission in the human cortex. The Journal of Neuroscience: The Official Journal of the Society for Neuroscience, 34(16), 5603–5612. https://doi.org/10.1523/JNEUROSCI.5089-13.2014
- Rapp, P. E., Keyser, P. D., David, O., Albano, A., Hernandez, R., Gibson, D. B., Zambon, R., Hairston, W. D., Hughes, J. D., Krystal, A., & Nichols, A. (2015). Traumatic brain injury detection using electrophysiological methods. Frontiers in Human Neuroscience, 9(11), 11. https://doi.org/10.3389/fnhum.2015.00011
- Riccio, C. A., Reynolds, C. R., Lowe, P., & Moore, J. J. (2002). The continuous performance test: a window on the neural substrates for attention? Archives of Clinical Neuropsychology, 17(3), 235–272. https://doi.org/10.1093/arclin/17.3.235
- Rogasch, N. C., Daskalakis, Z. J., & Fitzgerald, P. B. (2015). Cortical inhibition of distinct mechanisms in the dorsolateral prefrontal cortex is related to working memory performance: A TMS–EEG study. Cortex; a Journal Devoted to the Study of the Nervous System and Behavior, 64, 68–77. https://doi.org/10.1016/j.cortex.2014.10.003
- Rogasch, N. C., & Fitzgerald, P. B. (2013). Assessing cortical network properties using TMS-EEG. Human Brain Mapping, 34(7), 1652–1669. https://doi.org/10.1002/hbm.22016
- Rogasch, N. C., Sullivan, C., Thomson, R. H., Rose, N. S., Bailey, N. W., Fitzgerald, P. B., Farzan, F., & Hernandez-Pavon, J. C. (2017). Analysing concurrent transcranial magnetic stimulation and electroencephalographic data: A review and introduction to the open-source TESA software. NeuroImage, 147, 934–951. https://doi.org/10.1016/j.neuroimage.2016.10.031
- Rogasch, N. C., Thomson, R. H., Farzan, F., Fitzgibbon, B. M., Bailey, N. W., Hernandez-Pavon, J. C., Daskalakis, Z. J., & Fitzgerald, P. B. (2014). Removing artefacts from TMS-EEG recordings using independent component analysis: Importance for assessing prefrontal and motor cortex network properties. NeuroImage, 101, 425–439. https://doi.org/10.1016/j.neuroimage.2014.07.037
- Rohling, M. L., Binder, L. M., Demakis, G. J., Larrabee, G. J., Ploetz, D. M., & Langhinrichsen-Rohling, J. (2011). A meta-analysis of neuropsychological outcome after mild traumatic brain injury: re-analyses and reconsiderations of Binder et al. (1997), Frencham et al. (2005), and Pertab et al. (2009). The Clinical Neuropsychologist, 25(4), 608–623. https://doi.org/10.1080/13854046.2011.565076
- Rosenberg, S. J., Ryan, J. J., & Prifitera, A. (1984). Rey auditory‐verbal learning test performance of patients with and without memory impairment. Journal of Clinical Psychology, 40(3), 785–787. https://doi.org/10.1002/1097-4679(198405)40:3<785::AID-JCLP2270400325>3.0.CO;2-4
- Ruggeri, P., Meziane, H. B., Koenig, T., & Brandner, C. (2019). A fine-grained time course investigation of brain dynamics during conflict monitoring. Scientific Reports, 9(1), 3667. https://doi.org/10.1038/s41598-019-40277-3
- Rusjan, P. M., Barr, M. S., Farzan, F., Arenovich, T., Maller, J. J., Fitzgerald, P. B., & Daskalakis, Z. J. (2010). Optimal transcranial magnetic stimulation coil placement for targeting the dorsolateral prefrontal cortex using novel magnetic resonance image-guided neuronavigation. Human Brain Mapping, 31(11), 1643–1652. https://doi.org/10.1002/hbm.20964
- Ruxton, G. D. (2006). The unequal variance t-test is an underused alternative to Student’s t-test and the Mann–Whitney U test. Behavioral Ecology, 17(4), 688–690. https://doi.org/10.1093/beheco/ark016
- Sadaghiani, S., Scheeringa, R., Lehongre, K., Morillon, B., Giraud, A.-L., D'Esposito, M., & Kleinschmidt, A. (2012). α-band phase synchrony is related to activity in the fronto-parietal adaptive control network. The Journal of Neuroscience: The Official Journal of the Society for Neuroscience, 32(41), 14305–14310. https://doi.org/10.1523/JNEUROSCI.1358-12.2012
- Salmond, C. H., Menon, D. K., Chatfield, D. A., Williams, G. B., Pena, A., Sahakian, B. J., & Pickard, J. D. (2006). Diffusion tensor imaging in chronic head injury survivors: correlations with learning and memory indices. NeuroImage, 29(1), 117–124. https://doi.org/10.1016/j.neuroimage.2005.07.012
- Sharp, D. J., Scott, G., & Leech, R. (2014). Network dysfunction after traumatic brain injury. Nature Reviews. Neurology, 10(3), 156–166. https://doi.org/10.1038/nrneurol.2014.15
- Sheehan, D. V., Lecrubier, Y., Sheehan, K. H., Amorim, P., Janavs, J., Weiller, E., Hergueta, T., Baker, R., & Dunbar, G. C. (1998). The Mini-International Neuropsychiatric Interview (M.I.N.I.): the development and validation of a structured diagnostic psychiatric interview for DSM-IV and ICD-10. The Journal of Clinical Psychiatry, 59(Suppl 20), 22–33.
- Stippler, M., Smith, C., McLean, A. R., Carlson, A., Morley, S., Murray-Krezan, C., Kraynik, J., & Kennedy, G. (2012). Utility of routine follow-up head CT scanning after mild traumatic brain injury: a systematic review of the literature. Emergency Medicine Journal: EMJ, 29(7), 528–532. https://doi.org/10.1136/emermed-2011-200162
- Tallus, J., Lioumis, P., Hamalainen, H., Kahkonen, S., & Tenovuo, O. (2012). Long-lasting TMS motor threshold elevation in mild traumatic brain injury. Acta Neurologica Scandinavica, 126(3), 178–182. https://doi.org/10.1111/j.1600-0404.2011.01623.x
- Tallus, J., Lioumis, P., Hämäläinen, H., Kähkönen, S., & Tenovuo, O. (2013). Transcranial Magnetic Stimulation-Electroencephalography Responses in Recovered and Symptomatic Mild Traumatic Brain Injury. Journal of Neurotrauma, 30(14), 1270–1277. https://doi.org/10.1089/neu.2012.2760
- Tang, L., Ge, Y., Sodickson, D. K., Miles, L., Zhou, Y., Reaume, J., & Grossman, R. I. (2011). Thalamic resting-state functional networks: disruption in patients with mild traumatic brain injury. Radiology, 260(3), 831–840. https://doi.org/10.1148/radiol.11110014
- R Core Team. (2018). R: A Language and Environment for Statistical Computing. R Foundation for Statistical Computing. https://www.R-project.org/.
- Theriault, M., De Beaumont, L., Tremblay, S., Lassonde, M., & Jolicoeur, P. (2011). Cumulative effects of concussions in athletes revealed by electrophysiological abnormalities on visual working memory. Journal of Clinical and Experimental Neuropsychology, 33(1), 30–41. https://doi.org/10.1080/13803391003772873
- Tremblay, S., de Beaumont, L., Lassonde, M., & Theoret, H. (2011). Evidence for the specificity of intracortical inhibitory dysfunction in asymptomatic concussed athletes. Journal of Neurotrauma, 28(4), 493–502. https://doi.org/10.1089/neu.2010.1615
- Voineskos, D., Blumberger, D. M., Zomorrodi, R., Rogasch, N. C., Farzan, F., Foussias, G., Rajji, T. K., & Daskalakis, Z. J. (2019). Altered transcranial magnetic stimulation–electroencephalographic markers of inhibition and excitation in the dorsolateral prefrontal cortex in major depressive disorder. Biological Psychiatry, 85(6), 477–486. https://doi.org/10.1016/j.biopsych.2018.09.032
- Wang, C., Costanzo, M. E., Rapp, P. E., Darmon, D., Nathan, D. E., Bashirelahi, K., Pham, D. L., Roy, M. J., & Keyser, D. O. (2017). Disrupted gamma synchrony after mild traumatic brain injury and its correlation with white matter abnormality. Frontiers in Neurology, 8(571), 571. https://doi.org/10.3389/fneur.2017.00571
- Wang, M. Y., Freedman, G., Raj, K., Fitzgibbon, B. M., Sullivan, C., Tan, W.-L., Van Dam, N., Fitzgerald, P. B., & Bailey, N. W. (2020). Mindfulness meditation alters neural activity underpinning working memory during tactile distraction. Cognitive, Affective & Behavioral Neuroscience, 20(6), 1216–1233. https://doi.org/10.3758/s13415-020-00828-y
- Wessel, J. R. (2018). Prepotent motor activity and inhibitory control demands in different variants of the go/no-go paradigm. Psychophysiology, 55(3), 1–12. https://doi.org/10.1111/psyp.12871
- Xia, M., Wang, J., & He, Y. (2013). BrainNet Viewer: a network visualization tool for human brain connectomics. PloS One, 8(7), e68910. https://doi.org/10.1371/journal.pone.0068910
- Xiao, H., Yang, Y., Xi, J., & Chen, Z. (2015). Structural and functional connectivity in traumatic brain injury. Neural Regeneration Research, 10(12), 2062–2071. https://doi.org/10.4103/1673-5374.172328
- Yuh, E. L., Cooper, S. R., Mukherjee, P., Yue, J. K., Lingsma, H. F., Gordon, W. A., Valadka, A. B., Okonkwo, D. O., Schnyer, D. M., Vassar, M. J., Maas, A. I. R., & Manley, G. T, TRACK-TBI INVESTIGATORS. (2014). Diffusion tensor imaging for outcome prediction in mild traumatic brain injury: A TRACK-TBI study. Journal of Neurotrauma, 31(17), 1457–1477. https://doi.org/10.1089/neu.2013.3171
- Zalesky, A., Fornito, A., & Bullmore, E. T. (2010). Network-based statistic: Identifying differences in brain networks. NeuroImage, 53(4), 1197–1207. https://doi.org/10.1016/j.neuroimage.2010.06.041
- Zhou, S., & Yu, Y. (2018). Synaptic E-I balance underlies efficient neural coding. Frontiers in Neuroscience, 12, 46–46. https://doi.org/10.3389/fnins.2018.00046