
 ?Mathematical formulae have been encoded as MathML and are displayed in this HTML version using MathJax in order to improve their display. Uncheck the box to turn MathJax off. This feature requires Javascript. Click on a formula to zoom.
Abstract
Abstract—The new financing landscape for the Sustainable Development Goals has a larger emphasis on domestic resource mobilization. But, given the significant role of donor assistance for health, the fungibility of government health spending, and the downward revision of global growth, this article looks at what is possible with regard to a country's own ability to finance priority health services. Using cross-sectional and longitudinal economic and health spending data, we employ a global multilevel model with regional and country random effects to develop gross domestic product (GDP) projections that inform a dynamic panel data model to forecast health spending. We then assess sub-Saharan African countries' abilities to afford to finance their own essential health needs and find that there are countries that will still rely on high out-of-pocket or donor spending to finance an essential package of health services. To address this, we discuss policy opportunities for each set of countries over the next 15 years. This longer-term view of the economic transition of health in Africa stresses the imperative of engaging policy now to prioritize customized strategies and institutional arrangements to increase domestic financing, improve value for money, and ensure fairer and sustainable health financing. We address the need for rhetoric on UHC to incorporate “progressive pragmatism,” a proactive joint approach by developing country governments and their development partners to ensure that policies designed to achieve universal health coverage align with the economic reality of available domestic and donor financing.
INTRODUCTION
Over the last 50 years, the world has seen unprecedented economic growth corresponding with significant global progress in health outcomes and life expectancy. This economic growth has enabled the economic transition of health, leading to the expectation that growing economies can and will increase their own domestic resources to finance their health sector.
In the sub-Saharan African (SSA) context, much progress has been made on health and economic indicators. But this region continues to face many health and health financing challenges. Relative to other regions, SSA faces a higher all-cause burden of disease and relies more on donors to finance their health sector.
The global development community committed to enhance domestic resource mobilization to achieve the Sustainable Development Goals (SDGs), which includes the target of achieving universal health coverage (UHC) through the Addis Ababa Action Agenda. This article reviews the trends from 1995 to the present and assesses the feasibility of financing UHC in SSA now and by 2030. We then present policy options to address the efficiency and effectiveness of domestic financing in an era of flat-lined or declining donor assistance for health.
METHODOLOGY
This section describes the composition of health expenditures from 1995 to 2013 and lays out steps for estimating the future financial feasibility of affording an essential package of health services (EPHS), a cost-effective basic package of health interventions designed to meet a country's health needs. We discuss the different modeling approaches that can be used as the basis for forecasting national income and health expenditures. Finally, we compare health expenditure forecasts to normative targets for health spending.
We use data from the World Health Organization's Global Health Expenditure Database for health financing indicators, the International Monetary Fund's World Economic Outlook (IMF-WEO) for macroeconomic forecasts, the World Bank's World Development Indicators database for World Governance Indicators as well as country demographic information, the United Nations population forecasts, and the Institute for Health Metrics and Evaluation's data on donor assistance for health (see for summary data).Citation1-4
Health Expenditure Data
Data on public spending from the World Health Organization's Global Health Expenditure database overestimate government sources of spending due to the role of on-budget donor support. Therefore, in order to determine government expenditure net of donor assistance for health (DAH), we extract our estimates of the percentage of DAH allocated to government and nongovernment entities, available from the Institute for Health Metrics and Evaluation.
Determinants of Health Spending and Income Elasticities of Health
Estimates of income elasticities of health spending in the Organization for Economic Cooperation and Development (OECD) vary based on the functional form and the level of aggregation. Analyses at the household levels can yield income elasticities near zero.Citation5 Estimates with longitudinal and/or cross-national data will also vary based on the countries and years included. A study of OECD countries found that a 1% increase in national income was associated with health care spending increases between 1.1% and 1.5%.Citation6 Less work has been completed to estimate income elasticities for total and government health spending in developing countries but similar challenges regarding functional form, relying on fixed effect models and to a lesser extent dynamic panel models, will yield different estimates.Citation7-11 Only one study has modeled out-of-pocket health spending.Citation11
We estimate income elasticities of total health expenditures, domestic resources, out-of-pocket spending, and government spending based on pooled ordinary least squares (OLS), fixed effects, and dynamic panel models for SSA countries. We also modeled the inclusion of explanatory variables such as institutional indicators such as world governance indicators, demographic variables such as the population over 65, a resource-rich dummy variable,Footnote[a] and tax revenues as a share of gross domestic product (GDP).
We look at the inclusion of interaction terms for income groups in order to test the differences in the composition of health spending between low-income countries (LICs) and lower-middle-income countries (LMICs). We also employ a dynamic panel model with AR(1) with and without controls. The dynamic panel model with AR(1) without controls (model 3) is represented as follows:
The dynamic panel model with AR(1) with income and an interaction term with income groupings as key explanatory variables is as follows:
where represents log health expenditures (i.e., total, government, out-of-pocket, and domestic)
A dynamic panel data model with an internal instrumental variable with and without institutional and demographic variables (models 4 and 5, respectively) using the year 1 lag, , was estimated. Model 5 formed the basis for projecting health expenditures, as discussed in the next section.Footnote[b]
Projecting Income and Health Expenditures
In order to project health expenditure trajectories over the long run according to the above-mentioned model, we project real gross national income (GNI) per capita in constant 2011 international dollar terms (purchasing price parity [PPP]).
Real GNI is projected based on real GDP projections after fitting a global multilevel model with regional and country random effects.Footnote[c]
where is real GNI per capita for country
, in region
at time
, and
captures a global time trend for real GNI. The elasticity of GNI to GDP (per capita) is captured by
where
is a global parameter and
is a regional specific effect for SSA. Country-specific and regional-specific effects are captured by
and
, respectively, and
is an idiosyncratic mean zero disturbance term.
In order to estimate this model, we derive projections for real GDP until 2030. We take the IMF-WEO projections for real GDP between 2014 and 2020, which is the longest available horizon. We assume that real GDP projections over this horizon are closing the output gap; that is, the projected output for 2020 is equal to the countries' potential outputs. We also assume that real output can be modeled following a simple Solow model with an aggregate production function exhibiting constant returns to scale:where
represents total factor productivity,
the capital stock, and
the stock of labor in the economies. Following a commonly used assumption in the growth accounting literature, we set the labor share parameter at
. Still following the growth literature, we further assume that total factor productivity (
) and the growth of capital (
) are constant at steady state so that we have
. As a result, real GDP growth projections can be derived as
and we use the United Nations Department of Economic and Social Affairs (UN-DESA) projections for population growth
. UN-DESA population projections are also used to derive per capita series for GDP and GNI.
RESULTS
In the past 20 years, robust economic growth has led to the economic transition of 16 SSA countries; 11 SSA countries graduated from low-income to lower-middle-income country status. Country income status is defined by the per capita GNI thresholds established by the World Bank for each year. Despite downward revisions in global economic growth, the IMF still projects that in the short term the region will see economic growth rates hovering around 4%.Citation12 The economic transition of health implies that developing countries will reach a point where they can fund an essential package of cost-effective health services and support health systems that are capable of substantially reducing each country's disease burden through economic growth and its associated increases in domestic health expenditures.
The role and expectations of DAH introduce a kink in health expenditure composition in which the presence of DAH affects the relative share of government and out-of-pocket health spending. Evidence suggests that donor assistance is associated with partial to full displacement of government spending.Citation13-15 In the SSA context, this dynamic is critical because donor financing comprises a large share of total health spending. DAH to SSA increased from 1.3 billion USD in 1990 to 11.9 billion USD in 2012.Citation2 In 1995, DAH exceeded government spending in five SSA countries; in 2011, the number was 17.
In the context of transition, we would expect that as aid recipient economies grow, their governments will increase their own financial responsibilities for their own programs as donors decrease assistance. In SSA, LMICs rely on DAH to a lesser extent than LICs, on average in 2011 (14% of total health expenditure [THE] versus 38% of THE). Though we do see increases in public and overall domestic financing as countries transition from LIC to LMIC, one disturbing trend is the more rapid increase in the share of out-of-pocket expenditures. shows that SSA governments were unable to fully make up for the decrease in DAH as their countries grew from LICs to LMICs. Instead, out-of-pocket spending, which can be a regressive barrier to accessing health services, increased at a faster rate than government spending. Changes in government spending are subject to the timeline of the budget process and therefore cannot be as responsive to income shocks relative to out-of-pocket spending. Furthermore, the health sector must compete with other government priorities, and its success on that front is subject to a credible case to ministries of finance that the health sector is able to make effective use of public resources.
FIGURE 1. Government Spending Grows Slower Than Out-of-Pocket Spending as Countries Transition. Note: Countries that stayed low income are countries that were categorized as low income throughout 1995 to 2011. Countries that grew to middle-income country status were countries that transitioned from low- or lower-middle-income country status to a higher middle-income country status. Other MICs refers to middle-income countries that stayed in their middle-income country group.
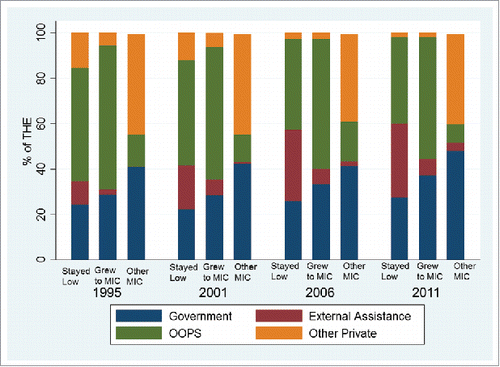
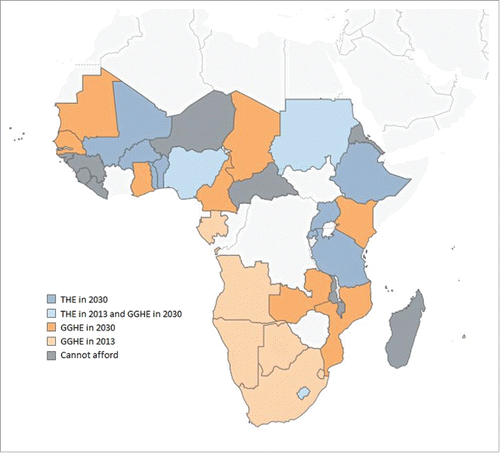
FIGURE 2. Countries in Sub-Saharan Africa that Can Afford an EPHS. Note: THE = Total Health Expenditure; GGHE = General Government Health Expenditure. The beige colored countries could afford an EPHS in 2013 from GGHE and are forecasted to continue to afford one by 2030 from GGHE. The light blue countries could afford an EPHS in 2013 from their THE and are forecasted to afford an EPHS from GGHE by 2030. Orange countries will afford an EPHS by 2030 from GGHE. Blue countries will afford an EPHS by 2030 from total health spending. The gray countries will not be able to afford an EPHS by 2030
The mix of donor financing and these challenges to increasing public financing in the health sector have resulted in limited public funding for the health sector to the detriment of financial protection. Commitments to increase public financing for the health sector such as the Abuja declaration target of spending 15% of the government revenues on health have fallen by the wayside in many SSA countries. Only eight SSA countries have achieved the target in 2011, a potential overestimate given the role of on-budget donor assistance.
In the presence of the lag of health expenditure, per capita GDP, variables such as the population over 65, world governance indicators, reliance on natural resource revenues,Footnote[d] and tax revenuesFootnote[e] as a percentage of GDP were not efficient or statistically significant explanatory variables. Models 1–4 provide results that are inclusive of explanatory variables such as the population over 65 and world governance indicators (see Table 2). Model 5 represents a parsimonious model with only the lag expenditure variable and income grouping interacted with log per capita GDP as explanatory variables. The pattern of income elasticity of total health spending across income group shows that total health spending in lower-middle-income SSA countries is less income responsive than LICs in the fixed effects and dynamic panel data models (see Table 2). LMICs increase their rate of health spending more slowly than do LICs in response to an increase in per capita GDP. For a 1% increase in income, LICs increase their total health spending by about 1.1% to 1.3%. Income elasticity of total health spending among LMICs is unitary. Upper-middle- and high-income countries see a much sharper increase in health spending in response to increases in GDP.
In the fixed effects and dynamic panel data model (see ), the elasticity of government health spending showed a pattern of high income responsiveness for LICs followed by a relative decrease in income responsiveness for LMICs. The results of the fixed effects and dynamic panel data models were mixed with regard to the rate of increase of out-of-pocket spending among LMICs relative to LICs. However, this analysis does not test whether or not the transition from LIC to LMIC status causes a shock leading to a temporary increase in the income elasticity of out-of-pocket spending relative to the income elasticity of public spending.
MEETING NORMATIVE TARGETS: CAN AFRICA AFFORD AN ESSENTIAL PACKAGE OF HEALTH SERVICES BY 2035?
The global health community has through various efforts developed normative targets around how much countries should spend on health, such as through the Abuja declaration and priority-setting exercises focused on the EPHS, a cost-effective basic package of health interventions to meet a country's health needs. One of the most recent efforts was in 2009, when under International Health Partnership (IHP+), the Taskforce on Innovative Financing of Health Systems estimated that an EPHS costing 54 USD per capita on average could save almost five million lives by 2015. This estimate includes the cost of expanding health systems, addressing noncommunicable diseases, as well as conditions targeted by the health Millennium Development Goals.Citation16 The Chatham House updated this target with a recommended threshold of 86 USD per capita target for government health expenditures combined with a recommendation that government health expenditures account for 5% of GDP.Citation17
As illustrates, few SSA country governments could afford such an essential package as of 2013 from their own general government health expenditures (GGHE) or total health expenditures. Given the trajectory in economic growth, we examine the prospects for financing an EPHS based on the Chatham House estimate and of meeting the recommended 5% of GDP estimate based on government health expenditures.
In reality, many countries have their own nationally defined EPHS that vary in the depth and breadth of services, with different resource requirements (e.g., human resources, drugs, and other commodities) and associated costs. The contents of these packages may reflect different technical considerations such as disease priorities or different political realities that are specific to each country. Regardless, the average cost of the universally defined EPHS serves as a benchmark for measuring the capacity of countries to afford essential services of all of their citizens.
Projections from our parsimonious dynamic panel model with an instrumental variable (model 5) were made using the projections on income in order to determine when and whether countries would hit the post of affording an EPHS. These are not intended to predict the component levels of spending in 2030. Figure 2 shows which SSA countries can afford an EPHS from GGHE or total country health expenditures in 2013 and in 2030. The figures show that by 2030, 19 of 39 countries with data may be able to afford to meet a threshold of 86 from GGHE, assuming no inflation in the cost of an EPHS (see ). This increases to 28 countries if we assess affordability by looking at total health spending, assuming no inflation in the cost of an EPHS. As of 2013, only seven countries could afford the cost of an EPHS from GGHE. But no countries could meet both the 86 USD per capita and the 5% of GDP public health spending target by 2030.
This assumes that the costs of the EPHS do not grow. However, the costs of health care services tend to grow at a faster rate than GDP growth. The evidence of this in SSA is limited but, in South Africa, between 2001 and 2012 medical inflation grew at about 2% higher than headline inflation.Citation18 If we assume the cost of an EPHS increases at 1%–3% per year over headline inflation, the number of countries that can afford an EPHS for its entire population falls slightly for each spending category (see ).
One alternative approach to forecasting based on modeling health expenditures based on its determinants and lag expenditure variables is the use of ensemble models. Though ensemble modeling combines different models without favoring one approach over another, our decision to base our forecasts on a best model is due to our grounding of the modeling of GDP growth and total health spending on the Solow model and the empirical relationship between economic development and health spending as articulated in the economic transition of health. Component parts of health spending may, however, benefit from an ensemble modeling approach. Dieleman et al. take an ensemble model approach to forecasting health spending that results in estimates that do not differ much from our own.Citation19 Our modeling strategy to forecast GDP and GNI differs from the approach used in Dieleman et al.Citation19 Though Dieleman et al.Citation19 rely on time series modeling by specifying an autoregressive integrated moving average model, we choose instead to follow a standard Solow-Swan cross country structural growth model. Though cross-country growth regressions have clearer theoretical underpinnings, the out-of-sample forecasting performance of both approaches is usually very similar.Citation20
DISCUSSION
With current trajectories of health spending and economic growth, many governments in SSA will not be able to afford the price tag of UHC, the costs of a universally defined EPHS by 2030. For many countries that can afford it, out-of-pocket spending will continue to constitute a significant portion of domestic resources. In an era of declining or stagnating DAH, the potential entrance of new donors with different priorities, and an expectation of increased domestic financing over the next 20 years, the influence from traditional donors on setting priorities may change. Thus, in this evolving context, these countries' long-term strategies will require focusing on building country capacity and institutions to better manage their health systems in tandem with short-term gains in health service coverage and outcomes through country-specific EPHS. As country incomes grow, both the customized package of services and mix of financing options can be broadened through “progressive pragmatism” on the path to universal health coverage. We address the need for rhetoric on UHC to incorporate progressive pragmatism, a proactive joint approach by developing country governments and their development partners to ensure that policies designed to achieve UHC align with the economic reality of available domestic and donor financing. It acknowledges that the path to UHC will not always be smooth or continuous. Therefore, both countries and donors should be willing to adjust and adapt to the sociopolitical reality at the national and global level. Following our analysis we discuss plausible scenarios in each set of countries and provide a basis for customizing DAH. This discussion considers three different categories of countries based on our analysis of countries' abilities to finance an EPHS from their own resources now and by 2030:
Current middle-income countries (MICs) that can afford the EPHS today and in the future still face a number of challenges, including governance, income inequality, and variations in the quality of health policies and the execution of those policies. The set of policy interventions in these countries will vary from those for countries in the other categories. For resource-dependent countries, now is an opportune time to promote strengthening of governance reforms. Increases in resource-based revenue in SSA, namely, among oil producers, have been the largest driver of increases in tax revenues in SSA since the 1980s.Citation12 With the recent declines in commodity prices, the economic prospects of these countries present an opportunity and imperative for strengthening non-resource-based tax systems, including public financial management, efficiencies in spending, etc.
Current LICs that will graduate to LMICs face a double challenge with respect to health financing. Economic growth will provide an opportunity to expand government revenues, but it will make these countries ineligible for DAH and other forms of concessionary financing, so they will lose significant financing for health, and their poorly developed domestic resource mobilization strategies mean that most of the growth in the health economy will be financed by out-of-pocket spending. These countries need to (1) create conditions for extension/bridge financing from DAH (grants and concessional loans) and (2) expand domestic revenue generation, pooling, and purchasing capacity. They will also experience expansion of their health economies in sync with economic growth, with challenges related in some places to curtailing excessive fragmentation in the insurance industry (providing a common regulatory regime with strong public sector stewardship), managing rational purchasing capacity, and securing cost-effective and high-quality delivery systems. Donors could begin to shift their focus away from direct service delivery in favor of supportive analytics that inform countries' decision making and implementation of prepaid financing systems that can pay for their EPHS.
Finally, there are the countries that cannot afford to pay for the EPHS from domestic resources, even by 2030. Here the choices become a lot more difficult. If they aspire to pay for EPHS in the context of UHC, these countries will continue to need a lot of donor assistance and their tendency will be to invest in other sectors to fuel economic growth. If globally endorsed targets for UHC are to be achieved,Citation21 SSA countries and donors need to consider five options depending on the trajectory of their health financing prospects from domestic and donor sources. These options are not mutually exclusive and solutions should take into consideration a mix of options based on the above categories related to whether or not countries would be able to finance the costs of an EPHS now and by 2030 from their own domestic resources. These options address the ways in which donors and countries can jointly work together to improve the efficiency, sustainability, and the use of existing resources while minimizing the substitution of domestic for donor health financing.
Negotiate long-term commitments to high levels of per capita DAH to ensure sustainability of spending through financing that is allocated through an evidence-based process, targets priority diseases and populations, and assures accountability of management. Under the right political environment, this can be done with acknowledgement of the continued trends in government substitution of DAH for government health expenditures.
Strategically link DAH to domestic financing commitments, in order to ensure a more explicit transfer to greater domestic financing. This is probably more feasible where DAH takes various forms of performance-based funding, instead of more traditional input-based funding. They can also agree on the principle of increasing the cost of borrowing in line with country capacity to repay, such that LICs get mostly grants or concessional credits, whereas MICs get mostly credits and loans. This is already the case for multilateral development banks and merits consideration by other large financiers.
Modify at least part of the DAH that is focused on providing direct grants that are subject to the substitution effect, by exploring options that increase the purchasing power of government health expenditures through off-budget supranational price subsidies for critical health technologies or commodities, which countries can then buy. How ministries of finance will respond to such mechanisms is unknown, but it could be more effective than the status quo.
Achieve efficiencies in donor-financed health spending and programs including through scale efficiencies in pooled procurement at regional and global levels and scalable innovations in public–private partnerships that use domestic private sector supply chains to improve the reach and efficiency of service delivery, particularly for the last mile.
Build more direct links to both traditional and new domestic resource mobilization as well as achieving greater efficiencies in the purchasing of value-added interventions and their delivery.
The worst-case scenario may occur if traditional donors suddenly withdraw without replacement from new donors, economic growth across SSA fails to be realized, and the void is filled with out-of-pocket spending. There is an opportunity now to support a much more efficient and equitable transition from DAH dependence to prepaid, pooled domestic financing. This will be challenging in many SSA countries, especially where large parts of the economy are informal and institutional capacities are weak, but it must start now.
Achieving the unfinished Millennium Development Goals agenda and reaching the ambitious Sustainable Development Goals set for health will require a dramatic increase in financing from both domestic and international sources. In many low- and middle-income-countries, the potential to increase government revenues through broadening the tax base and through improving the efficiency of tax collection is important. Donors' global commitments through the Addis Ababa Action Agenda will help support these efforts to translate economic growth into greater government revenues and resources for the health and other social sectors.
The role of DAH in the health transition financing is evolving toward a model where external assistance is seen as a catalytic resource, especially for countries graduating to middle-income status. For many low-income countries, continued DAH will remain an important source of funding for health. As countries transition from LIC to MIC status, their eligibility for International Development Association concessional loans also evolves gradually toward a mix of concessional and nonconcessional loans (blend countries). The Vaccine Alliance also explicitly introduced a policy for progressive graduation with a higher income threshold compared to the limit defining the LIC and MIC income categories according to the World Bank classification. The Global Fund, in partnership with other agencies, is also considering an updated country graduation process from external assistance for health through the Equitable Access Initiative. Graduation criteria, if strictly observed, can arguably avoid perverse incentives for a country to not meet jointly agreed upon obligations. Soft graduation criteria may lead countries to believe that donors will keep making grants regardless of whether the countries meet their own financing commitments under agreed criteria. Large donors bring a mix of on-budget and off-budget support with an increase in investments in analytics that are integrated into co-convened policy discussions alongside different government and country stakeholders such as ministries of finance and health, social security and labor, and other health institutions. These options can improve the sustainability, equity, and efficiency of health financing systems.
TABLE 1. Summary Data for SSA Countries.a
aSample averages. Standard errors are in parentheses. LIC = low-income country; LMIC = lower-middle-income country; UMIC = upper-middle-income country; HIC = high-income country
TABLE 2. Summary of Elasticity Output. aOLS and fixed effects show strong explanatory power. There is no analog to the R2 for the dynamic panel data. A pseudo−R2 is calculated for the dynamic panel data. Standard errors in parentheses. Country-level clustering of standard errors. PC = per capita; LIC = low-income country; LMIC = lower-middle-income country; UMIC = upper-middle-income country; HIC = high-income country. *p < 0.1. **p < 0.05. ***p < 0.01
TABLE 3. Countries That Can Afford an EPHS Based on Different Inflation Assumptions by 2035
DISCLAIMER
The opinions expressed in this article are the author's own and do not reflect the view of the United States Agency for International Development or the US government.
DISCLOSURE OF POTENTIAL CONFLICTS OF INTEREST
There are no conflicts of interest.
Notes
[a] The IMF identified ten countries based on 2006 to 2010 data of government revenues coming from natural resources, defined as having over 20% of their government revenues sourced from natural resources. These static data does not provide time-varying information needed to compute the effects of resource dependence on health spending. Longitudinal data on natural resource rents as a percentage of GDP approximates fiscal dependence on resources. Using a cutoff point of 15% of GDP, we develop a resource dummy variable to estimate the health spending behavior of resource-rich countries. On average, fiscally dependent resource-rich countries are richer, but they spend more out of pocket, rely less on donor assistance, and have worse voice and accountability and government effectiveness indicators than their non-resource-rich counterparts.
[b] The lag health expenditure variable captured the explanatory power, resulting in nonsignificant and inconsistent impact of these explanatory variables. Results are available upon request.
[c] We chose a random effect model specification because we are interested in the population-level regional effects, and the random effects model explicitly allows us to generate the region-specific means ( +
) distribution. This distribution would not be specified under a fixed effect model (see Ref. Citation22). We also performed a Hausman test that could not reject the equality between fixed and random effects coefficients.
[d] For resource-rich countries, we estimated a dynamic panel data model with a resource dummy interaction with log per capita GDP. Relative to non-resource-rich countries, income elasticity of total and government health spending is less and the income elasticity of out-of-pocket spending is slightly larger.
[e] We included tax revenues as a percentage of GDP in the analysis. Note that this resulted in a 56% loss in the sample data given the limited availability of longitudinal and cross-sectional tax revenue data. Two-sample t testing found that countries without data on tax revenue as a percentage of GDP tended to have smaller populations. Average per capita GDP and per capita total health spending tended to be higher for countries with data relative to countries without data, but these differences were not statistically significant. Including this proxy for fiscal space in the analysis did not alter the estimates for our key parameters of interest. In addition, this variable appeared significantly different from zero with a positive coefficient in most specifications, suggesting that health expenditure increases as fiscal space expands. This is consistent with a recent study conducted by the United States Agency for International Development that found that as fiscal space increases, government spending on health increases, particularly in low-income countries. However, when tax revenue as a percentage of GDP was interacted with per capita GDP or income group (LIC, LMIC, upper-middle-income country), the interaction was positive but not statistically significant. This suggests that the income elasticity of health is not necessarily higher when a country's fiscal effort is higher.
REFERENCES
- International Monetary Fund. World economic outlook database: April 2015 edition. Washington (DC): International Monetary Fund; 2015 [accessed 2015 Jun 15]. http://www.imf.org/external/pubs/ft/weo/2015/01/weodata/index.aspx
- Institute of Health Metrics and Evaluation. Donor assistance to health through government and non-government. Seattle (WA): Institute of Health Metrics and Evaluation; 2013.
- World Health Organization. Global health expenditure database. Geneva (Switzerland): World Health Organization; March 2015 [accessed 2015 Jun 15]. http://apps.who.int/nha/database
- World Bank Group. World Development Indicators. Washington (DC): World Bank; April 2015 [accessed 2015 Jun 15]. http://data.worldbank.org/data-catalog/world-development-indicators
- Chernew M, Newhouse J. Health care spending growth. In: Pauly M, Mcguire T, Barros P, editors. Handbook of health economics. Waltham (MA): Elsevier; 2012. p. 2–44.
- Gerdtham U, Jönsson B. International comparisons of health expenditure: theory, data and econometric analysis. In: Culyer AJ, Newhouse JP, editors. Handbook of health economics. Amsterdam (The Netherlands): Elsevier; 2000. p. 11–53.
- Farag M, Wallack S, Nandakumar AK, Hodgkin D. The income elasticity of health care spending in developing and developed countries. Int J Health Care Finance Econ. 2012;2: 145–162.
- Tandon A, Fleisher L, Li R, Yap WA. Reprioritizing government spending on health: pushing an elephant up the stairs? Washington (DC): World Bank; 2014. HNP Discussion Paper 85773.
- Liang L, Mirelman A. Why do some countries spend more for health? An assessment of sociopolitical determinants and international aid for government health expenditures. Soc Sci Med. 2014;114:161–168.
- Fan V, Savedoff W. The health financing transition: a conceptual framework and empirical evidence. Soc Sci Med. 2014;105:112–121.
- Xu K, Saksena P, Holly A. The determinants of health expenditure: a country-level panel data analysis. Geneva (Switzerland): World Health Organization; 2011.
- World Bank Group. Global economic prospects: spillovers amid weak growth. Washington (DC): World Bank; 2016.
- Lu C, Schneider MT, Gubbins P, Leach-Kemon K, Jamison D, Murray CJ. Public financing of health in developing countries: a cross-sectional systematic analysis. Lancet. 2010;35:1375–1387.
- Farag M, Nandakumar AK, Wallack SS, Gaumer G, Hodgkin D. Does funding from donors displace government spending for health in developing countries? Health Aff. 2009;28:1045–1055.
- Dieleman J, Graves C, Hanlon M. The fungibility of health aid: reconsidering the reconsidered. J Dev Stud. 2013;49:1755–1762.
- Taskforce on Innovative International Health Financing for Health Systems. Constraints to scaling up the health Millennium Development Goals: costing and financial gap analysis. Geneva (Switzerland): World Health Organization; 2010.
- Chatham House. Shared responsibilities for health: a coherent global framework for health Financing. London (UK): The Royal Institute of International Affairs; 2014.
- Econex. Identifying a measure for inflating guideline tariffs for medical services in South Africa. 2013 [accessed 2015 Jun 15]. http://www.hpcsa.co.za/downloads/service_fees-tariff/submissions/sappf_d_econex_medical_inflation_26_03_2013.pdf
- Dieleman J, Templin T, Sadat N, Reidy P, Chapin A, Foreman K, Haakenstad A, Evans T, Murray C, Kurowski C. National spending on health by source for 184 countries between 2013 and 2040. Lancet. 2016;387(10037):2521–2535.
- Kray A, Monokroussos G. Growth forecasts using time series and growth models. Washington (DC): The World Bank; 1999. Policy Research Working Paper 2224.
- UN Sustainable Development Goals. Goal 3: Ensuring healthy lives and promote well-being for all at all ages. Geneva (Switzerland): United Nations [accessed 2017 Mar 29]. http://www.un.org/en/aboutun/copyright/
- Rabe-Hesketh S, Skrondal A. Multilevel and longitudinal modeling using Stata. College Station (TX): Stata Press; 2005.