
ABSTRACT
Trends in socioeconomic-related health inequalities is a particularly pertinent topic in South Africa where years of systematic discrimination under apartheid bequeathed a legacy of inequalities in health outcomes. We use three nationally representative datasets to examine trends in income- and race-related inequalities in life expectancy (LE) and health-adjusted life expectancy (HALE) since the beginning of the millennium. We find that, in aggregate, (HA)LE at age five fell substantially between 2001 and 2007, but then increased to above 2001 levels by 2016, with the largest changes observed among prime age adults. Income- and race-related inequalities in both LE and HALE favor relatively well-off and non-Black South Africans in all survey years. Both income- and race-related inequalities in (HA)LE grew between 2001 and 2007, and then narrowed between 2007 to 2016. However, while race-related inequalities in (HA)LE in 2016 were smaller than in 2001, income-related inequalities in (HA)LE were greater in 2016 than in 2001. Based on the patterns and timing observed, these trends in income- and race-related inequalities in (HA)LE are most likely related to the delayed initial policy response to the HIV epidemic, the subsequent rapid and effective rollout of anti-retroviral therapy, and the changes in the overall income distribution among Black South Africans. In particular, the growth of the Black middle class narrowed the HA(LE) gap with the non-Black population but reinforced income-related inequalities.
Introduction
South Africa’s apartheid system of systematic racial discrimination bequeathed a legacy of racial and socioeconomic inequalities, as well as health and health system challenges.Citation1,Citation2 Since the dismantling of apartheid legislation in the early 1990s, government strategy and policies have sought to redress those imbalances and narrow disparities, including in health outcomes.Citation2–4 Yet, despite the political priority given to addressing inequalities in South Africa, income-related disparities in health outcomes persist.
To date, most studies of socioeconomic-related inequalities in health outcomes in South Africa have focused on a single time point. They have also tended to look only at a specific disease or condition. Not all are nationally representative. Outcomes examined include child health and undernutrition,Citation5,Citation6 tuberculosis,Citation7 vision loss,Citation8 experience of violence and trauma,Citation9 psychological distress,Citation10,Citation11 adult obesity,Citation12 HIV/AIDS-related mortality,Citation13 disability,Citation11 and self-reported health status.Citation11,Citation14 In general, these studies have shown that (with the exception of some non-communicable diseases) relative to the wealthy the poor suffer disproportionately from poor health outcomes. However, due to their cross-sectional nature, these studies fail to shed light on whether progress has been made in narrowing gaps between the wealthy and the poor over time.
From the early 2010s, the availability of repeated nationally representative surveys and census samples have permitted analysis of trends in inequalities in health outcomes. Using four rounds (2002–2008) of the nationally representative South African General Household Surveys, Ataguba et al.Citation15 and AtagubaCitation16 examined income-related inequalities in the major categories of self-reported ill health, individually and as multi-morbidities. Most recently, Haal, Smith and van DoorslaerCitation17 provided the first nationally representative evidence on trends in mortality disparities in South Africa, finding that income-related inequalities in mortality remained fairly stable from 2001 to 2011.
One health outcome for which the trend in income-related inequalities has not yet been examined in South Africa is health-adjusted life expectancy (HALE). This is an important health outcome since it combines mortality and non-fatal outcomes in a general measure of population health.Citation18–20 From a policy perspective, HALE is relevant because policy does not revolve solely around increasing life expectancy (LE) at birth but also around lowering the presence of disease and improving physical functioning.
We examine trends in income- and race-related inequalities of LE and HALE since the beginning of the millennium. This period includes the surge and then containment of the HIV/AIDS epidemic in the country. While the devastating impact of the epidemic on average LE as well as the spectacular recovery in LE thanks to the successful rollout of antiretroviral treatment (ART) has been well documented,Citation21,Citation22 the change in the income gradient or the racial gap in LE and HALE over this period has not yet been examined (even though it is well known that the HIV/AIDS epidemic has not affected all groups equally).
HIV/AIDS is considered a disease of poverty, rooted in South Africa’s structural inequalities.Citation23,Citation24 South Africa has 7.7 million people living with HIV, representing one out of every five adults,Citation25 but Black South Africans aged 25–49 carry a disproportionate share of the HIV burden (71% compared to their 27% population share).Citation26 This has been attributed to both historicalCitation27,Citation28 and recent internal migration patterns, as well as lower marital rates, high unemployment, and the vulnerability of low-income women.Citation29 Moreover, those in low-income quintiles have a 50% higher chance of dying from HIV/AIDS due to poverty-related factors such as poor nutrition and lack of access to quality health care.Citation13
We contribute to the existing literature on trends in socioeconomic-related inequalities in health outcomes in South Africa in a number of ways. We provide the first analysis of trends in socioeconomic-related inequalities in HALE. We also update estimates of socioeconomic-related inequalities in LE by including more recent data, building on Haal et al.Citation17 We use more recent survey data than any other analysis of trends in (any) income-related health outcomes to date in South Africa. In addition, since HALE is a summary measure of population health, unlike some of the disease-specific outcomes examined in previous trend analyses, the paper is also particularly useful in synthesizing how far South Africa has come in achieving its goal of improving population health outcomes, and the extent to which good health remains concentrated among the better off.
Data and Methods
Data
Our data are drawn from three very large, nationally representative cross-sectional surveys: a 10% sample of the 2001 CensusCitation30 and the Community Surveys for 2007Citation31 and 2016.Citation32 These data sources are well-suited for our research as their size (see ) allows for a survival analysis of the South African population, even when disaggregated by race and income. Because income data are missing from the 2016 Community Survey we opted for the use of an asset-based index to rank households (see below).
Table 1. Descriptive statistics
Variables
Mortality
We rely on mortality data as reported in the household surveys. Both the Census and Community Surveys ask respondents whether someone has died within the household during the last 12 months before the interview. This question is identical across our data sources. Annual death rates by age category are used to calculate LE (see Methods section).
Disability
The questionnaires enquire after general health and functioning from which we can construct a disability indicator. The 2001 Census and 2007 Community Survey ask if the respondent has any disability and, if so, which type: sight, hearing, communication, physical, intellectual and emotional—with the latter defined as behavioral or psychological disabilities. We create a dummy variable that is 1 if the respondent indicates that s/he has at least one disability and 0 otherwise and use this to compute the number of respondents in a less than healthy state by age, sex and race. The questions regarding disability are different in the 2016 Community Survey. First, instead of the binary question asking respondents to identify whether they have “any serious disability that prevents his/her full participation in life activities,” in 2016 respondents are required to rate the degree of difficulty performing a range of tasks (seeing, hearing, communicating, walking, remembering/concentrating and self-care) using five categories: ‘no difficulty’, ‘some difficulty’, ‘a lot of difficulty’, ‘cannot do at all’ and ‘do not know’. We dichotomize this categorical health measure by classifying a person as disabled if at least one type of disability was rated as ‘a lot of difficulty’ or ‘cannot do at all’. Second, the 2016 survey does not ask about mental health, while it is covered in the previous two surveys via the “emotional” response category. Finally, disability data are missing for ages 0–4 in the 2016 Community Survey, so we compute estimates at age five rather than at birth for all surveys.
Race
Respondents were asked to indicate their population group, choosing from the following five categories: Black African, Colored, Indian/Asian, White, and Other. If respondents answered “Other” they were asked to specify their population group. For purposes of analysis, a binary indicator of “Black African” and “Non-Black” (i.e. all other categories) is used; further disaggregation by race is not possible due to insufficient sample size of the non-Black group.
Asset Index
In order to rank individuals by socio-economic status we construct an asset index using principal components analysis on the subset of assets that were available in all three surveys.Citation33,Citation34 Household income questions were not comparable across surveys and missing for 2016. There is no household consumption data in these surveys. Wagstaff and WatanabeCitation35 have documented the advantages of using the asset index for measuring socio-economic inequalities in health. We include the following assets: energy source for lighting, source of water, radio, television, computer, refrigerator, mobile phone, and landline phone. Drawing on previous findings on the stability of weights across rural and urban populations, we have avoided assets which may signal wealth in a rural context but may have little association or even an inverse association with wealth in an urban context.
Methods
Life Table Analysis for LE and HALE Measurement
For the full population analysis of LE and HALE in South Africa we construct standard period life tables. Age-specific LE is computed using the age-specific annual mortality rates retrieved from the surveys. Using the age-specific proportion of disabled people, we obtain the HALE for every age category. We only present estimates from age five because no disability adjustment was possible for infants under five. We construct life tables for the full population as well as for race and asset quintile groups in order to allow for a disaggregated analysis of inequalities.
HALE is computed as the total number of years that an individual at age five is expected to live without any disability. We measure disability by counting the number of individuals reporting disability per age interval. Survival curves for each year are obtained by plotting the proportion of survivors (as estimated by the life table method) as a function of age using the year-specific survival estimates.
Concentration Indices to Measure Socioeconomic Inequality
To quantify the degree of socioeconomic inequality in the distribution of LE and HALE we construct relative (standard) concentration indices (CI).Citation34,Citation35 When using (HA)LE as our indicators of (good) health, the value of the CI is zero when socio-economic inequality is completely absent, negative when this inequality is concentrated among the poor and positive when concentrated among the rich. It can be computed using the correlation of individual health with socioeconomic rank. We use the absolute concentration index to compare changes in absolute inequality as it is well known that changes in relative and absolute measures need not produce similar findings.Citation36 It is defined as the CI multiplied by the mean HALE. Unlike the relative CI, it is not bounded between −1 and 1.
Results
Population Trends in In LE and HALE (At Age Five)
Applying the methods outlined in the previous section, we obtain survey-based estimates of LE and HALE for the period under analysis. We first describe the trends in these results for the total South African population and then disaggregate by race and income to ascertain whether particular subgroups fared differently during this period.
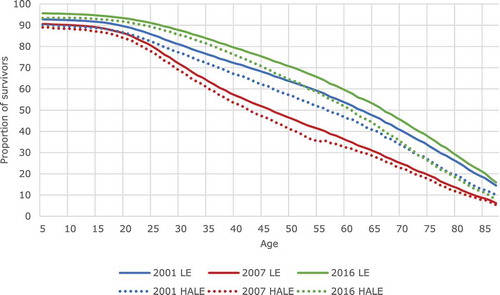
Life table analysis shows that the average LE at age five dropped about ten years between 2001 and 2007, from 60.4 to 50.8 years. Such a sharp drop in LE in just six years is remarkable and rarely observed globally. This sharp drop was, however, followed by an even larger increase in LE to 63.4 in 2016, i.e. a gain of about 13 years in just nine years. HALE at age five also fell substantially between 2001 and 2007, from 55.5 to 48.2, and then also increased by more than it had fallen to 58.1 in 2016.
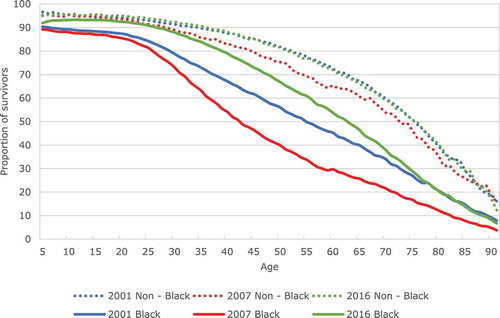
This pattern can also be seen in the shifts of survival curves in . The area below each curve represents LE at age five. The leftward shift from the blue to the red curve illustrates that there were fewer survivors at every age in 2007 than in 2001. For example, the proportion of five-year olds surviving to age 55 dropped from 62.5% in 2001 to only 45% in 2007. The rightward shift from the red to the green line indicates the growing proportion of survivors at every age between 2007 and 2016. Nine years later, 69.5% of five-year olds could expect to reach the age of 55. It is clear that the greatest curve shifts are for adults of prime working age, which is also the group that generally suffered the most from HIV and benefited the most from the rollout of antiretrovirals (ART). The dotted HALE curves, i.e. the expected number of years to be lived in good health, are, of course, lower than the LE curves.
Figure 1. Survival and health-adjusted survival by year: 2001, 2007 and 2016
Trends in Inequality in LE and HALE
Trends in Race-Related Inequality
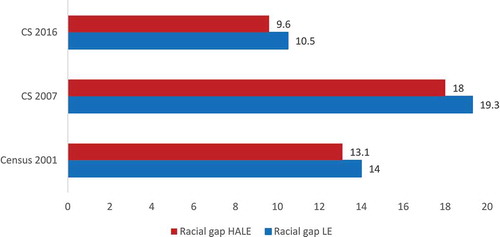
We first examine trends in race-related inequality by computing the gap in LE and HALE between the Black and non-Black South African population subgroups. As shown in , the LE (at age five) of Black South Africans was substantially below the LE of the non-Black population in all years. However, after the initial decline in the LE of Black South Africans from 58.0 to 47.9 years in 2007, there was a much greater rise in LE to well above the 2001 levels to reach 62.2 in 2016. Among non-Black South Africans, LE also fell from 2001 to 2007 but by a much smaller magnitude (from 72 to 67.2) than among the Black group, before returning to its 2001 level in 2016. This suggests that LE losses and gains over time were very unequally distributed by race. A very similar pattern—albeit at a lower level—can be observed for HALE. Similarly to LE, the gain in HALE for Black South Africans after 2007 (11.5 years) is much greater than the pre-2007 loss (7.7 years), even when taking into account that the post-2007 period is three years longer. For non-Black South Africans, the drop in HALE in 2007 is quite small (to 63.5), and in 2016 returned to its 2001 level at 66.6. These trends also affect the evolution of racial gaps in LE and HALE, shown in . Whereas the size of the gap increased from 2001 to 2007 (by 4.9 years of LE and 5.3 years of HALE) it fell again by from 2007 to 2016 (by 8.4 years of LE and 9.8 years of HALE).
Figure 2. Life expectancy and healthy life expectancy at age 5 for the Black South African and non-Black population, 2001, 2007 and 2016
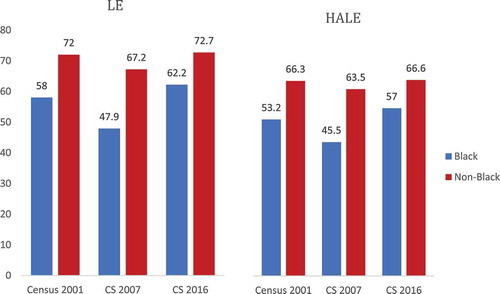
Figure 3. Racial gap in LE and HALE at age 5, 2001, 2007 and 2016
Perhaps even more striking are the survival curves which allow comparison of both groups’ survival () and health-adjusted survival () for the three years. Evidently, as health-adjusted survival cannot be higher than unadjusted survival, all HALE curves are below LE curves. For the non-Black African population, the LE and HALE survival curves have hardly changed when 2001 and 2016 are compared, but the curves are notably lower for 2007, with the HALE curves being particularly lower during prime age adulthood. Much larger changes over time are observed for the Black South African population. Both its LE and HALE curve shifted downward substantially between 2001 and 2007 before rising well above their 2001 level in 2016. These figures suggest that most of the overall changes in LE and HALE—both negative and positive—were driven by the survival experience of the Black South African population.
Figure 4a. Survival curves for the Black South African and non-Black population, 2001, 2007 and 2016
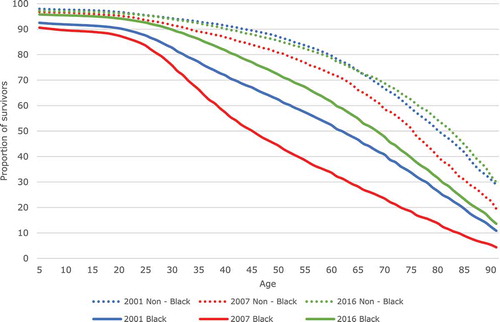
Figure 4b. Health-adjusted survival curves for the Black South African and non-Black population, 2001, 2007 and 2016
What the curves also make clear is that—for Black South Africans—the widening of the gap between the 2001 and 2007 curves already starts in the young adulthood period (18 years and above). It therefore relates to a premature incidence of mortality and disability. The race-specific survival curves also foreground that by far the largest share of this premature loss of health and survival was borne by the Black African population.
Trends in Income-Related Inequality
Finally, we look at trends in inequality in HALE by asset index (our proxy for income) by partitioning our data into five quintiles based on individuals’ household ranking on the asset index. show LE and HALE by quintile and year. First of all, and unsurprisingly, we see that both survival and healthy survival prospects increase with income/assets within each survey year. However, the degree of inequality across quintiles does not appear to be similar across the years.
Figure 5a. Life expectancy at age 5, by income quintile and year
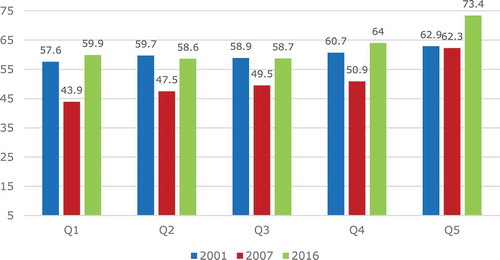
Figure 5b. HALE at age 5, by income quintile and year
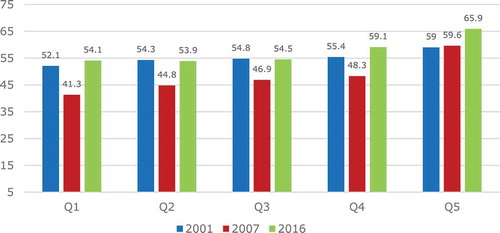
In 2007, the LE and HALE gradient is visibly steeper than in 2001 or in 2016. This is because the drop in survival in 2007 was much larger—in both absolute and relative terms—in the bottom quintiles than in the top quintile. In fact, there was almost no drop in survival in the top quintile in that period. The second period (2007–2016), on the other hand, was characterized by a rise in LE and HALE that was also not equally distributed: in the bottom three quintiles it led to a return to the survival level of 2001, but in the top two quintiles to a rise even above the initial level in 2001. It is striking, however, that falls and rises were not equally distributed across all quintiles: while the top quintile did not see any reduction in LE or HALE in the first period, it did see a significant rise in both during the second period. In 2016, inequality appears to be lower than in 2007 but still greater than it was in 2001.
In order to assess whether, on balance, income-related inequality rose or fell and by how much, we use estimates of both relative and absolute inequality (because they might not necessarily show the same picture). The positive values of the concentration indices (see ) confirm that the inequality in LE and HALE is concentrated among the rich. We can see that in this case, inequality increased in both absolute and relative terms (relative and absolute CI) in the first period to 2007, and then decreased to 2016 but was still well above its initial level in 2001. Similar to the very rapid changes in the mean levels of LE and HALE, these large changes in inequality in LE and HALE over relatively short periods of time are remarkable and rarely (if ever) observed in the demographic trajectory of countries.
Table 2. Concentration indices (CI) for LE and HALE 20O1, 2007, and 2016
Discussion
Overall Trends in LE and HALE
The analysis shows that LE at age five for the full population of South Africa decreased from 60.4 to 50.8 years between 2001 and 2007, and then bounced back to above its 2001 levels to 63.4 in 2016. HALE for the full population at age five shows a similar pattern, decreasing from 55.5 in 2001 to 48.2 in 2007 and increasing to 58.1 in 2016.
These observed fluctuations in LE are atypically large compared to those that are seen in other countries, raising the question as to whether these patterns and their magnitude could be attributable to measurement error. Reassuringly, these trends are in line with a number of other studies, including from a long-running demographic surveillance site,Citation37 South Africa’s Medical Research Council mortality and LE estimates based on deaths,Citation21,Citation38 WHO estimates which, using vital registration data, show a decline in LE at birth from 57.3 in 2000 to 53.8 in 2005 and an increase to 62.9 in 2015,Citation39 and the Global Burden of Disease estimates for LE at birth (66.3) and HALE (57.1) in 2017.Citation19
Previous researchCitation17,Citation21,Citation37,Citation38 has attributed these trends in LE to the growth of the HIV epidemic, followed by a delayed but very rapid introduction of ART in 2004. Up to 2008, ART provision was centralized and largely hospital-based, covering only 40% of eligible people.Citation40 From 2008 onwards, local clinics could apply for accreditation to provide ART and, while accreditation was initially slow, by 2011, 92% of South Africans lived within 20 km of a health facility providing ART.Citation41,Citation42 Combined with an expansion of treatment eligibility, the expansion of the availability of ART led to a rapid increase in the share of people living with HIV/AIDS (PLHIV) on ART. In 2004, an estimated 47,500 of the 4.5 million PLHIV were receiving ART; in 2011, 1.85 million of the 5.9 million PLHIV were receiving ART; and, by 2016, 4.6 million of the 7.7 million PLHIV in South Africa were on ART.Citation43,Citation44
Given that its efficacy is benchmarked as 78% viral suppression at 24 weeksCitation45 and that ART can also lower the risk of transmission,Citation46,Citation47 it is indeed reasonable to think that the rapid roll-out of ART may explain the large and fast improvement not only in LE but also in HALE shown in our analysis. It has been estimated that a 20-year old living with HIV in a lower or middle-income country will on average add an additional 29 years to their life by initiating ART.Citation48 In South Africa, there was a strong mortality response to ART roll-out, with deaths from HIV peaking at 300,000 deaths per year in 2006 and subsequently declining steadily.Citation38
While, in principle, other factors could have contributed to these trends, many rival candidate explanations can be eliminated based on their poor match with the observed size, shape and timing of the fluctuations in LE and HALE over this period. Change in the burden of chronic diseases and injuries is not an explanation since the age-standardized death rates per 100,000 of the population for these have been very flat over the period under analysis.Citation21,Citation38 Reductions in maternal and child mortality can also be eliminated since they do not match the gender and age profile of the observed changes.Citation49,Citation50 Improvements in access to clean water and improved sanitation cannot explain the trend because the largest increases occurred after the fall of apartheid in 1994 and thereafter improved steadily over timeCitation51,Citation52 without the sort of fluctuation that would be associated with the observed LE and HALE trends. Improved living conditions could have contributed to the improvement in LE and HALE between 2007 and 2016; indeed, poverty declined from 62% to 52% between 2008 and 2017.Citation53 However, there was little change in poverty,Footnotea which stayed more or less constant between 2000 and 2008Citation54 during the first period when LE declined sharply.
Inequality Analysis: LE and HALE by Income and Race
We find a decrease in both LE and HALE for quintiles one through four between 2001 and 2007, followed by a reversal of this trend between 2007 and 2016. By contrast, there is comparably little discernable change in LE amongst quintile five in the first two periods, but a clear improvement in 2016. Aligned with the observed changes across quintiles, the CI estimates show that LE and HALE became more concentrated among the better-off between 2001 and 2007, but then inequality in both LE and HALE decreased between 2007 and 2016. However, in 2016 the CIs for both LE and HALE were well above their initial 2001 levels, suggesting that over the entire period examined the health status of the poor declined compared to the better-off.
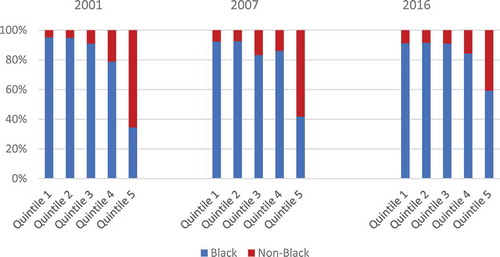
The LE and HALE of the Black South African population was below the LE and the HALE of other races in all survey years. For both LE and HALE we observe a sharp drop between 2001 and 2007 but a recovery to well above their 2001 levels between 2007 and 2016. In contrast, the changes in LE observed for other races meant a recovery only to their 2001 levels. So, in contrast to what we see for income-related inequality in LE and HALE—which remained much higher in 2016 than it was in 2001, race-related inequality has actually fallen over the entire period. This may be a reflection of the fact that a substantial share of the Black population has experienced an improvement in both income and health over the period under analysis. This is confirmed in which shows that between 2001 and 2016, the share of Black South Africans in the top two asset quintiles rose, while it fell in the bottom two quintiles. The share of Black South Africans increased most in the top quintile: from 34% in 2001 to 59% in 2016. This is a clear signal of what has been termed the emergence of the Black middle class.Citation55–57 While this dynamic has likely contributed to a narrowing of racial inequality in LE and HALE, it has not halted the growth in income-related inequality in LE and HALE. Interestingly, a similar phenomenon was recently observed in the US where educational gaps in life expectancy in adulthood widened while racial gaps narrowed.Citation58
Figure 6. Population share (Black South African vs non-Black), by income quintile and year
As with the overall trend in LE and HALE, the socioeconomic and racial distribution of the HIV/AIDS epidemic and timing of roll-out of ART are the most likely explanation for the trends and patterns in income- and race-related LE and HALE inequalities. There is a much higher prevalence of HIV amongst those in the lower socioeconomic groupsCitation23 and amongst the prime aged black population.Citation26,Footnoteb Also, it has been shown that those in the low-income quintiles have a 50% higher probability of dying from HIV/AIDS.Citation13 Therefore, it is not a surprise that changes in LE and HALE over this period were concentrated amongst the poor and Black South Africans. At the end of the period the Black population and the poor remain disadvantaged (relative to those who are better off) in terms of both LE and HALE at age five but the analysis shows that the rapid expansion of ART has countered the initial rise in the health inequalities by race and income.
Our study is not without limitations. First and foremost, the survey data used do not record cause of death and disability, so the attribution of changes to HIV incidence and treatment can only be indirect, based on the coincidence of the size, shape and timing of LE and HALE fluctuations. Second, the lack of data on self-reported disability below age five precludes the computation of HALE at birth. To the extent that HIV and ART have affected the health and survival of infants (e.g. through programs aimed at curbing mother-to-child transmission) such changes are missed in our estimates. The inability to calculate LE and HALE at birth also limits comparison with estimates produced using other data sources. Finally, the omission of mental health from the 2016 survey’s disability questions and the change in the response categories may mean that the 2016 disability data, and therefore HALE estimates, are less comparable to the other two years.
Conclusion
Because LE and HALE are summary measures of population health, examining their trends and socioeconomic-related inequalities provides an important aggregate view of how far South Africa has come in improving absolute health outcomes and reducing socioeconomic and racial inequalities in health outcomes. Our findings highlight the dramatic fluctuations in health and survival witnessed in recent decades in South Africa, and also that Black South Africans and poor households bore a disproportional share of the burden of lives, life years and healthy life years lost. Inequalities in LE and HALE by race and income changed in the same direction—they both first increased and then decreased—but the end result was quite different: while the racial gaps in 2016 were quite a bit smaller than in 2001, this was not the case for income-related inequality, which increased over the entire period under analysis. In other words, despite policies aimed at narrowing both race- and income-related inequalities in health outcomes, while the gap in health outcomes between Black South African and non-Black South African groups did narrow substantially, the inequalities between the poor and non-poor grew wider than they were 15 years earlier. This is likely be due to the growing income-related inequality within the Black population group with a larger share of the Black population enjoying higher incomes as well as better health outcomes.
As argued in the Discussion, we interpret the observed changes in inequalities in health outcomes as mainly attributable to the HIV epidemic and associated policy decisions regarding the roll-out of ART. While we acknowledge that HIV and ART were not the only factors at work during this period, we believe that no other explanations can satisfactorily account for the large fluctuations in LE and HALE (and the associated socioeconomic- and race-related inequalities). Our estimates bear witness, first, to the devastating impact of the HIV epidemic which, as a disease of poverty, has impacted the poor and Black South Africans severely; and, in the second instance, also demonstrate the near-miraculous impact of the successful ART rollout on saving and extending lives, and extending the years of life spent in good health. At the same time, our findings underscore how a delayed policy response has resulted in an exacerbation of income- and race-related inequalities in health outcomes. Both income-and race related inequalities in LE and HALE widened between 2001 and 2007 before the acceleration in the roll-out of ART, and while race-related inequalities subsequently recovered to better than their 2001 levels, income-related health inequalities are wider now than they were at the beginning of the millennium.
Disclosure Of Potential Conflicts Of Interest
The findings, interpretations and conclusions expressed in the paper are entirely those of the authors, and do not represent the views of the World Bank, its Executive Directors, or the countries they represent.
Notes
a. These poverty trend estimates are based on comparisons of the National Income Dynamic Study’s five waves and the Income and Expenditure Survey 2000 using the national upper-bound poverty line. This upper-bound poverty line is based on the food poverty line plus the average amount households who live on the food poverty line spend on non-food items.
b. In 2012, Black South Africans aged 25–49 bore 71% of the HIV burden but accounted for only 27% of the population (per the 2011 Census).
References
- Gilson L, McIntyre D. Post-apartheid challenges: household access and use of health care in South Africa. Int J Health Serv. 2007;37(4):1–12. doi:https://doi.org/10.2190/HS.37.4.f.
- Coovadia H, Jewkes R, Barron P, Sanders D, McIntyre D. The health and health system of South Africa: historical roots of current public health challenges. Lancet. 2009;374(9692):817–34. doi:https://doi.org/10.1016/S0140-6736(09)60951-X.
- National Planning Commission. National development plan vision 2030. 2013 [accessed 2020 Dec 13]. https://www.nationalplanningcommission.org.za/National_Development_Plan.
- Minister of Health. National Health Insurance Bill (No. 11 of 2019). 2019 Aug 6. https://www.gov.za/sites/default/files/gcis_document/201908/national-healthinsurance-bill-b-11-2019.pdf.
- Zere E, McIntyre D. Inequities in under-five child malnutrition in South Africa. Int J Eq Health. 2003;2(1):7. doi:https://doi.org/10.1186/1475-9276-2-7.
- Nkonki LL, Chopra M, Doherty TM, Jackson D, Robberstad B. Explaining household socio-economic related child health inequalities using multiple methods in three diverse settings in South Africa. Int J Eq Health. 2011;10(1):13. doi:https://doi.org/10.1186/1475-9276-10-13.
- Harling G, Ehrlich R, Myer L. The social epidemiology of tuberculosis in South Africa: a multilevel analysis. Social Sci Med. 2008;66(2):492–505. doi:https://doi.org/10.1016/j.socscimed.2007.08.026.
- Cockburn N, Steven D, Lecuona K, Joubert F, Rogers G, Cook C, Polack S. Prevalence, causes and socio-economic determinants of vision loss in Cape Town, South Africa. Plos One. 2012;7(2):e30718. doi:https://doi.org/10.1371/journal.pone.0030718.
- Doolan K, Ehrlich R, Myer L. Experience of violence and socioeconomic position in South Africa: a national study. Plos One. 2007;2(12):e1290. doi:https://doi.org/10.1371/journal.pone.0001290.
- Myer L, Stein DJ, Grimsrud A, Seedat S, Williams DR. Social determinants of psychological distress in a nationally-representative sample of South African adults. Social Sci Med. 2008;66(8):1828–40. doi:https://doi.org/10.1016/j.socscimed.2008.01.025.
- Gordon T, Booysen F, Mbonigaba J. Socio-economic inequalities in the multiple dimensions of access to healthcare: the case of South Africa. BMC Public Health. 2020;20(1):1–13. doi:https://doi.org/10.1186/s12889-020-8368-7.
- Alaba O, Chola L. Socioeconomic inequalities in adult obesity prevalence in South Africa: a decomposition analysis. Int J Env Res Public Health. 2014;11(3):3387–406. doi:https://doi.org/10.3390/ijerph110303387.
- Probst C, Parry CH, Wittchen H, Rehm J. Socio-economic differences in HIV/AIDS mortality in South Africa. Tropical Med Int Health. 2016;21(7):846–55. doi:https://doi.org/10.1111/tmi.12712.
- Rossouw L, Bago d’Uva T, Van Doorslaer E. Poor health reporting? Using anchoring vignettes to uncover health disparities by wealth and race. Demography. 2018;55(5):1935–56. doi:https://doi.org/10.1007/s13524-018-0709-0.
- Ataguba JE, Akazili J, McIntyre D. Socioeconomic-related health inequality in South Africa: evidence from general household surveys. Int J Eq Health. 2011;10(1):48. doi:https://doi.org/10.1186/1475-9276-10-48.
- Ataguba JEO. Inequalities in multimorbidity in South Africa. Int J Eq Health. 2013;12(1):64. doi:https://doi.org/10.1186/1475-9276-12-64.
- Haal K, Smith A, Van Doorslaer E. The rise and fall of mortality inequality in South Africa in the HIV era. SSM-Popul Health. 2018;5:239–48. doi:https://doi.org/10.1016/j.ssmph.2018.06.007.
- Mathers CD, Sadana R, Salomon JA, Murray CJ, Lopez AD. Healthy life expectancy in 191 countries, 1999. Lancet. 2001;357(9269):1685–91. doi:https://doi.org/10.1016/S0140-6736(00)04824-8.
- Kyu HH, Abate D, Abate KH, Abay SM, Abbafati C, Abbasi N, Abbastabar H, Abd-Allah F, Abdela J, Abdelalim A, et al. Global, regional, and national disability-adjusted life-years (DALYs) for 359 diseases and injuries and healthy life expectancy (HALE) for 195 countries and territories, 1990–2017: a systematic analysis for the global burden of disease study 2017. Lancet. 2018;392:1859–922.
- Wang H, Abbas KM, Abbasifard M, Abbasi-Kangevari M, Abbastabar H, Abd-Allah F, Abdelalim A, Abolhassani H, Abreu LG, Abrigo MR, et al. Global age-sex-specific fertility, mortality, healthy life expectancy (HALE), and population estimates in 204 countries and territories, 1950–2019: a comprehensive demographic analysis for the global burden of disease study 2019. Lancet. 2020;396:1160–203.
- Bradshaw DN, Nannan V, Pillay-van Wyke R, Laubscher P, Groenewald, Dorrington RE. Burden of disease in South Africa: protracted transitions driven by social pathologies. S Afr Med J. 2019;109(11b):69–76. doi:https://doi.org/10.7196/SAMJ.2019.v109i11b.14273.
- Simelela N, Venter WD, Pillay Y, Barron P. A political and social history of HIV in South Africa. Curr HIV/AIDS Rep. 2015;12:256–61. doi:https://doi.org/10.1007/s11904-015-0259-7.
- Wabiri N, Taffa N. Socio-economic inequality and HIV in South Africa. BMC Public Health. 2013;13:1–10. doi:https://doi.org/10.1186/1471-2458-13-1037.
- Mabaso M, Makola L, Naidoo I, Mlangeni LL, Jooste S, Simbayi L. HIV prevalence in South Africa through gender and racial lenses: results from the 2012 population-based national household survey. Int J Eq Health. 2019;18:1–11.
- UNAIDS (Joint United Nations Programme on HIV/AIDS). UNAIDS.org. UNAIDS data 2019. 2019 Dec 04. [accessed 2019 Mar 24]. https://www.unaids.org/sites/default/files/media_asset/2019-UNAIDS-data_en.pdf.
- Shisana O, Rehle T, Simbayi LC, Zuma K, Jooste S, Zungu N, Labadarios D, Onoya D. South African national HIV prevalence, incidence and behaviour survey 2012. Cape Town, South Africa: HSRC Press; 2014.
- Jochelson K, Mothibeli M, Leger JP. Human immunodeficiency virus and migrant labor in South Africa. Int J Health Services. 1991;21(1):157–73. doi:https://doi.org/10.2190/11UE-L88J-46HN-HR0K.
- Marks S. An epidemic waiting to happen? The spread of HIV/AIDS in South Africa in social and historical perspective. Afr Stud. 2002;61(1):13–26. doi:https://doi.org/10.1080/00020180220140055.
- Hunter M. The changing political economy of sex in South Africa: the significance of unemployment and inequalities to the scale of the AIDS pandemic. Soc Sci Med. 2007;64(3):689–700. doi:https://doi.org/10.1016/j.socscimed.2006.09.015.
- Statistics South Africa. Census [dataset]. DataFirst; 2001. doi: https://doi.org/10.25828/bp70-m263.
- Statistics South Africa. Community survey [dataset]. DataFirst; 2007. doi: https://doi.org/10.25828/0nqv-ns26.
- Statistics South Africa. Community survey [dataset]. DataFirst; 2016. doi: https://doi.org/10.25828/12sy-yj26.
- Filmer D, Pritchett LH. Estimating wealth effects without expenditure data--or tears: an application to educational enrollments in states of India. Demography. 2001;38(1):115–32. doi:https://doi.org/10.1353/dem.2001.0003.
- O’Donnell O, Van Doorslaer E, Wagstaff A, Lindelöw M. Analyzing health equity using household survey data: a guide to techniques and their implementation. Washington (DC): World Development Institute, World Bank; 2007.
- Wagstaff A, Watanabe N. What difference does the choice of SES make in health inequality measurement? Health Econ. 2003;12(10):885–90. doi:https://doi.org/10.1002/hec.805.
- Kjellsson G, Gerdtham UG, Petrie D. Lies, Damned Lies, and health inequality measurements: understanding the value judgments. Epidemiology. 2015 Sep;26(5):673–80. doi:https://doi.org/10.1097/EDE.0000000000000319.
- Kabudula CW, Houle B, Collinson MA, Kahn K, Gómez-Olivé FX, Tollman S, Clark SJ. Socioeconomic differences in mortality in the antiretroviral therapy era in Agincourt, rural South Africa, 2001–13: a population surveillance analysis. Lancet Glob Health. 2017;5:e924–935. doi:https://doi.org/10.1016/S2214-109X(17)30297-8.
- Pillay-van Wyk V, Msemburi W, Laubscher R, Dorrington RE, Groenewald P, Glass T, Nojilana B, Joubert JD, Matzopoulos R, Prinsloo M, et al. Mortality trends and differentials in South Africa from 1997 to 2012: second national burden of disease study. Lancet Glob Health. 2016;4(9):e642–e653. Erratum in: Lancet Glob Health 2017;5(3):e275. doi:https://doi.org/10.1016/S2214-109X(16)30113-9.
- World Health Organisation. Global health observatory. Life Expectancy and Health Life Expectancy [ accessed 2020 Dec12]. https://www.who.int/data/gho/data/themes/topics/indicator-groups/indicator-group-details/GHO/life-expectancy-and-healthy-life-expectancy.
- Adam MA, Johnson LF. Estimation of adult antiretroviral treatment coverage in South Africa. SA Med J. 2009;99:661–67.
- McLaren ZM. Equity in the national rollout of public AIDS treatment in South Africa 2004–08. Health Pol Plann. 2015;30(9):1162–72. doi:https://doi.org/10.1093/heapol/czu124.
- Burger C, Burger R, Van Doorslaer E. The health impact of a decade of free ART access in South Africa. 2019 Jun 15 [accessed 2021 Mar 5]. http://dx.doi.org/10.2139/ssrn.3403352.
- Johnson LF. Access to antiretroviral treatment in South Africa, 2004–2011. South Afr J HIV Med. 2012;13:a156. doi:https://doi.org/10.4102/sajhivmed.v13i1.156.
- Country Factsheets, South Africa. UNAIDS. 2021 [accessed 2021 Mar 7]. https://www.unaids.org/en/regionscountries/countries/southafrica.
- Barth RE, Van Der Loeff MF, Schuurman R, Hoepelman AI, Wensing AM. Virological follow-up of adult patients in antiretroviral treatment programmes in sub-Saharan Africa: a systematic review. Lancet Infect Dis. 2010;10:155–66. doi:https://doi.org/10.1016/S1473-3099(09)70328-7.
- Hayes RJ, Donnell D, Floyd S, Mandla N, Bwalya J, Sabapathy K, Yang B, Phiri M, Schaap A, Eshleman SH, et al. Effect of Universal testing and treatment on HIV2 incidence—HPTN 071 (PopART). N Engl J Med. 2019;381:207–18. doi:10.1056/.
- Wang H, Wolock TM, Carter A, Nguyen G, Kyu HH, Gakidou E, Hay SI, Mills EJ, Trickey A, Msemburi W, et al.; GBD 2015 HIV Collaborators. Estimates of global, regional, and national incidence, prevalence, and mortality of HIV, 1980–2015: the global burden of disease study 2015. Lancet HIV. 2016;3:e361–87. doi:https://doi.org/10.1016/S2352-3018(16)30087-X.
- Teeraananchai S, Amin J, Ruxrungtham K, Law MG. Life expectancy of HIV-positive people after starting combination antiretroviral therapy: a meta-analysis. HIV Med. 2017;18(4):256–66. doi:https://doi.org/10.1111/hiv.12421.
- Bamford L, McKerrow NH, Barron P, Aung Y. Child mortality in South Africa: fewer deaths, but better data are needed. S Afr Med J. 2018;108(3):25–32. doi:https://doi.org/10.7196/SAMJ.2018.v108i3.12779.
- Damian JD, Njau B, Lisasi E, Msuya SE, Boulle A. Trends in maternal and neonatal mortality in South Africa: a systematic review. Syst Rev. 2019;8:76. doi:https://doi.org/10.1186/s13643-019-0991-y.
- Burger R, McAvarey C, Van der Berg S. The capability threshold: re-examining the definition of the middle class in an unequal developing country. J Human Dev Capabilities. 2017;18(1):89–106. doi:https://doi.org/10.1080/19452829.2016.1251402.
- Statistics South Africa. Inequality trends in South Africa: a multidimensional diagnostic of inequality. Pretoria, South Africa: Statistics South Africa; 2019. Report No.:03-10-19.
- Zizzamia R, Schotte S, Leibbrandt M. Snakes and ladders and loaded dice: poverty dynamics and inequality in South Africa, 2008–2017. WIDER Working Paper. 2019; 2019/25:1–30.
- Leibbrandt M, Woolard I, Finn A, Argent J. Trends in South African income distribution and poverty since the Fall of Apartheid. OECD Social, Employment and Migration Working Papers. 2010;101. doi:https://doi.org/10.1787/5kmms0t7p1ms-en.
- McDermott J. Bourgeois blues: south Africa’s black middle class has prospered under democracy, but fiscal austerity may make it poorer. The Economist ( Weekly Ed.). 2021 Jan 9; Mid East & Afr.
- Southall R. The new black middle class in South Africa. Auckland Park (RSA): Jacana; 2016.
- Burger R, Steenekamp CL, Van Der Berg S, Zoch A. The emergent middle class in contemporary South Africa: examining and comparing rival approaches. Dev S Africa. 2015;32(1):25–40. doi:https://doi.org/10.1080/0376835X.2014.975336.
- Case, A. Deaton, A. Life expectancy in adulthood is falling for those without a BA degree, but as educational gaps have widened, racial gaps have narrowed. Proceedings of the National Academy of Sciences Mar 2021, 118 (11); doi: https://doi.org/10.1073/pnas.2024777118