?Mathematical formulae have been encoded as MathML and are displayed in this HTML version using MathJax in order to improve their display. Uncheck the box to turn MathJax off. This feature requires Javascript. Click on a formula to zoom.
Abstract
Clustering is commonly used in various fields such as statistics, geospatial analysis, and machine learning. In supply chain modelling, clustering is applied when the number of potential origins and/or destinations exceeds the solvable problem size. Related methods allow the reduction of the models’ dimensionality, hence facilitating their solution in acceptable timeframes for business applications. The weighted minimum sum-of-square distances clustering problem (Weighted MSSC) is a typical problem encountered in many biomass supply chain management applications, where large numbers of fields exist. This task is usually approached with the weighted K-means heuristic algorithm. This study proposes a novel, more efficient algorithm for solving the occurring weighted sum-of-squared distances minimisation problem in a 2-dimensional Euclidean surface. The problem is formulated as a set-partitioning problem, and a column-generation inspired approach is applied, finding better solutions than the ones obtained from the weighted version of the K-means heuristic. Results from both benchmark datasets and a biomass supply chain case show that even for large values of K, the proposed approach consistently finds better solutions than the best solutions found by other heuristic algorithms. Ultimately, this study can contribute to more efficient clustering, which can lead to more realistic outcomes in supply chain optimisation.
1. Introduction
Biomass is established as an important alternative to fossil fuels in the quest for renewable energy sources. Biomass plays a versatile role in energy systems, contributing not only to power and heat generation (Tziolas et al., Citation2017) but also serving as a source for biofuels with widespread applications, particularly in the transportation sector. Currently, biomass accounts for over 70% of the renewable energy production globally, while it contributes to a 4% on the fuel demand in road transport. According to the European Union's (EU) long-term strategy, the objective is to achieve a climate-neutral EU by 2050 (European Commission, Citation2020). To this end, sustainable biofuels have the potential to play a decisive role in decarbonising the transport sector (road, aviation, maritime, etc.), while ensuring a high level of affordable and accessible transport connectivity (European Parliament, Citation2021). The emphasis is especially on second-generation biofuels (known as advanced biofuels), which originate from dispersed sources, such as agricultural residues, biomass fractions from mixed municipal and industrial wastes, animal manure, wastes and residues from forestry, etc. According to the EU Renewable Energy Directive 2018/2001, advanced biofuels and biogas production are expected to increase at least to 1% of the final energy consumption in the transport sector in 2025 and at least to 3.5% in 2030 (IEA, Citation2017).
However, the economic viability of using biomass as a renewable energy source is affected by various factors, like uncertainty in feedstock availability, seasonal fluctuations in biomass production, and widespread geographical dispersion (Hassan et al., Citation2019; Psathas et al., Citation2022). Considering also the volatile and competitive global energy market, the continuous technological developments and the more stringent standards and commitments on promoting Sustainable Development Goals, the design of robust biomass supply chains becomes a highly demanding procedure needing a comprehensive system analysis. The overall challenge is to develop a decision-making framework able to amalgamate a multiplicity of factors, manage uncertainty and provide valuable key performance indicators (Abdussalam et al., Citation2021).
A commonly applied approach to support decision-making in such complex supply chain schemes is optimisation. Optimisation is tightly coupled with studying, modelling and solving a multiplicity of industrial and energy problems at any functional level: short-, medium- and long-term planning (Grossmann, Citation2012). Supply chain optimisation models help the decision makers and interested stakeholders make the right strategic and tactical decisions across the upstream, midstream and downstream stages, in order to generate a considerable profit and preserve overall efficiency and sustainability (Abdussalam et al., Citation2021). Mathematical Programming provides the framework to construct such optimisation models able to include a variety of feedstock types and sources, intermediate and final products, energy forms and product streams, technologies, and processes, while incorporating economic, environmental, and social aspects related to a typical biomass supply chain. These models can also consider various cost categories (harvesting, processing, transportation, etc.) and special constraints while they can express the necessary conditions such as biomass availability and geographical dispersion. Furthermore, these models can have interoperability with Geographical Information Systems (GIS) which provide rich spatial data (e.g. physical locations of fields, warehouses, conversion facilities, roads, etc.) and are equipped with analytical capabilities (e.g. K-means clustering) (Lozano-García et al., Citation2020).
The study and analysis of real-life biomass supply chains often includes large numbers of biomass fields and entails the expression of many series and types of variables and mathematical relationships, leading to the construction of detailed and large-scale models. When computational complexity increases, the commonly used exact solution algorithms, can become insufficient to obtain solutions in reasonable timeframes (Martín et al., Citation2023). In such cases, a reduction of the size of the optimisation problem, achieved by the reduction of the number of decision variables is required. This can be achieved by employing clustering and aggregation techniques, to formulate manageable and solvable biomass supply chain models (Potrč et al., Citation2020).
Clustering is a technique commonly used in various fields beyond the biomass supply chain field, such as statistics, geospatial analysis, and machine learning, being tightly linked with the optimisation concept. Specifically in supply chain modelling, clustering is naturally required when the number of potential origins and/or destinations is quite large and the native routing assignment significantly enhances the overall combinatorial optimisation load and the solvability of the cost/distance minimisation problem (Derya et al., Citation2023). Transforming the initial depiction of supply chain nodes to an equivalent partitioned representation can expand the applicability and suitability spectrum in supply chain management gaining benefits in model generation and solution times.
The motivation for dealing with the clustering problem in biomass supply chains originated from the research and modelling objectives of the Horizon 2020 CERESiS project, (CitationCERESiS, 2023), which aims to produce sustainable liquid biofuels through the cultivation of suitable energy crops for the remediation and management of contaminated land. The optimisation of the respective biomass supply chain is significantly affected by the inherent geographical dispersion of the biomass sources and the fluctuation of the feedstock supply. Common clustering approaches in the literature either employ the standard K-means algorithm or spatially divide the map into a grid, arbitrarily placing the coordinates of the aggregated field in the centre. Both approaches overlook the total hectarage of each field, potentially leading to significantly inaccurate transportation cost estimates, hence affecting the accuracy of the whole supply chain modelling. This happens because these algorithms assume equal-sized clusters, while in real-world applications, biomass fields often have varying hectarage. It should be noted that similar issues exist in many other supply chain optimisation contexts where a large number of upstream supply nodes/origins exist, such as recycling, waste collection, agri-food, etc.
To address this issue, the present study introduces a novel weighted K-means algorithm accounting for both field coordinates as well as field size, resulting in a more accurate representation of transportation costs. Incorporating this innovative approach, the aim is to render large biomass supply chain models computationally feasible while also mitigating any inaccuracy linked to traditional and arbitrary clustering. The overall modelling improvement facilitates the end goal of drawing robust and economically viable biofuel or bioenergy production plans based on energy crops cultivated in geographically dispersed land parcels.
The methodological novelty lies in the development of a new heuristic approach to solve the weighted sum-of-squared distances minimisation problem, that considers field size in the clustering process, thus leading to more accurate clustering results in respect to the real system compared to the weighted version of the well-known K-means heuristic, when the size of each field/origin is important. The application novelty lies in applying a heuristics approach for clustering that can consider the field size specifically in the biomass supply chain context. The proposed approach can be equally applied in other supply chain contexts, where the weight of each origin could denote quantities of materials available or other values, instead of the field size of the biomass supply chain problem.
This paper is structured as follows: Section 2 presents the literature review. Section 3 introduces the model formulation. Section 4 describes the column generation approach. Section 5 analyses the results of the computation experiments. Finally, section 6 concludes the study and discusses future research perspectives.
2. Literature review
Numerous studies deal with the optimisation of biomass supply chains considering various logistics and processing stages involved, from the energy crops cultivation or feedstock supply up to biofuel or bioenergy production. For example, Fattahi and Govindan (Citation2018) presented a multi-stage stochastic programme that minimises the cost of a biofuel supply chain to satisfy the demand, accounting for seasonal and stochastic biomass availability, and incorporating environmental and social impact. In a study by Momenitabar et al. (Citation2023) the biofuel supply chain was optimised with a focus on sustainability criteria to determine the optimal siting of the conversion facilities. Sosa et al. (Citation2015) developed a linear programming tool taking into account moisture in biomass, showing its impact on harvest area timeline and storage, as well as transportation elements within the supply chain, including strategies to optimise truckloads within legal weight and volume constraints. In the abovementioned studies as well as in much of the relevant literature, a detailed record of biomass/feedstock field data is often lacking or unavailable due to the inherent difficulty of gathering input from dispersed biomass fields. This is the reason that detailed data from biomass supply hubs’ location (e.g. fields) is usually consolidated or assumed to be available in a single geographical point, hence limiting the accuracy of the modelling process outcomes. However, in instances where this abundance of information is available and is used as the starting point for the biomass supply chain modelling, a method of field aggregation may become necessary for grouping the fields, to reduce the overall model complexity and allow its solution in reasonable times using mathematical optimisation.
For this purpose, clustering algorithms are important and inextricably linked with biomass supply chain design, management and optimisation. A common approach in the biomass supply chain literature lies in treating the substantial volume of data from supply hubs, which renders the supply chain optimisation problem complex and in certain cases unsolvable. For example, O’Neill et al. (Citation2022) developed a stochastic mixed-integer linear programming (MILP) biofuel supply chain model, aiming simultaneously at the maximisation of economic performance and the minimisation of the environmental impact. Their dataset contained over 40,000 fields, which rendered the problem unsolvable with exact optimisation methods. To reduce computational cost, clustering was employed at resolutions of 25, 100, 225, 400, 625 km2 and county level. Uen and Rodríguez (Citation2023) presented a MILP model maximising the net present value of a food waste supply chain for renewable energy generation. The model involved a large dataset with 102 food waste sources and 621 candidate conversion facilities sites (anaerobic digestion and co-digestion), resulting in high computational cost. To address this issue, they used the K-means algorithm to create more representative centroids based on spatial proximity; the final cluster selection consisted of 9 clusters for 291 aerobic digestion candidate sites and 12 clusters for the 330 co-digestion candidates. Psathas et al. (Citation2022) developed a biomass-to-biofuel supply chain that integrated large-scale centralised, smaller-scale decentralised as well as mobile processing facilities. The complex MILP model, applied to a use case involving over 3,000 biomass fields, showcased the inability to achieve a solution for such a high-dimension optimisation problem, prompting the need for clustering the fields in a more manageable group of 16 clusters using the K-means algorithm.
The application of clustering algorithms in the context of biomass and bioenergy is also apparent in Vehicle Routing Problems (VRPs). Ayoub et al. (Citation2007) developed a bioenergy decision support system which combined optimisation and simulation for the design of bioenergy production. In their system, they employed fuzzy C-means clustering to define the location and optimal size of storage and bioenergy conversion facilities based on biomass collection points, with the end goal being the minimisation of transportation costs, CO2 emissions and number of workers. Zamar et al. (Citation2017) applied near-neighborhood search and a modified K-means clustering technique for the route optimisation in the bale collection problem, aiming to minimise travel time and fuel consumption. The constraint of this new K-means algorithm limited the temporary storage sites to valid locations. Zamar et al. (Citation2017) presented a stochastic VRP model for the biomass residue collection from a set of sawmills to identify the optimal routing schedule. Due to variations in biomass quality, the aim was to maximise the ratio of energy returned on energy invested. This combination of uncertainty added into the simulation for the VRP required large computational effort. To make the problem more computationally manageable, the 25 sawmills were spatially clustered based on the travel distance matrix using the K-medoids technique into 4 distinct groups and the itinerary was then rerouted to the centre of each cluster.
Based on the above, clustering algorithms play a vital role in addressing challenges associated with upstream, midstream and downstream supply chain stages in biomass supply chain optimisation, where typically a large number of distinct locations are involved in real-life systems. They can identify potential processing hubs and deal with large datasets in MILP models with high complexity. Clustering algorithms, such as GIS proximity-based clustering, K-means, K-medoids, C-means prove to be essential in creating manageable data subsets, enabling the reduction of computational burden and ensuring reasonable solution times, allowing the construction and use of decision support systems suitable for business applications.
Very limited applications of the Weighted-MSSC problem can be found; one of them presenting the weighted version of the classical K-means algorithm for a use-case regarding locating distribution centres for COVID-19 vaccines throughout the US (https://towardsdatascience.com/determining-optimal-distribution-centers-locations-using-weighted-k-means-1dd099726307 [Online] (accessed April 2, 2024)). We use the related dataset in our computational results section. Similarly, the query ‘weighted MSSC clustering’ returns a number of papers on clustering ensembles where different clusters have different weights, but individual data points have no weights assigned to them as in our case. Overall, even though there have been a number of papers advancing the state-of-the-art in MSSC, with the exception of the article [https://towardsdatascience.com/determining-optimal-distribution-centers-locations-using-weighted-k-means-1dd099726307 [Online] (accessed April 2, 2024)] none have studied the weighted version of the problem. In the next three paragraphs, therefore, we revisit a number of papers on the MSSC problem instead.
In Arthur and Vassilvitskii (Citation2007), the authors present the well-known ‘K-Means++’ heuristic for initialising the centres of the K-means algorithm, by modifying another popular heuristic, the so-called ‘farthest centers’ heuristic, which works by selecting at random one point from the dataset as first centre, and then repeatedly chooses the point that is ‘the furthest distance’ away from the current set of centres as the next centre. Because this heuristic was prone to choosing outliers in the dataset as the initial centres, the K-Means++ algorithm works by selecting at random but with probability proportional to the shortest distance of any point from the currently selected centres the next point to be selected as the next centre. This randomisation procedure guarantees theoretical good properties of the initial clustering for the K-means algorithm. Then, in Bahmani et al. (Citation2012), the authors remove the serial bottleneck of the above-described procedure by fully parallelising it to allow utilising as many CPU cores as there are available in a cluster, and therefore allow much larger datasets than was possible before to be clustered efficiently; this K-Means variation is denoted as the ‘K-Means ||’.
Aloise et al. (Citation2012) presented an improved column generation method for the MSSC that was able to solve to optimality problems with up to 2400 points in 2-D Euclidean space and K taking values up to 400. Very recently, the authors of (Piccialli et al., Citation2022) presented a Semi-Definite Programming approach (SDP) to the MSSC, that allows them to solve to provable optimality a number of problems that were not solvable before. In (Burgard et al., Citation2023), the authors use advanced mixed integer programming techniques such as cutting planes (including cardinality cuts, outer approximation cuts and bary-centre propagation) to enhance the performance of the Open-Source solver SCIP.
Peng and Xia (Citation2005) present a ‘convexity cut method’ to solve to global optimality the MSSC problem. They use CPLEX for solving their corresponding cutting plane problem; they report results for problems up to 4600 data points, but they only work with very small values of K. Finally, in (Usman, Citation2023), the author presents a number of clustering algorithms for forest harvesting, mentioning the classical K-means algorithm as one possible method for solving their (unweighted) problem.
According to the literature review, clustering is not fully exploited under the concept of comprehensive biomass supply chain management. In the upstream level, where typically biomass fields of varying size exist, the existing clustering approaches are employed only to treat the location dimensionality while the hectarage (area) factor is ignored. The absence of incorporating hectarage in the cluster calculation may result in forming groups that don't adequately represent the initial set of fields, diminishing accuracy and affecting many aspects of the design and optimisation of the whole biomass supply chain such as the transportation costs, the location and capacity of midstream processing facilities, etc. The present study aims to fill this methodological gap and develop an effective clustering algorithm that allows a more precise representation of clustered sites considering both their size and location. Enhancing and improving the clustering process facilitates the management of more complex problems without increasing solution times, while preserving accuracy and generating robust results which support a more informed decision-making.
3. Model formulation
The clustering problem dealt in this study is the Weighted MSSC problem, which generalises the well-known MSSC problem (Hansen & Mladenović, Citation2001; Theodoridis & Koutroumbas, Citation2006) as follows: consider a finite set of points in
-dimensional plane, with associated positive weights
. The problem is to find
‘centers’ in the plane that will minimise the total weighted sum of square distances of each of the
points to their closest centre multiplied by the point's corresponding weight. It is worth noting that when all the points have equal weights, the problem reduces to the well-known minimisation of sum of square errors problem that appears in many problems in signal processing (code-book design), unsupervised learning (K-Means clustering), supply chain design, and so on.
The problem can be stated then as follows:
We seek to find a partition of the set
into
disjoint sets
that minimises the function
where the point
is such that it minimises the sum of weighted distances of each point in the cluster
to it.
Lemma 1:
Given the points in a partition cluster
, with accompanying weights
, the optimal point in the plane that minimises the sum of weighted distances of the points in the partition cluster to it, is the (weighted) barycenter
.
Proof:
It is enough to show that for the function
(1)
(1) the gradient
. The gradient of the function at any point
is
(2)
(2) Setting the above expression to zero, we obtain as the only solution the vector
(3)
(3)
Therefore, mathematically, we seek to optimise the following problem (P):
(P)
(P) subject to:
4. A column generation approach to solving the weighted MSSC problem
The minimum sum of square errors clustering problem (MSSC) has been the subject of intense study for many decades (Theodoridis & Koutroumbas, Citation2006). It is a combinatorial problem by nature: given a finite set of
data points in some vector space, the problem is to find a partition of the data points in exactly
disjoint partition clusters so that the sum of the square distances of each point to its closest centre (cluster mean point) is minimised. The problem is known to be NP-Hard (Christou, Citation2012). The MSSC problem is clearly a special case of the weighted MSSC problem where the weight of each data point is set to 1.
The most known and frequently used algorithm for solving the standard MSSC problem is the K-Means algorithm (Aloise et al., Citation2012; Burgard et al., Citation2023; Peng & Xia, Citation2005; Usman, Citation2023), an expectation-maximisation (EM) type algorithm that works by iterating two major phases: an expectation step that assigns points to their closest current centroid (mean), and a maximisation step that re-computes the centroids as the mean vector of every data point in a cluster, optimising the objective function under the current assignments. The algorithm iterates until some convergence criteria is met, or -for very large problems- for a fixed number of iterations. For most problems, the initial choice of cluster centres is a major factor that can determine the quality of the final solution as well as the speed of convergence (Arthur & Vassilvitskii, Citation2007; Bahmani et al., Citation2012).
K-means is a heuristic algorithm that does not guarantee the optimal solution of an MSSC problem, even though it often finds high quality solutions, at least for modest values of . As described above, the K-means algorithm does not solve the weighted MSSC problem, however, it is not difficult to state a variant that attempts to. Essentially, the only modification to the K-means algorithm that is needed, is in the M-step (step 2) where we compute the new cluster centres. Given Lemma 1 in section 2, we see that the modification needed to be done to the original K-means algorithm to result in a weighted K-means algorithm is to compute the centre of each cluster in step 2 according to equation (3).
However, whereas the K-means algorithm, and the modified weighted K-means algorithm usually provide acceptable results for problems with a small number of partitions required (say, up to a few tens), the same is not usually the case for a larger number of partitions (Laszlo & Mukherjee, Citation2006). For such problem instances, we propose a column-generation type approach to a set covering formulation of the problem, in a spirit similar to the approach described in (Christou, Citation2011) for the standard MSSC problem.
In particular, notice first that the weighted MSSC problem, being also a combinatorial optimisation problem, can be written as a set partitioning problem. Consider all possible subsets of the set and denote by
the
matrix containing ones and zeros, whose columns represent all those possible subsets: every column of the matrix has exactly
components, and the
-th component indicates whether the data point
is contained or not in the subset. Given this (rather big) matrix, the weighted MSSC problem can be written down as the set-partitioning problem.
(SPP)
(SPP)
where the column vector
and the cost-vector
contains the (weighted) costs of all subsets of the set
. The set-partition problem formulation (SPP) asks to pick exactly
subsets of the set
(constraint
and
) such that they completely cover the set
without any overlap (constraints
) and minimise the total weighted cost of each selected subset.
Solving the problem (SPP) is not any easier than solving the problem (P), and both problems are NP-Hard. Even further, just writing down the initial model formulation of the problem (SPP) requires explicitly enumerating and storing all possible subsets of
which is clearly infeasible for even small values of
. We, therefore, resort to a column-generation approach (originally described in (Christou, Citation2011) for the standard MSSC problem) whereby we begin with a base matrix
that contains only a few of the columns of the full matrix
, and afterwards we solve the following variant of the initial problem (SPP), called (SCPR):
The components of the column-vector again correspond to the weighted clustering cost of the corresponding subsets described in the columns of the reduced matrix
, only now we seek to solve the set covering version of the problem (constraints
) which means we don't care if some data points appear in more than one subsets selected in the final solution, as long as each point appears in at least one selected subset.
In case there exists at least one data point that appears in more than one selected subset in the solution of (SCPR), we remove it from every selected subset in which it appears except the subset from which if we removed
the weighted cluster cost increase would be the smallest among all other selected subsets that contain it; ties are arbitrarily broken. It is easy to see that such a procedure results in strictly lowering the objective function value of the weighted MSSC problem.
Given the new clusters that represent a valid clustering solution to the weighted MSSC, though it may or may not be optimal, we generate more columns to add to our base matrix by adding the new subsets that we created in the conversion process described above (if any), and then by running the weighted K-means algorithm on the solution found by the previous step, and adding all new clusters created during the run of the weighted K-means algorithm to the new base matrix
. We then solve the new problem (SCPR) with the new base matrix
again, and repeat this process until in one full iteration we no longer improve on the final objective value of the problem.
The entire algorithm, called W-EXAMCE, is a variant of the EXAMCE algorithm specified in (Christou, Citation2011) adapted to work with weighted clustering, is specified in Figure and is available from https://www.github.com/ioannischristou/weighted_clustering.
Figure 1. W-EXAMCE algorithm.
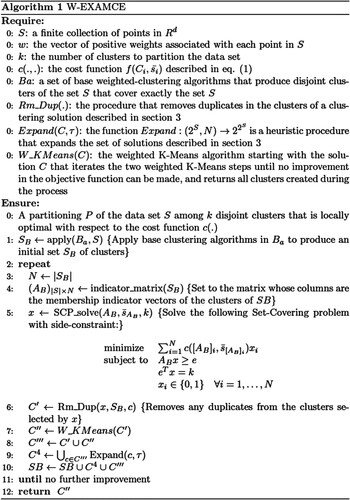
The procedure Expand(C,τ) expands the set of available solutions to consider in step 5 by producing a (possibly empty) set of clusters that are perturbations of the input cluster C. We use a simple heuristic whereby we choose the τ closest neighbours to the centre of C that are not in C, as well as the τ members of C that are farthest from the centre of C, with τ being a small user-defined parameter (set after experimentation equal to 5). Distances here are weighted, meaning that the distance between a cluster centre and a data point
with associated weight
is the quantity
. We create and return a sequence of 2τ new clusters
where each of the
clusters contains all points in C plus up to the
-th closest non-member neighbour of C, and each of the
clusters contains all points in C except up to the
-th farthest member of C.
It is easy to see that in every iteration in steps 3–10 of the W-EXAMCE algorithm, the solution C’’ that is found is at least as good as the corresponding solution from the previous iteration:
Lemma 2.
The solutions C’’ found in step 7 of the W-EXAMCE algorithm are non-increasing.
Proof
Notice that the columns of the matrix B in problem (SCPR) to be solved at each iteration always form a super-set of the columns of the same matrix in the previous iteration, even after that previous matrix is augmented by the solution found in the previous execution of step 7. Therefore, the solution of the problem in step 5 is always at least as good as the solution of step 7 found in the previous iteration. And since both the Rm_Dup(.) procedure in step 6 by design can only further reduce the objective value of the problem, and the same is true for the application of the W-K-Means algorithm in step 7, the solution C’’ found in step 7 at each iteration is always monotonically decreasing.
Because of the above monotone convergence of the algorithm (convergence is guaranteed since the solution sequence is monotonically decreasing, and is bounded from below by zero), we have the following:
Corollary 3.
The W-EXAMCE algorithm converges in a finite number of iterations.
Proof
The convergence of the algorithm is already established. The finiteness of the number of steps follows from the fact that there are only finitely many different partitions to partition the data, and the algorithm stops as soon as no progress is made in two consecutive iterations.
A small worked example of the W-EXAMCE algorithm is presented in Appendix A.
5. Computational results
In all experiments below, we use the GUROBI optimiser (v. 11) to solve the SCP problem in step 5 of the W-EXAMCE algorithm in Figure . We use a PC with an Intel Core i9-10920X CPU running at 4.5 GHz, equipped with 64GB RAM, running Windows 11. Both the standard K-means and the scalable K-Means|| algorithm implementations are fully parallelised using Java threads and utilise all 24 virtual CPU cores that the CPU offers. All algorithms are written in Java.
In Table , the meta-data for the major datasets used for our experiments are presented. All datasets represent points in the Euclidean 2-dimensional plane. Due to the lack of publicly available biomass-related land plot datasets, several more datasets from well-known libraries and other sector applications were used to demonstrate the performance of the proposed method. In Table we present the results obtained from 4 datasets in the TSPLIB that are commonly used to benchmark algorithms for the standard MSSC problem (see Christou, Citation2011; Hansen & Mladenović, Citation2001; Laszlo & Mukherjee, Citation2006), with attached random positive weights for each data point. We compare results from applying standard K-means with 100 restarts, with the scalable K-means|| algorithm with 100 restarts, and the W-EXAMCE algorithm that uses the clusters obtained from 10 restarts of the standard K-means algorithm as base clusters. The column labelled ‘Soln Improvement%’ under the W-EXAMCE results columns lists the percentage improvement of W-EXAMCE over the baseline K-means algorithm. As can be seen from the results, W-EXAMCE is always the clear winner of the three algorithms even though it takes a little more time to complete.
Table 1. Used dataset characteristics.
Table 2. Comparison of results of W-EXAMCE, K-Means and scalable K-Means|| w/ 100 restarts on TSPLIB datasets.
In Table , we present results from one large-scale use-case for phyto-remediation-based supply chain management, with real land plot data from the Scottish Vacant and Derelict Land Register (SVDLS, Citation2022): the dataset contains the coordinates of 3,398 previously-developed brownfield land plots, in the British National Grid Coordinate system, a plane coordinate system that is based upon a Transverse Mercator projection. The dataset also contains the area that each plot covers that serves as the weight of each data point for our clustering purposes. This dataset refers to one of the phytoremediation use cases of the project CERESiS (CitationCERESiS, 2023), where the objective was to optimise the respective supply chain of energy crops grown in potentially contaminated land to produce biofuels, while at the same time decontaminating the soil. The dataset is visualised in Figure , however the size of each land plot is not drawn to scale.
Figure 2. Locations of Vacant and Derelict Land Register Sites in Scotland in the British Coordinate Grid. The size of each plot is not drawn to scale.
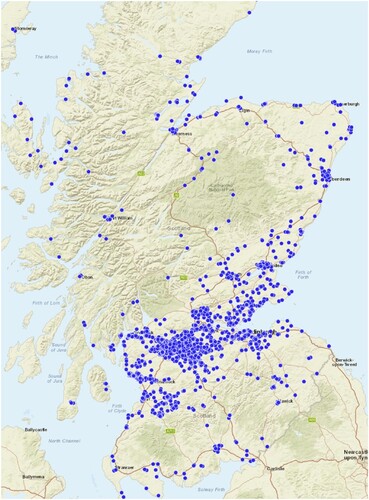
Table 3. Comparison of results of W-EXAMCE, K-Means w/ 100 Restarts and Scalable K-Means|| w/ 100 Restarts on Scotland Vacant and Derelict Land Register dataset.
Finally, to assess the algorithm on another real-life large dataset, in Table we present results using the public (weighted) dataset created for determining the best locations for placing distribution and vaccination centres for the COVID-19 pandemic in the U.S.A. This dataset contains 4,478 data points in 2D. We have converted the original standard lat-lon coordinates of the dataset into a flat grid using Mercator Projection (UTM), and normalised the weights of the original dataset to sum up to 1 (otherwise, the sum of the weighted square distances would lead to arithmetic overflows due to resulting large numbers.)
Table 4. Comparison of results of W-EXAMCE, K-Means w/ 100 Restarts and Scalable K-Means|| w/ 100 Restarts on the US COVID-19 Cases dataset.
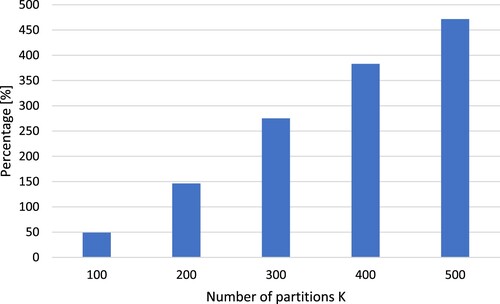
In Figure we show the percentage gap in solution quality between the proposed W-EXAMCE and the weighted K-means with 100 restarts on the Scotland Vacant and Derelict Land Register data; as can be seen clearly both from Figure and from Tables , the solution found by W-EXAMCE is always superior to that found by 100 restarts of the K-means or the scalable K-Means|| algorithms. It can also be observed that the superiority of the W-EXAMCE algorithm is greatly enhanced when the number of partitions increases, while it requires more time to be solved; however, the time needed is reasonable for practical applications. By employing the proposed algorithm, a more efficient clustering is achieved, in order to support the supply chain optimisation process that uses the clusters as input.
Figure 3. Comparison chart of the solution gap between W-EXAMCE and weighted K-Means with 100 Restarts on the Scotland Land Register dataset.
6. Conclusions and future directions
This study proposed a novel, more effective clustering method for use within biomass supply chain optimisation modelling, as well as for any other case where clustering is required within supply chain analysis and optimisation context. In the context of biomass supply chain analysis, clustering is not often utilised; instead, clustering primarily finds applications in VRP problems (such as the ‘cluster-first-route-second’ heuristic by Fisher and Jaikumar (Citation1981)), where weights are not usually taken into account.
The proposed algorithm (W-EXAMCE) for the weighted MSSC problem proved to be very effective in identifying more representative clusters of biomass fields than the commonly used technique of the weighted K-means and the scalable K-Means II. The solution quality gap between the proposed algorithm against the weighted K-means increases significantly as the number of partitions increases. Therefore, when more refined supply chain analysis is required, the proposed algorithm can offer more accurate clusters, leading to more accurate transportation cost estimates, hence more accurate supply chain optimisation outcomes.
The applicability of the proposed algorithm for the weighted MSSC problem (W-EXAMCE) in biomass supply chain modelling, where exact locations of fields or biomass hubs are known, has been demonstrated for the Scottish Vacant and Derelict Land Register dataset (used as a use case in the CERESiS project (CitationCERESiS, 2023), the US COVID-19 cases dataset [https://towardsdatascience.com/determining-optimal-distribution-centers-locations-using-weighted-k-means-1dd099726307 [Online] (accessed April 2, 2024)], and several TSPLIB datasets (with random weights). The proposed algorithm offers a viable option for increasing the optimisation results’ accuracy. Given the spatial dispersion, typically low availability of biomass feedstock, and diverse land hectarage of the fields under analysis, a refined approach is necessary, since simple aggregation and clustering techniques may introduce inaccuracies in the results. Here, the weighted K-Means algorithm provides robust solutions for typical biomass to biofuels or bioenergy supply chains, offering a detailed grouped view of the fields based on hectarage that is essential for effective decision-making.
The proposed W-EXAMCE algorithm could have wider applicability in all supply chain modelling contexts where many upstream, midstream or downstream nodes are involved, provided that each node of the physical system carries a different weight. In this case, using the proposed algorithm would lead to more accurate clustering compared to the typical K-means algorithm, ultimately leading to supply chain optimisation IEA, Citation2017 outputs that are more relevant and based on more accurate inputs.
In the future, the W-EXAMCE algorithm could be applied in more diverse datasets of biomass supply chains, to understand its performance gap and expected benefits in a wider set of conditions. Its applicability could also be tested in other supply chain contexts to demonstrate its potential for generalisation.
Disclosure statement
No potential conflict of interest was reported by the author(s).
Data availability statement
The data in this study can be provided upon request from the authors by emailing them. The entire W-EXAMCE algorithm is available from https://www.github.com/ioannischristou/weighted_clustering.
Additional information
Funding
References
- Abdussalam, O., Fello, N., & Chaabane, A. (2021). Exploring options for carbon abatement in the petroleum sector: A supply chain optimization-based approach. International Journal of Systems Science: Operations & Logistics, 10(1), 2005174. https://doi.org/10.1080/23302674.2021.2005174
- Aloise, D., Hansen, P., & Liberti, L. (2012). An improved column generation algorithm for minimum sum of squares clustering. Mathematical Programming, 131, 195–220. https://doi.org/10.1007/s10107-010-0349-7
- Arthur, D., & Vassilvitskii, S.. (2007). K-means++: The advantages of careful seeding. Proceedings of the eighteenth annual ACM-SIAM symposium on Discrete algorithms, SODA’07, 1027–1035.
- Ayoub, N., Martins, R., Wang, K., Seki, H., & Naka, Y. (2007). Two levels decision system for efficient planning and implementation of bioenergy production. Energy Conversion and Management, 48(3), 709–723. https://doi.org/10.1016/j.enconman.2006.09.012
- Bahmani, B., Moseley, B., Vattani, A., Kumar, R., & Vassilvitskii, S. (2012). Scalable κ-means++. Proceedings of the VLDB Endowment, 5(7), 622–633. https://doi.org/10.14778/2180912.2180915
- Burgard, J. P., Costa, C. M., Hojny, C., Kleinert, T., & Schmidt, M. (2023). Mixed-integer programming techniques for the minimum sum of squares clustering problem. Journal of Global Optimization, 87, 133–189. https://doi.org/10.1007/s10898-022-01267-4
- CERESiS. ContaminatEd land Remediation through Energy crops for Soil improvement to liquid biofuel Strategies. [Online] Retrieved December 17, 2023, from https://ceresis.eu/
- Christou, I. T. (2011). Coordination of cluster ensembles via exact methods. IEEE Transactions on Pattern Analysis and Machine Intelligence, 33(2), 279–293. https://doi.org/10.1109/TPAMI.2010.85
- Christou, I. T. (2012). Quantitative methods in supply chain management: Models and algorithms. London: Springer. https://doi.org/10.1007/978-0-85729-766-2
- Derya, T., Keçeci, B., & Dinler, E. (2023). Selective clustered traveling salesman problem. International Journal of Systems Science: Operations & Logistics, 10(1). https://doi.org/10.1080/23302674.2023.2235266
- European Commission. (2020). Long-term low greenhouse gas emission development strategy of the European Union and its Member States. UNFCCC, 2020 (March). [Online]. https://unfccc.int/documents/210328
- European Parliament. (2021). The European Green Deal - European Parliament resolution of 15 January 2020 on the European Green Deal (2019/2956(RSP)). Official Journal of The European Union
- Fattahi, M., & Govindan, K. (2018). A multi-stage stochastic program for the sustainable design of biofuel supply chain networks under biomass supply uncertainty and disruption risk: A real-life case study. Transportation Research Part E: Logistics and Transportation Review, 118, 534–567. https://doi.org/10.1016/j.tre.2018.08.008
- Fisher, M.L., & Jaikumar, R. (1981). A generalized assignment heuristic for vehicle routing. Networks, 11(2), 109–124. https://doi.org/10.1002/net.3230110205
- Grossmann, I. E. (2012). Advances in mathematical programming models for enterprise-wide optimization. Computers & Chemical Engineering, 47, 2–18. https://doi.org/10.1016/j.compchemeng.2012.06.038
- Hansen, P., & Mladenović, N. (2001). J-Means: A new local search heuristic for minimum sum of squares clustering. Pattern Recognition, 34(2), 405–413. https://doi.org/10.1016/S0031-3203(99)00216-2
- Hassan, S. S., Williams, G. A., & Jaiswal, A. K. (2019). Moving towards the second generation of lignocellulosic biorefineries in the EU: Drivers, challenges, and opportunities. Renewable and Sustainable Energy Reviews, 101, 590–599. https://doi.org/10.1016/j.rser.2018.11.041
- IEA. (2017). Technology roadmap: Delivering sustainable bioenergy. IEA Paris. https://www.iea.org/reports/technology-roadmap-delivering-sustainable-bioenergy, Licence: CC BY 4.0
- Laszlo, M., & Mukherjee, S. (2006). A genetic algorithm using hyper-quadtrees for low-dimensional k-means clustering. IEEE Transactions on Pattern Analysis and Machine Intelligence, 28(4), 533–543. https://doi.org/10.1109/TPAMI.2006.66
- Lozano-García, D. F., Santibañez-Aguilar, J. E., Lozano, F. J., & Flores-Tlacuahuac, A. (2020). GIS-based modeling of residual biomass availability for energy and production in Mexico. Renewable and Sustainable Energy Reviews, 120, 109610. https://doi.org/10.1016/j.rser.2019.109610
- Martín, M., Taifouris, M., & Galán, G. (2023). Lignocellulosic biorefineries: A multiscale approach for resource exploitation. Bioresource Technology, 385, 129397. https://doi.org/10.1016/j.biortech.2023.129397
- Momenitabar, M., Dehdari Ebrahimi, Z., Abdollahi, A., Helmi, W., Bengtson, K., & Ghasemi, P. (2023). An integrated machine learning and quantitative optimization method for designing sustainable bioethanol supply chain networks. Decision Analytics Journal, 7, 100236. https://doi.org/10.1016/j.dajour.2023.100236
- O’Neill, E. G., Martinez-Feria, R. A., Basso, B., & Maravelias, C. T. (2022). Integrated spatially explicit landscape and cellulosic biofuel supply chain optimization under biomass yield uncertainty. Computers & Chemical Engineering, 160, 107724. https://doi.org/10.1016/j.compchemeng.2022.107724
- Peng, J., & Xia, Y.. (2005). A cutting algorithm for the minimum sum-of-squared error clustering. Proceedings of the 2005 SIAM International Conference on Data Mining, 150–160.
- Piccialli, V., Sudoso, A. M., & Wiegele, A. (2022). SOS-SDP: An exact solver for minimum sum of squares clustering. INFORMS Journal on Computing, 34(4), 2144–2162. https://doi.org/10.1287/ijoc.2022.1166
- Potrč, S., Čuček, L., Martin, M., & Kravanja, Z. (2020). Synthesis of European Union biorefinery supply networks considering sustainability objectives. Processes, 8(12), 1588. https://doi.org/10.3390/pr8121588
- Psathas, F., Georgiou, P. N., & Rentizelas, A. (2022). Optimizing the design of a biomass-to-biofuel supply chain network using a decentralized processing approach. Energies, 15(14). https://doi.org/10.3390/en15145001
- Sosa, A., Acuna, M., McDonnell, K., & Devlin, G. (2015). Controlling moisture content and truck configurations to model and optimise biomass supply chain logistics in Ireland. Applied Energy, 137, 338–351. https://doi.org/10.1016/j.apenergy.2014.10.018
- SVDLS. (2022). Scottish vacant and derelict land survey. Retrieved November 25, 2023, from https://www.gov.scot/publications/scottish-vacant-and-derelict-land-survey—site-register/
- Theodoridis, S., & Koutroumbas, K. (2006). Pattern recognition (3rd ed.). Academic Press.
- Tziolas, E., Manos, B., & Bournaris, T. (2017). Planning of agro-energy districts for optimum farm income and biomass energy from crops residues. Operational Research, 17(2), 535–546. https://doi.org/10.1007/s12351-016-0236-y
- Uen, T. S., & Rodríguez, L. F. (2023). An integrated approach for sustainable food waste management towards renewable resource production and GHG reduction. Journal of Cleaner Production, 412, 137251. https://doi.org/10.1016/j.jclepro.2023.137251
- Usman, M. (2023). An application of geospatial clustering for assets optimisation in forest harvesting [M.Sc. Thesis]. Tampere University.
- Zamar, D. S., Bhushan, G., & Sokhansanj, S. (2017). A constrained K-means and nearest neighbor approach for route optimization in the bale collection problem. IFAC-PapersOnLine, 50(1), 12125–12130. https://doi.org/10.1016/j.ifacol.2017.08.2148
- Zamar, D. S., Gopaluni, B., & Sokhansanj, S. (2017). Optimization of sawmill residues collection for bioenergy production. Applied Energy, 202, 487–495. https://doi.org/10.1016/j.apenergy.2017.05.156
Appendix A
For a better understanding of the workings of the W-EXAMCE Algorithm described in Figure , we demonstrate its application with a small example.
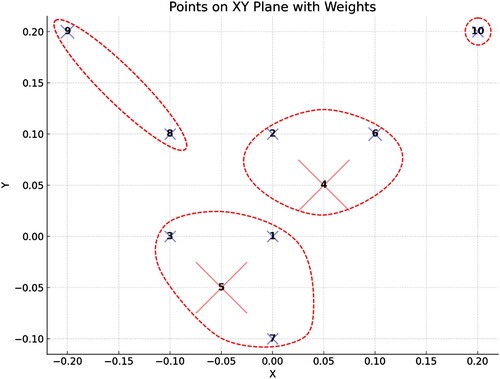
In Figure below, we show a dataset of 10 points in 2 dimensions. Each data-point has an associated weight according to Table below, and the ‘X’ that is used to draw each point in Figure is drawn approximately according to the scale shown in Table .
Figure A1. Toy dataset with 10 Points in 2D to trace the steps of algorithm W-EXAMCE.
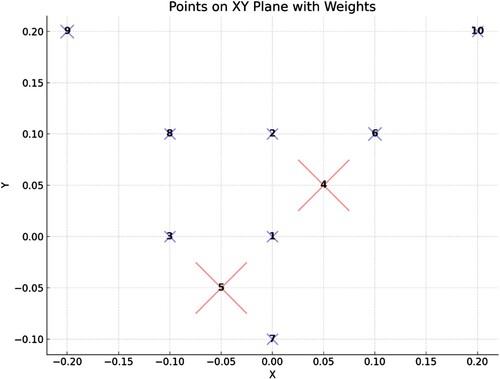
Table A5. Toy dataset weights.
We are going to trace the execution of the algorithm W-EXAMCE with k = 4. For simplicity, we also set τ = 0 for our procedure so that in essence the procedure does not do anything. We produce the initial matrix
by executing the clusterers in the set Ba = (W-KMeans(4), W-KMeans(4), W-KMeans(4), W-KMeans(3), W-KMeans(3), W-KMeans(5), W-KMeans(5)); this means that we apply 3 times the W-KMeans algorithm with k = 4 (starting from a different random initial solution each time), and then we apply 2 times the W-KMeans algorithm with k = 3, and with k = 5 (step 1). This results in a total of 28 clusters whose members and total weighted costs are shown in Table below. The clustering solutions are colour-coded in Table below, so that the first clustering solution comprises of the clusters 1–4 (inclusive), the second solution comprises of clusters 5–8 and so on.
Table A6. Results of applying clusterers in the set Ba to the dataset.
Given the data in the 2nd column of Table , the constraints of the problem in step 5 are then as follows:
Figure A2. Matrix representation of the set covering problem formulation constraints.
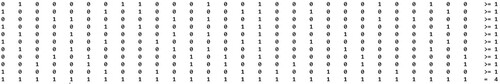
Where we have only written the matrix as the LHS and the values of the RHS vector of the constraints.
When the MIP solver solves the SCP problem with the above data, the best solution it finds picks the columns 6, 13, 17 and 19 which represent the following clusters:
{8, 9}
{1, 3, 5, 7}
{10}
{2, 4, 6}
This solution has total weighted cost equal to 4.27E-04 ( = 1.33E-04 + 1.49E-04 + 0 + 1.45E-04) which happens to be less than any cost found by the application of the base clusterers for . Because the solution found is also a solution to the set partitioning problem (SPP), the step 6 is a no-op (does not do anything). Similarly, step 7 (applying W-KMeans(4) from the solution just found) does not create any new clusters because the new solution found is already a local optimum for the W-MSSC problem. Therefore (given that τ = 0) steps 8–10 are also no-ops, and no new columns are added to the matrix
. Therefore, in the next iteration of steps 3–10, no improvement will occur, and the algorithm stops after two iterations of its main loop. The best solution found by applying the W-EXAMCE algorithm is shown in Figure below.
Figure A3. Best clustering solution found by W-EXAMCE on toy dataset.