
Abstract
This study uses disease surveillance cluster analysis methods to identify clusters for the three most common pediatric cancers in Florida (brain tumors, leukemia, lymphoma). In addition to a univariate purely spatial analysis, a space–time analysis is done, followed by a nonparametric permutation test for space–time interaction. This is followed by a multivariate spatial analysis for the three pediatric cancer types together. The main findings include a significant spatial cluster for each of the three cancer types covered in this study, in addition to identifying two significant clusters for all pediatric cancer types combined.
KEY WORDS::
INTRODUCTION
Cancer is the leading cause of death by disease among children aged 1–14 (CDC Citation2013a). The most common forms of pediatric cancers are leukemia and cancers of the brain and nervous system (NCI Citation2013). The incidence rates for total pediatric cancer, and for lymphoma, leukemia, and brain cancer have increased over time, as indicated by data for the period 1978–2004 (NCI Citation2013) and also for the period 1999–2010 (CDC Citation2013b). The causes of pediatric cancer are poorly understood (Ries et al. Citation1999; NCI Citation2013).
Genetic conditions such as Down syndrome are strongly linked to some childhood cancers. Hispanic ethnicity has been linked to higher incidence for acute myeloid leukemia (Ries et al. Citation1999). Other studies have found that White children, compared to Black children, have higher risk for acute lymphoblastic leukemia (Ries et al. Citation1999). Possible environmental causes of childhood cancers such as exposures to electromagnetic fields (Draper Citation1993) or second-hand tobacco smoke have resulted in inconsistent findings, although a link to paternal smoking seems likely (Boffetta, Trédaniel, and Greco Citation1999; Ries et al. Citation1999; Sorahan et al. Citation2001). A recent study conducted in Italy by Badaloni et al. (Citation2013) found no association between incidence of childhood leukemia and air pollution as measured by particulate matter (PM) 2.5, PM10, ozone, or nitrogen dioxide. However, several recent studies (Heck et al. Citation2013a, Citation2013b; Ghosh et al. Citation2013) have reported associations between some forms of childhood cancer and exposure to air pollutants either early in life or prenatally.
Little is known about possible relationships between water pollution and childhood cancers, and existing studies have found inconsistent results (Makris and Andra Citation2013; Oller-Arlandis and Sanz-Valero Citation2012). Among adults, water pollutants have been linked to breast cancer (Brody et al. Citation2007), and via spatial modeling to total cancer mortality (Hendryx, Fedorko, and Halverson Citation2010; Hendryx et al. Citation2012). Prior research has identified the value of stream ecosystems in predicting cancer mortality rates in West Virginia (Hitt and Hendryx Citation2010); results from this study suggested that the composition of stream invertebrate communities can indicate epidemiological outcomes through indirect exposure pathways related to coal mining carcinogens.
The use of spatial modeling techniques offers a disease surveillance approach to identify existing geographical areas in Florida where pediatric cancer rates are unusually high. This study builds upon prior work by Amin et al. (Citation2010) by incorporating additional years of study and by also using the nonparametric permutation test to test for a space–time interaction (Kulldorff et al. Citation2005). We offer the working hypothesis that pediatric cancers will demonstrate spatial clustering within the state, both on univariate and multivariate levels.
DATA
The childhood cancer incidence counts for ages 0–19 years were obtained from the Florida Association for Pediatric Tumor Programs (FAPTP), which is a reliable source for cancer incidence data in Florida (Krischer et al. Citation1993; Roush et al. Citation1993). The dataset on leukemia, lymphoma, and brain/central nervous system (CNS) cancers included information on several variables, such as date of birth, age, and residence location at the time of cancer diagnosis, sex, in addition to the FAPTP diagnosis code for the years 2000–2010. These codes correspond to the International Classification for Childhood Cancer (ICCC), which incorporates the new codes ICD-O-2 and ICD-O-3. The matching population data were obtained from the 2000 census and the 2010 census, using interpolation for the years 2001–2009. The specific source of the population files is the American Fact Finder of U.S. Census (U.S. Census Bureau Citation2013a), and we use the ZIP Code Tabulation Areas (ZCTAs) as finest level of geographic resolution. Rarely, the ZCTAs change over time and thus there are some ZCTAs that are only available in 2000 or in 2010. For these cases, the population in 2000 and 2010 is used, respectively. For all other cases (the majority), the population is interpolated between the population given for 2000 and for the year 2010. If a ZCTA is only available in the year 2000 (but not in 2010), the population of the year 2000 is used without any adjustment. The setting for SaTscan™ included the following: Precision of case times: Days. Coordinates: Cartesian, Covariate #1, age groups: 1 = 0–4 years, 2 = 5–9 years, 3 = 10–14 years, 2 = 15–19 years. Covariate #2, sex: 1 = male, 2 = female. Population years: 2000, 2010. The codes for brain/CNS cancers used in this study are: 82720, 89400, 90643, 93601, 93623, 93803, 93813, 93831, 93903, 93913, 94003, 94130, 94243, 94303, 94403, 94503, 94703, 94733, 95013, 95083, 95903, 95603. The leukemia codes are: 98003, 98013, 98053, 98203, 98233, 98263, 98273, 98353, 98363, 98403, 98613, 98633, 99313, 99403, 99751, 99891. Finally, the codes for lymphoma are: 95903, 95913, 96503, 96873, 97023, 97273, 99701.
METHODS
In this study, we used the software SaTScan™ (Kulldorff Citation1997; Kulldorff and Information Management Services Inc. Citation2009) due to its capabilities for spatial and space–time analyses. Our application of this software follows methods in Amin et al. (Citation2010); however, we now also include the permutation test and the multivariate cluster analysis (Kulldorff et al. Citation2007) in addition to the spatial analysis and the space–time analysis. We use spatial scan statistics (Kulldorff and Nagarwalla Citation1995) to identify and test for the significance of clusters. We initially used univariate cluster analyses for three response variables (brain tumor, leukemia, lymphoma). This is followed by a multivariate cluster analysis in which these three response variables are jointly analyzed. The geographical units analyzed for the cancer rates are the ZCTAs, where the ZCTAs have been created by the U.S. Census Bureau to avoid some disadvantages of using USPS ZIP codes, which are based on mail delivery routes (U.S. Census Bureau Citation2013b). Census blocks are aggregated to create ZCTAs. The incidence counts in each ZCTA are used either in two dimensions, for a purely spatial analysis, or in three dimensions, for a space–time analysis. We assumed that the incidence of pediatric cancer in each ZCTA is distributed according to a Poisson model. This method tests the null hypothesis that the risk of cancer is the same for all ZCTA units in Florida.
A cancer cluster is defined as a region with a statistically significant excess in the number of cancer cases that occurs, as defined in (CDC Citation2013c). Clusters may be specific to one form of cancer, or to many forms. And usually statistical significance is assessed after controlling for potential confounding variables, such as sex, race, or income.
The spatial scan statistics in SaTScan™ identifies clusters by imposing a window that moves over a map, including different sets of neighboring ZCTAs, as represented by their corresponding centroids. If the window includes the centroid of a specific ZCTA, then this geographical unit is included in the window. The center of the window is positioned only at the ZCTA centroids. For each window, the spatial scan statistic tests the null hypothesis of equal risk of cancer incidence for all ZCTAs against the alternative hypothesis that there exists an elevated risk of cancer incidence within the scan window as compared to ZCTAs outside the window. The software allows a choice between using circular windows and elliptically shaped windows, and the user can choose what the maximum window size should be for the analysis. Throughout this study, we used circular windows, such that an infinite number of circles is created around each centroid, with radii such that anything from zero up to a maximum of 50% of the population is included. SaTScan™ finds the number of cancer cases inside and outside each circle, adjusts for the population sizes, and calculates the likelihood function for each circle. The potentially problematic cluster at that center is the one whose radius maximizes the likelihood function.
SaTScan™ accounts for multiple testing by comparing the maximum likelihood ratio from the actual dataset with the maximum taken over all the evaluated circles, with the distribution of the maximum likelihood ratios based on the datasets that were generated under the null hypothesis. This is the same way by which all scan statistics adjust for multiple testing (Kulldorff Citation1997).
The space–time scan statistic is defined by a cylindrical window with a circular geographic base and with height corresponding to time. The base is defined exactly as for the purely spatial scan statistic, while the height reflects the time period of potential clusters. The cylindrical window is then moved in space and time, so that for each possible geographical location and size, it also considers each possible time period. In effect, we obtain an infinite number of overlapping cylinders of different size and shape, jointly covering the entire study region, where each cylinder reflects a possible cluster. The space–time scan statistic may be used for either a single retrospective analysis or for multiple time-period prospective surveillance analyses. In the latter case, it is possible to adjust the current analysis for previous analyses already conducted by specifying the start date of the prospective surveillance.
It is possible that an identified space–time cluster is in fact driven by purely spatial effects or by purely temporal effects, and it is recommended that a space–time permutation test be used to make sure that what has been identified as a space–time cluster was, in fact, due to a space–time interaction, as opposed to a simple spatial cluster. The space–time permutation scan statistic uses a model that does not need the population data, and the expected number of cancer cases is calculated using only the observed cancer counts. In order to adjust for the very large number of multiple tests, and since the population data are not used, a large number of random permutations of the spatial and the temporal attributes are created. Then, the most likely cluster is calculated for each of the simulated datasets as for the actual datasets. This computer-intensive space–time permutation test adjusts for purely spatial clustering in addition for purely temporal clustering while it accounts for multiple testing (Kulldorff et al. Citation2005).
The likelihood function for the Poisson model is proportional to
where n is the number of cancer incidences within the scan window, N is the total number of cancer incidences in the population, and E is the expected number of cancer incidences under the null hypothesis. Since we are using a one-tailed test that rejects the null hypothesis if there exists elevated cancer risk, an indicator function I is used such that I = 1 when the scan window has a larger number of cancer incidences than expected if the null hypothesis were true, and zero otherwise. It can be shown that for a given N and E, the likelihood increases as the number of incidences, n, increases in the scan window.
Using a Monte Carlo simulation, we generated 999 random replications of the dataset in order to assess the statistical stability for the identified cancer clusters in the program SaTScan™.
The Monte Carlo simulation also allows for the simultaneous controlling of the confounders age and sex. The identified cancer clusters are listed by SaTScan™ in order of significance. SaTScan™ first identifies a “most likely cluster,” followed by “secondary clusters” such that the p-value for each cluster is compared to a preset significance level of 0.05. The more recent versions of SaTScan™ use a Gumbel approximation for the p-values, making it possible to obtain more precise p-values for given number of Monte Carlo replicates (Abrams, Kleinman, and Kulldorff Citation2010). Without the use of this new result, it was previously necessary to use 10 times as many simulated replicates to obtain an additional digit for the p-values. An added advantage of the new approach is the fact that the approach based upon the Gumbel distribution has smaller variability than the Monte Carlo based p-values, in addition to slightly higher statistical power.
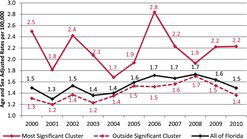
Table 1. Univariate purely spatial cluster analysis of age and sex-adjusted incidence rates
There are two possible approaches in SaTscan™ for adjusting the cancer rates for one or more covariates, such as age and sex. The first approach is to first use a Poisson regression to predict cancer counts from a covariate, such as age. This is followed by outputting the predicted cancer counts, and then using the predicted values as the population file in SaTScan™, while the actual cancer counts are used in the case file. The second approach is to do such an adjustment in SaTScan™ directly and without first running a regression analysis, using the input files. In such a case, one enters the covariates as extra columns in the case file and in the population file into SaTScan™. For the Poisson model, indirect standardization is used to calculate the covariate-adjusted expected cancer counts (Kulldorff and Information Management Services Inc. Citation2009). We adjusted for covariates using the input files, the second method. Prates, Kulldorff, and Assunção (Citation2014) conclude that the scan statistic has high power for correctly identifying a cluster, and they evaluated whether there is any bias in the estimated risks for the identified clusters. They concluded that the purely spatial scan statistic has no major bias in its estimates and that the estimated relative risks are slightly biased upward for clusters with low power, while clusters with medium to high power have negligible bias for the relative risks.
In this study, we present cancer clusters identified by circular windows with SaTScan™, as it is the shape that has been most widely used (Kulldorff and Information Management Services, Inc. 2009; Amin et al. Citation2010).
RESULTS
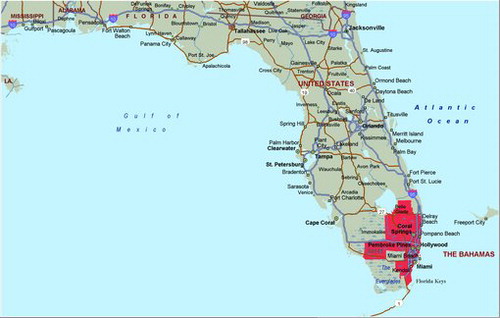
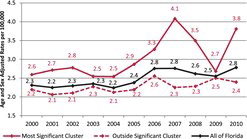
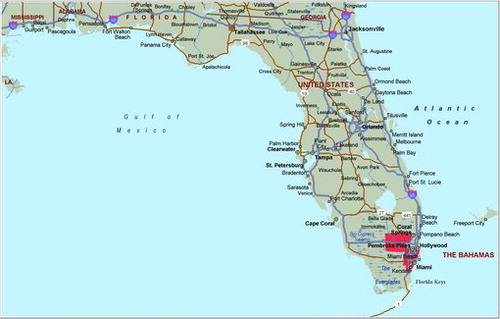
The purely spatial analysis of the FAPTP dataset at the ZCTA level on brain tumor/CNS cancer rates (adjusted for age and sex) with the SaTScan™ software revealed one significant (most likely) cluster in the southern part of the state, close to Miami. The most likely cluster is the cluster with the largest likelihood ratio in the cluster analysis. It is the cluster that has the highest probability of not being due to some random causes. Across the entire state, after adjusting for age and sex covariates, there was a total of 1194 brain tumor/CNS cancer cases identified with a corresponding incidence rate of 2.5 average annual cases per 100,000. In this cluster, there were 409 observed cases and 334.8 expected cases, with a relative risk (RR) of 1.34, implying that compared with the state there is a statistically significant 34% increased risk of childhood brain tumor (p = 0.012). shows incidence rates for pediatric brain cancers after adjusting for age and sex, and shows the brain cancer tumor rates after adjusting for age and sex. In , the red solid line gives the rates for the most likely cluster, while the dotted red line gives the brain tumor rates for the rest of Florida. The solid black line gives the rates for all of Florida.
Table 2. Cancer rate estimates (out of 100,000) and standard deviations (mean, SDV)
Table 3. Multivariate cluster for age and sex adjusted cancer rates (p = 0.0038)
Since a purely spatial analysis (for the period 2000–2010) cannot show when the cluster was formed, a space–time analysis was performed, assessing the south Florida cluster using the Poisson model within SaTScan™. We observed that the spatial dimensions of the cluster persisted north of Miami during these periods. South Florida emerged as the most likely temporal cluster with elevated risk during 2006–2010. Whereas the observed cases were 208, the expected were 145.5, so the relative risk was RR = 1.52, and the significance probability was p = 0.019, implying a significant 52% increase in childhood brain tumor rates in south Florida compared with the state of Florida. The coordinates for this cluster are (26.006735 N, 80.460152 W), with a radius of 81.22 km and a population of 1,221,660. In order to verify that the space–time cluster is not due to a statewide increase in brain tumor rates, we conducted a nonparametric permutation test (Kulldorff et al. Citation2005), which was not significant, with p = 0.88. This implies that we do not have a space–time interaction in Florida for childhood brain tumors.
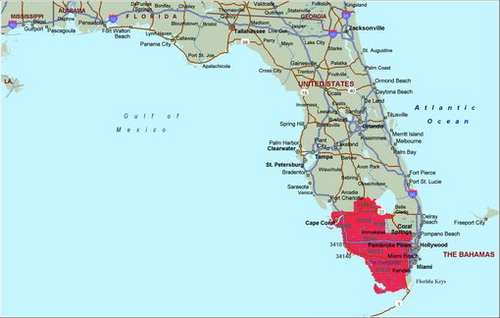
The purely spatial analysis of leukemia rates (adjusted for age and sex) with SaTScan™ identified one region northwest of Miami in south Florida (during the period of 2000–2010), similar to the cluster areas identified for the brain/CNS, but with a location shift to the northwest. A total of 1833 leukemia cases in the state were identified and used in this analysis. There was a statistically significant cluster in south Florida, (RR = 1.35, p = 0.029) (). The coordinates for this cluster are (26.180909 N, 81.605313 W), with a radius of 132.77 km and a population of 514,632. The space–time analysis of the leukemia cases identified a small cluster around Clearwater, but the permutation test again did not support a space–time interaction (p = 0.38), so we conclude this is a purely spatial leukemia cluster. The purely spatial analysis indicated that leukemia rates in the south Florida cluster area remained elevated throughout the entire period (2000–2010), when compared to the state.
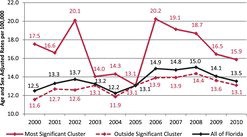
gives the age and sex adjusted leukemia rates for the years 2000–2010.
A purely spatial analysis of lymphoma again identified an area northwest of Miami in south Florida as the most likely cluster. Of the 745 cases identified in the state, there were 160 observed cases and 113.7 expected cases in this region. The relative risk comparing Florida to south Florida is, RR = 1.52, p = 0.024 (). The coordinates for this cluster are (25.779298 N, 80.198739 W), with a radius of 30.69 km and a population of 670,220. A space–time analysis of lymphoma cases was not significant, with p = 0.094. The purely spatial analysis indicated that lymphoma rates in the south Florida cluster area remained elevated throughout the entire period (2000–2010), when compared to the state. gives the age and sex-adjusted lymphoma rates for the years 2000–2010.
The results for the univariate analyses, for each of the three types of cancer separately, are shown in .
Estimates of cancer rates (out of 100,000) and the corresponding 95% confidence intervals are given in .
The three types of pediatric cancers (brain, leukemia, lymphoma) are relatively rare cancers, and the statistical power of the likelihood ratio test used in the cluster analysis may be lower than if we simultaneously analyzed the data with a multivariate cluster analysis in which the variance-covariance structure of the multivariate observations will provide a more powerful test. The multivariate approach has better statistical properties than obtained by simply adding up all pediatric cancer cases and then using a univariate cluster analysis. When searching for clusters with high cancer rates, the multivariate scan statistic with multiple datasets works as follows: (i) the log-likelihood ratio (for each window location and size) is calculated for each dataset; (ii) when datasets have more than the expected number of cancer cases, the log-likelihood ratios for such datasets are summed up, and the resulting sum is considered the likelihood for that particular window; (iii) the most likely cluster has the maximum of all the summed log-likelihood ratios, taken over all the window locations and sizes, which is evaluated in the same way as is done in the univariate case for a single dataset (Kulldorff and Information Management Services Inc. Citation2009). Since the different datasets, types, and streams are independent under the null hypothesis, the null distribution for the multivariate scan statistic does not use the covariance information.
A multivariate purely spatial cluster analysis with the SaTScan™ software, set to identify any cluster in a three-dimensional space, resulted in one significant cluster. This cluster is located close to Miami, and it is similar in shape to the cluster for leukemia, which is not unexpected since leukemia is the pediatric cancer with the highest incidence rate among all cancer types.
The SaTScan™ output lists information on the three cancer types for this cluster (Data Set 1 = Brain/CNS, Data Set 2 = Leukemia, Data Set 3 = Lymphoma), as given in . The multivariate cluster is significant (p = 0.0038), with RR = 1.03 for brain/CNS, RR = 1.31 for leukemia, and RR = 1.46 for lymphoma (). The coordinates for this cluster are (25.942742 N, 81.383188 W), with a radius of 109.00 km and a population of 536,504. The p-value for the multivariate analysis is much smaller than any of the individual p-values for the three univariate analyses.
While the role of brain/CNS in the multivariate cluster seems to be minor, both leukemia and lymphoma display higher incidence rates than the rest of Florida, with leukemia rates being 31% higher, and lymphoma being 46% higher, in a purely spatial analysis for the years 2000–2010. No other significant multivariate cluster has been identified for Florida.
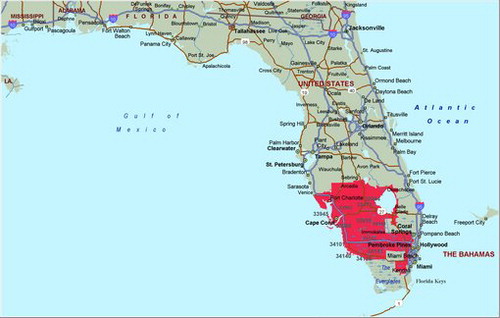
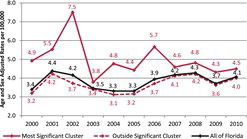
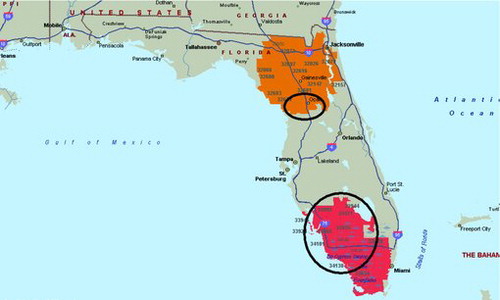
Following Amin et al. (Citation2010), we also did a cluster analysis for all pediatric cancer cases of all types. The purely spatial analysis of the pediatric cancer rates (adjusted for age and sex) with SaTScan™ identified two significant clusters. The most likely cluster in (shown in red) is located to the west and south of Lake Okeechobee for the period of 2000–2010, with RR = 1.29 and p < 0.000001. The significant secondary cluster (shown in orange) is located in the northern part of Florida, with RR = 1.28 and p < 0.00001. A second-round cluster analysis for each of the two significant clusters identifies a hot spot northwest of Orlando around Ocala (RR = 2.26, p < 0.00001), and a hotspot west of Lake Okeechobee (RR = 2.19, p < 0.00001), as shown with circles in . The total cancer rates (adjusted for age and for sex) are given in for the years 2000–2010.
DISCUSSION
Our study identified significant pediatric clusters based on age- and sex-adjusted cancer incidence rates. A cluster analysis of brain/CNS rates resulted in one significant purely spatial cluster (p = 0.012) located in the southern part of Florida, stretching from Lake Okeechobee to south of Miami, with a relative risk of 1.34. shows that the cluster area had elevated brain tumor rates throughout 2000–2010, with a peak in 2007, as reported in Amin et al. (Citation2010). After 2007, the rates dropped in 2008 and 2009, but there is a sharp increase seen for 2010.
We also uncovered a significant leukemia cluster (p = 0.029) in the southern part of Florida, starting from west of Lake Okeechobee and stretching down south to Miami on the eastern Florida coast, with a relative risk of 1.35 for age and sex adjusted rates. shows that the cluster had elevated rates throughout 2000–2010, with a peak in 2002, and then stayed higher than the rates in Florida for the remaining years.
In recent years, there were two prominent cancer cluster investigations for this part of Florida.
In the late 1990s, an unusually large number of pediatric cancers for brain/CNS was reported in St. Lucie County, with claims that releases of Strontium 90 from the St. Lucie nuclear power station may have been linked to the high rate of cancers. Boice et al. (Citation2005) studied mortality rates for the period 1950–2000, without being able to identify associations between cancer mortality rates and the operation of the St. Lucie nuclear power station for St. Lucie County. The other investigation of a suspected brain cancer cluster in this region occurred in Palm Beach County in 2009, known as The Acreage. The investigation by the Florida Department of Health did not result in identification of environmental factors for the Acreage-suspected cancer cluster. The National Academy of Sciences (NAS) is currently conducting a study on a potential cancer risk from living near a reactor that is operating normally. The U.S. Nuclear Regulatory Commisson (NRC) asked the NAS to conduct this study (NRC Citation2013).
The lymphoma cluster (p = 0.024) is smaller in geographical size, and it is located north of Miami. This cluster has relative risk of 1.52. shows the cluster to have consistently higher lymphoma rates than the rest of Florida, with a peak in 2006. When analyzing all pediatric cancer types combined, the most likely cluster spiked in 2006, and it stayed higher than the rest of Florida after 2006.
The cluster analysis results for the three cancer types and the total cancer rates are similar to what Amin et al. (Citation2010) concluded. The three most widely recorded pediatric cancer types all occur in a geographical area that is close to Miami and to Lake Okeechobee. The relative risk values are not small, indicating cancer rates that are higher than what is found in other parts in Florida by 35%–52%. The multivariate likelihood ratio test has more statistical power than any of the univariate tests above, and it identifies an area that is similar in coverage as the leukemia cluster, with relative risk values for lymphoma (RR = 1.31) and for leukemia (RR = 1.46), with p = 0.0038. It is notable that only the multivariate tests identified clusters that also included the Everglades. This is most likely due to the additional statistical power of this test. While we obtained significant space–time clusters for each of these three cancer types, a follow-up nonparametric permutation test indicated for each cancer type that there was no space—time interaction and that the elevated cancer rates were purely spatial for 2000–2010. This implies that the increase in cancer rates has been consistent throughout 2000–2010. The (univariate) results in this study do not differ much from the results that were obtained by Amin et al. (Citation2010) with FAPTP data for the years 2000–2007, except that there was a sharp increase in pediatric cancers from 2005–2007, with a significant space–time interaction in Amin et al. (Citation2010). We have used data for 2000–2010, and this allowed us to obtain more accurate estimates of population counts for the years 2001–2009 by interpolating linearly between the census years 2000 and 2010, in addition to the use of the nonparametric permutation test and the multivariate likelihood ratio test. The cluster analysis of all pediatric cancer types combined resulted in two significant clusters. It is our belief that disease surveillance studies such as ours can assist health departments in focusing their resource more efficiently upon potentially problematic regions that are identified through careful statistical analysis.
Trumbo (Citation2000) studied the frequency of requests from health departments to look into suspected cancer clusters. This study discovered that in 1997 alone there were approximately 1100 cluster investigation requests, where very few such requests were determined to justify a significant investigation. Cluster analysis is a powerful statistical tool that can identify geographical areas and the associated times during which cancer rates were unusually high. It provides a necessary methodology that can be used to highlight hotspots, which then can be studied further with epidemiological methods by the health authorities.
REFERENCES
- Abrams, A.M., Kleinman, K., and Kulldorff, M. (2010Gumbel Based P-Value Approximations for Spatial Scan Statistics,” International Journal of Health Geographics, 9, 1–12.
- Amin, R., Bohnert, A., Holmes, L., Rajasekaran, A., and Assanasen, C. (2010Epidemiologic Mapping of Florida Childhood Cancer Clusters,” Pediatric Blood and Cancer, 54, 511–518.
- Badaloni, C., Ranucci, A., Cesaroni, G., Zanini, G., Vienneau, D., Al-Aidrous, F., De Hoogh, K., Magnani, C., and Forastiere, F. (2013Air Pollution and Childhood Leukaemia: A Nationwide Case-Control Study in Italy,” Occupational and Environmental Medicine, 70, 876–883.
- Boffetta, P., Trédaniel, J., and Greco, A. (1999), Parental Tobacco Smoke and Childhood Cancer, Background Paper, World Health Organization. Available at www.who.int/tobacco/media/en/boffetta.pdf.
- Boice Jr., J.D., Mumma, M.T., Blot, W.J., and Heath Jr., C.W. (2005Childhood Cancer Mortality in Relation to the St. Lucie Nuclear Power Station,” Journal of Radiological Protection, 25, 229–240.
- Brody, J.G., Rudel, R.A., Michels, K.B., Moysich, K.B., Bernstein, L., Attfield, K.R., and Gray, S. (2007Environmental Pollutants, Diet, Physical Activity, Body Size, and Breast Cancer,” Cancer, 109, 2627–2634.
- Centers for Disease Control and Prevention (CDC) (2013aTen Leading Causes of Death and Injury,” available at www.cdc.gov/injury/wisqars/leadingcauses.html
- ——— (2013b), National Program of Cancer Registries (NPCR), United States Cancer Statistics (USCS), Childhood Cancer. Available at http://apps.nccd.cdc.gov/uscs/ChildhoodCancerData.aspx.
- ——— (2013cCancer Clusters,” available at http://www.cdc.gov/NCEH/clusters/default.htm.
- Draper, G. (1993Electromagnetic Fields and Childhood Cancer,” British Medical Journal, 307, 884–885.
- Ghosh, J.K. C., Heck, J.E., Cockburn, M., Su, J., Jerrett, M., and Ritz, B. (2013Prenatal Exposure to Traffic-related Air Pollution and Risk of Early Childhood Cancers,” American Journal of Epidemiology, 178, 1233–1239.
- Heck, J.E., Park, A.S., Qiu, J., Cockburn, M., and Ritz, B. (2013aAn Exploratory Study of Ambient Air Toxics Exposure in Pregnancy and the Risk of Neuroblastoma in Offspring,” Environmental Research, 127, 1–6.
- Heck, J.E., Wu, J., Lombardi, C., Qiu, J., Meyers, T.J., Wilhelm, M., Cockburn, M., and Ritz, B. (2013bChildhood Cancer and Traffic-Related Air Pollution Exposure in Pregnancy and Early Life,” Environmental Health Perspectives, 121, 1385–1391.
- Hendryx, M., Conley, J., Fedorko, E., Luo, J., and Armistead, M. (2012Permitted Water Pollution Discharges and Population Cancer and Non-Cancer Mortality: Toxicity Weights and Upstream Discharge Effects in US Rural-Urban Areas,” International Journal of Health Geographics, 11, 1–15.
- Hendryx, M., Fedorko, E., and Halverson, J. (2010Pollution Sources and Mortality Rates Across Rural-Urban Areas in the United States,” The Journal of Rural Health, 26, 383–391.
- Hitt, N.P., and Hendryx, M. (2010Ecological Integrity of Streams Related to Human Cancer Mortality Rates,” EcoHealth, 7, 91–104.
- Krischer, J.P., Roush, S.W., Cox, M.W., and Pollock, B.H. (1993Using a Population-Based Registry to Identify Patterns of Care in Childhood Cancer in Florida,” Cancer, 71, 3331–3336.
- Kulldorff, M. (1997A Spatial Scan Statistic,” Communications in Statistics—Theory and Methods, 26, 1481–1496.
- Kulldorff, M., Heffernan, R., Hartman, J., Assunção, R., and Mostashari, F. (2005A Space–Time Permutation Scan Statistic for Disease Outbreak Detection,” PLoS Medicine, 2, 216–224.
- Kulldorff, M., and Information Management Services, Inc. (2009SaTScan: Software for the Spatial and Space-Time Scan Statistics,” available at www.satscan.org.
- Kulldorff, M., Mostashari, F., Duczmal, L., Yih, W.K., Kleinman, K., and Platt, R. (2007Multivariate Scan Statistics for Disease Surveillance,” Statistics in Medicine, 26, 1824–1833.
- Kulldorff, M., and Nagarwalla, N. (1995Spatial Disease Clusters: Detection and Inference,” Statistics in Medicine, 14, 799–810.
- Makris, K.C., and Andra, S.S. (2014Limited Representation of Drinking-Water Contaminants in Pregnancy–Birth Cohorts,” Science of the Total Environment, 468–469, 165–175.
- National Cancer Institute (NCI) at the National Institutes of Health (2013FactSheet, Childhood Cancers,” available at www.cancer.gov/cancertopics/factsheet/Sites-Types/childhood.
- Nuclear Regulatory Commission (NRC) (2013Backgrounder on Analysis of Cancer Risk in Populations Near Nuclear Facilities—Phase 2 Pilot Study,” available at www.nrc.gov/reading-rm/doc-collections/fact-sheets/bg-analys-cancer-risk-study.html.
- Oller-Arlandis, V., and Sanz-Valero, J. (2012Cancer in the Population under 19 Years of Age Caused by Chemical Contamination in Drinking Water: A Systematic Review,” Revista Panamericana de Salud Pública, 32, 435–443.
- Prates, M.O., Kulldorff, M., and Assunção, R.M. (2014Relative Risk Estimates From Spatial and Space–Time Scan Statistics: Are They Biased?'' Statistics in Medicine (forthcoming).
- Ries, L.A. G., Smith, M.A., Gurney, J.G., Linet, M., Tamra, T., Young, J.L., and Bunin, G.R. (eds.) (1999), Cancer Incidence and Survival among Children and Adolescents: United States SEER Program 1975–1995, National Cancer Institute, SEER Program. NIH Pub. No. 99–4649.
- Roush, S.W., Krischer, J.P., Cox, M.W., Bayer, J., Pollock, N.C., Wilkinson Jr., A.H., and Talbert, J.L. (1993), ``Progress in Childhood Cancer Care in Florida. 1970–1992,'' The Journal of the Florida Medical Association, 80(11), 747–751.
- Sorahan, T., McKinney, P.A., Mann, J.R., Lancashire, R.J., Stiller, C.A., Birch, J.M., Dodd, H.E., and Cartwright, R.A. (2001Childhood Cancer and Parental Use of Tobacco: Findings From the Inter-Regional Epidemiological Study of Childhood Cancer (IRESCC),” British Journal of Cancer, 84, 141–146.
- Trumbo, C.W. (2000Public Requests for Cancer Cluster Investigations: A Survey of State Health Departments,” American Journal of Public Health, 90, 1300–1302.
- U.S. Census Bureau (2013aAmerican FactFinder,” available at http://factfinder2.census.gov.
- ——— (2013bGeography,” available at www.census.gov/geo/reference/zctas.html.