
 ?Mathematical formulae have been encoded as MathML and are displayed in this HTML version using MathJax in order to improve their display. Uncheck the box to turn MathJax off. This feature requires Javascript. Click on a formula to zoom.
ABSTRACT
As states and districts incorporate value-added estimates into multiple-measures systems of teacher evaluation, it has become increasingly important to understand how to model value added when the same student is taught the same subject by multiple teachers. Roster data on teacher–student links that have been checked and confirmed by the teachers themselves show levels of co-teaching far beyond what appear in administrative data. Therefore, to help states and districts overcome a potential limitation in the use of value added, we propose and examine three methods estimating teacher value added when students are co-taught: the Partial Credit Method, Teacher Team Method, and Full Roster Method. The Partial Credit Method apportions responsibility between teachers according to the fraction of the year a student spent with each. This method, however, has practical problems limiting its usefulness. The Teacher Team Method and Full Roster Method presume that co-teachers share joint responsibility for the achievement of their shared students. We explore the properties of these methods and compare empirical estimates. Both methods produce similar estimates of teacher value added, but the Full Roster Method can be more easily implemented in practice.
1. Introduction
We propose methods to account for student sharing when estimating value-added models of teacher performance. Encouraged in part by the Obama administration's Race to the Top competition for federal funding and waivers to the Elementary and Secondary Education (No Child Left Behind) Act, measures of teacher performance based on student test scores have begun to play a prominent role in teacher evaluation systems. School districts have combined these quantitative methods with teacher observations (and sometimes other metrics) to make high-stakes decisions on performance pay and in some cases even tenure and retention (Duffrin Citation2011; District of Columbia Public Schools Citation2011). One popular approach to measuring teacher effectiveness is a value-added model, which seeks to isolate the contribution that teachers make to student achievement, accounting for their students' prior test scores and other background characteristics.Footnote1A vexing question for policymakers and value-added developers is how to adapt a value-added framework to evaluate teachers who share responsibility for student learning. To help answer this question, we lay out the relative practical and theoretical merits of three statistical methods that can be used to estimate value-added models when there is shared responsibility for students. We then compare the results of two methodsCitationusing data from a largeCitationurban district that incorporated value added as part of a multiple-measure system of teacher evaluation, and asked us to design a value-added model in partnership with them.Footnote2
An important prerequisite for implementing a value-added model is accurate data linking students to teachers. As such, states and districts have begun to use a procedure known as roster confirmation (or roster verification), in which teachers are asked to confirm whether or not they taught the students assigned to them according to the administrative database of teacher–student links. According to Battelle for Kids (BFK), an organization that has assisted many districts by conducting roster confirmation, during the 2012–2013 school year, across a range of districts and states in which they worked, “nearly one in four teachers had incorrect or incomplete content area association” and “more than one in three rosters were inaccurate and required changes during roster verification” (BFK Citation2013). Absent roster confirmation, teachers will not only be linked to many of the wrong students but also in some cases to the wrong subject areas (Bel Hadj Amor et al. Citation2013; Isenberg et al. Citation2015). Roster confirmation has thus become to be recognized as a necessity for states and districts that intend to use value added as a component of teacher evaluation systems.
Confirmed roster data that we received from the district demonstrate extensive student sharing among teachers. Of the teachers in the tested grades who had at least 15 math students, 21% taught students who were also educated in math by another teacher that year. Almost 7% of teachers shared all their students; 6% shared between 20% and 99% of their students, and 9% shared more than zero and less than 20% of their students. Data for teachers of English/language arts are similar. In some cases, two or more teachers were jointly responsible for a classroom of students at the same time. In other cases, groups of students were taught by one teacher for part of the year and another teacher for the rest of the year. We refer to both types of cases as “co-teaching.” The prevalence of co-teaching in roster-confirmed data suggests the need to adapt value-added models that would presume a one-to-one correspondence between teachers and students, but there has been little literature addressing this issue.
We focus in this article on ways in which fixed effects models of teacher value added might be adapted to account for co-teaching because these types of models are most clearly supported by research. Han et al. (Citation2012) found similar results when estimating teacher effectiveness in their data using the student growth percentile method, an average residuals approach, or teacher fixed effects. Subsequent literature, however, has argued that the first two approaches may lead to biased estimates of teacher effectiveness (Ehlert et al. Citation2013; Goldhaber et al. Citation2013; Guarino et al. Citation2015a, Citation2015b; Walsh and Isenberg Citation2015). The teacher fixed effects approach—in which student post-test scores are regressed on one or more student pre-test scores, other student characteristics, and teacher fixed effects—has been found to exhibit no significant forecast bias when tested using a quasi-experimental method (Chetty et al. Citation2014; Bacher-Hicks et al. Citation2014; Rothstein Citation2015). The teacher fixed effects approach has also been shown to be robust to many different data-generating processes (Guarino et al. Citation2015a). In addition, this approach has also been used commonly in practice by school districts or states that have adopted value-added models to measure teacher effectiveness, in part because the fixed effects approach can account for correlations between teacher assignments and student characteristics, rather than assuming that this process is random. For example, if more effective teachers tend to work in schools with fewer disadvantaged students (or vice versa), a fixed effects approach will avoid the potential bias that could arise from this type of sorting.Footnote3
Han et al. (Citation2012) also suggested three approaches to handling co-teaching. Two of them involve converting the data on the percentage of the student's instructional time for which the teacher is responsible—the teacher–student “dosage”—to either create a full-time link between a teacher and a student or to create no link between them. Policymakers at the district with which we were working, however, ruled out these approaches. They indicated that teachers perceive that value added will be fairer if, during the roster confirmation process, they can indicate not only whether they taught a student but for how long they taught the student, and know that this information will be directly incorporated into their value-added estimate. Therefore, despite the potential similarity of value-added results that would use discrete or continuous dosage information, this option was not politically feasible in the real-world context in which we were designing a value-added model. The third approach examined by Han et al. (Citation2012) is equivalent to the first of three dosage-based approaches we propose. We call the three methods (1) the Partial Credit Method, (2) the Teacher Team Method, and (3) the Full Roster Method.
The Partial Credit Method is based on the idea that each teacher provides an individual, distinct input into students' achievement, and so when a student has multiple teachers, each makes a separate value-added contribution. This is assumed to be true both for cases in which a student splits time between teachers and those in which teachers co-teach students in the same classroom. To model the Partial Credit Method, the teacher–student link variables are allowed to take continuous dosage values. When every student is linked to a single teacher for the entire school year, each teacher is represented by an indicator variable that takes the value one if a given student is linked to this teacher and zero otherwise. With the Partial Credit Method, these variables are allowed to take any value between zero and one to represent the proportion of the year a student was linked to a teacher. This method presents problems when teachers claim many students in common but teach a few students individually—a common occurrence in the district we studied. In these cases, near-collinearities among the teacher measures result in statistically unstable coefficient estimates.Footnote4 For this reason, we did not consider this approach to be a viable one for estimating teacher value added in the district—or in any district that would collect similar roster confirmation data.Footnote5
The Teacher Team Method, by contrast to the Partial Credit Method, assumes that the combined effect of two or more teachers is a distinct input into student achievement, rather than the sum of separate individual effects. To implement this method, we add team variables to the model to capture the joint effect of two or more teachers on student achievement. For a teacher who instructs students both individually and as part of a team (or as part of multiple teams), we extract a single value-added estimate of effectiveness by averaging together estimates for that teacher and his or her teaching teams. This method eliminates the collinearities inherent in the Partial Credit Method at the cost of making it impossible to estimate the distinct contribution that each teacher makes to the team. As a practical matter, however, it can be difficult to implement the Teacher Team Method; there is often a loss of information because not all students can be linked to teachers.Footnote6
The third method we consider, the Full Roster Method, is a practically motivated approach that seeks to approximate the Teacher Team Method and is not guided by another distinct functional model of how educational inputs translate into student achievement. With the Full Roster Method, instead of adding variables for teacher teams, student records are replicated so that each teacher–student combination contributes one dosage-weighted observation to the regression. The Full Roster Method is robust to a wide variety of teaming arrangements. In practice, it also enables more links between teachers and students to be maintained than does the Teacher Team Method. Perhaps the most surprising result, however, is that the Full Roster Method, in its simplest version (without any covariates), produces identical results to the Teacher Team Method. When we compare empirical results across the two methods in a full value-added model that includes covariates, we find that the results are nearly identical. Since neither of these models can be considered a gold standard, this does not imply that one or both of these methods necessarily provides unbiased estimates of value added. It shows instead that the Full Roster Method, a value-added model that at first appears to be an ad hoc method of avoiding collinearity, is in fact an alternate means by which to implement a model of shared responsibility, without the loss of information involved in implementing the Teacher Team Method.
Due to the simplicity of implementing the Full Roster Method and its equivalence to the Teacher Team Method, it has been adopted to model co-teaching not only in evaluation contexts, but also in research that has relied on value-added models and has confronted the real-world data problems introduced by co-teaching. For example, Hansen et al. (Citation2014) and Steele et al. (Citation2014) cited an earlier version of this article (Hock and Isenberg Citation2012) as the justification of their use of the Full Roster Method. Gnagey (Citation2013) used simulation methods to examine how different co-teaching methods perform when they are consistent or not consistent with the data-generating process for that model, and found that the Teacher Team Method and Full Roster Method perform equivalently when data are simulated under an assumption that team teaching constitutes a distinct input into student achievement.
The remainder of this article proceeds as follows: in Section 2, we define the three methods more precisely, and lay out the decisions that need to be made when implementing the Teacher Team Method. We discuss the practical concerns with the Partial Credit Method and conclude this section by discussing why the Teacher Team Method and Full Roster Method produce identical results in a model without covariates. In Section 3, we provide a case study of using the Teacher Team and Full Roster Methods by showing how we implemented them using roster-confirmed data from a large urban district. In Section 4, we outline the value-added models we estimated to implement both approaches. In Section 5, we show the similarity of empirical estimates of teacher value added using the two approaches. Section 6 concludes by discussing the practical implications of these results for school district leaders and developers of value-added models.
2. Methods Considered
2.1. Partial Credit Method
Of the three methods we considered, the Partial Credit Method was the least effective for accounting for co-teaching in the school district. This method modifies a basic fixed-effects value-added model by allowing teacher variables to take continuous dosage values ranging from zero to one, rather than discrete values of zero or one. In this approach, we estimated
(1)
(1) where yi is the end-of-year test score for student i (the post-test score) and the vector zi represents student-level covariates, including one or more pre-tests from prior years. The K-dimensional vector wi measures the student's dosage attributed to each of K teachers in the school district, with the kth element, wik, denoting the share of instruction for student i with teacher k. Students who were co-taught or moved between teachers have multiple nonzero entries in wi. Finally, π and ψ are parameters to be estimated, and ϵi is an independent and identically distributed error term.
Each teacher dosage is then the percentage of the year that the student spent in the particular teacher's classroom.Footnote7 For example, if a student switched teachers halfway through the year, each teacher would receive a 0.5 dosage for that student. Similarly, if two teachers both taught a student for the entire year, each teacher would receive a dosage of 0.5.Footnote8 Because teacher effects in this model are additive and linear, the Partial Credit Method implicitly assumes that one unit of a teacher's time has a constant effect on each student, regardless of which part of the year or which days of the week the student was in the classroom, and that there are no interactions between teachers. Thus, the model embodies the notion that each teacher is individually responsible for a distinct component of the achievement of shared students.
Although the Partial Credit Method theoretically allows one to estimate distinct effects for all K teachers in the system, this method did not yield reliable estimates for teachers in the school district with which we worked. The Partial Credit Method is limited to cases in which relatively few students switch between any pair of teachers during the year. The method does not work as well when teachers share blocks of students, as was the case in our district. In this case, an outlier estimate for one teacher (which could arise solely by chance) would skew estimates for others who co-taught students with that teacher. More problematic is that some teachers in the district shared almost all their students, teaching only a few individually. In such cases, teacher estimates were essentially identified from the changes in achievement of a small number of solo-taught students, resulting in unstable coefficients. Due to these issues, we do not consider this approach further.
2.2. Teacher Team Method
The Teacher Team Method is an alternative that involves modifying the column space of the data matrix to add team variables when teachers' students overlap. If two teachers share all their students, the teacher team variable replaces the variables corresponding to the individual teachers. For the Teacher Team Method, we estimated
(2)
(2) The notation parallels that of Equation (Equation1
(1)
(1) ). In Equation (Equation2
(2)
(2) ), θ and γ are parameters to be estimated, and ξi is an independent and identically distributed error term.
Instead of modeling only individual teachers, as in Equation (Equation1(1)
(1) ), however, each element of the M-dimensional vector ci corresponds to an individual teacher or to a teacher team. That is, we retain all individual teacher variables (unless the teacher co-teaches all of his or her students) and add to them the team variables. Each team variable represents the joint effect of two or more teachers on student growth, and can be thought of as an interaction term in the regression. Once teams are specified, teacher and team coefficients may be estimated by applying ordinary least squares (OLS) to Equation (Equation2
(2)
(2) ).
In the purest form of the Teacher Team Method, either a team or an individual is wholly responsible for all of the student's instructional time during the school year. Hence, a single element of ci is equal to one, and the rest are zero. In other words, team teachers are considered to be jointly responsible for the achievement of their students. With this modeling strategy, it is not possible to recover the distinct contribution that individual teachers make to the team.
Unlike the Partial Credit Method, the coefficient estimates are not vulnerable to instability due to teaming arrangements. Because there is one teacher or team variable for each student, the estimated effects of teachers and teams are not directly correlated with one another, as they are in the Partial Credit Method. This insulates teachers and teams from one another, resulting in more stable coefficient estimates.
The Teacher Team Method may, however, be adapted so that team variables are only formed for selected groups of teachers. For example, teams may be limited to teachers within the same school. Another possibility is that team variables can be formed only for teachers who have some minimum number of students in common. In these cases, it is possible to apply a hybrid method that uses elements of both the Teacher Team Method and the Partial Credit Method. For example, in the case of forming teams only within schools, a continuous dosage variable is used to model the cumulative effect of teachers on students who switch schools mid-year. So a student who switches mid-year from School A to School B would be linked to a teacher (or team) in School A and another teacher (or team) in School B, with a dosage for each reflecting the proportion of the year spent in that school. All students who attend a single school for the whole year would be linked to a single teacher or team using an indicator variable.
2.2.1. Granularity of Teams
Teacher teams may be defined with varying levels of detail. Fully interacted teams represent unique combinations of (1) a set of teachers with shared students and (2) a dosage contribution for each teacher. Thus, if Teacher A taught a group of students for one-half of the year and Teacher B taught them for the other half, this would constitute a different fully interacted team than one in which Teacher A taught students for one-third of the year and Teacher B taught them for the remaining two-thirds. Aggregated teams, on the other hand, simply represent unique sets of co-teachers. Thus, the two fully interacted teams in the previous example would compose a single aggregated team. This approach implicitly assumes that team effects do not vary according to the mix of dosage contributions from each teacher.
2.2.2. Combining Effects for Teachers with Multiple Estimates
We create a single “overall” estimate of effectiveness for teachers who receive multiple estimates because they belong to multiple teams or because they both belong to a team and teach students individually. This overall teacher effect, , is the weighted average of the relevant regression coefficients using the total student dosage associated with each estimate as weights. Specifically,
(3)
(3) where Mk denotes the set of teams to which teacher k belongs (including the solo “team” consisting of just teacher k), dkm is the sum of teacher k's dosage from students taught within teacher team m, Dk is the total dosage for teacher k from students taught in all teams (i.e.,
), and
is the estimated combined achievement effect of teacher group m. For example, if Teacher A individually taught 15 students and shared another 10 students equally with Teacher B, the regression would produce a Teacher A-alone effect and a Team-AB effect. Assuming both teachers receive half credit for each shared student, the total share of students from this group for Teacher A would be 0.5 × 10 = 5. As a result, the teacher's overall effectiveness measure would be estimated as 15/20 × [Teacher-A-alone estimate] + 5/20 × [Team AB estimate].
2.3. Full Roster Method
The Full Roster Method accounts for co-teaching by expanding the row space but not changing the column space of the data. This method does not require all possible teams of teachers to be characterized based on the data. Instead, the Full Roster Method produces one regression estimate for each teacher, which represents an overall estimate of effectiveness. The regression is based on a series of variables for each of the K teachers (but no team variables). Student records are replicated so that each teacher–student combination is a unique observation. Thus, each teacher is associated with a set of records that covers all of his or her students, regardless of whether or not they are taught by other teachers.
For the Full Roster Method, we estimated
(4)
(4) where k denotes a teacher to whom student i is linked. Each replicated observation has only one teacher indicator variable set to one, and is weighted according to the fraction of the year the student spent with that teacher. Thus, the elements of the K-dimensional vector of teacher indicators, tik, are uniformly zero except for the kth element (i.e., tikk = 1 and tikj = 0 ∀ j ≠ k). Single effects for each teacher,
, are estimated by applying weighted least squares (WLS) to Equation (Equation4
(4)
(4) ), with the weights equal to the dosages wik as defined above. In the example above, interaction variables are not created for the students whom Teachers A and B shared. Instead, those student records would be duplicated in the regression—once for each teacher. One observation would have an entry of zero in the column for one teacher and an entry of one for the other. In the next row, the zero and one would be reversed. Each duplicated observation would receive a weight of 0.5. Given this duplication of records, the errors in Equation (Equation4
(4)
(4) ), denoted by ζik, are clustered at the student level, which implies that the estimated effects for teachers who share students will be statistically correlated.
The Full Roster Method is similar to the Teacher Team Method in that the estimation of each teacher effect does not depend mechanically on data from any other teacher with whom students might be shared, given how the student-level data are blocked. This modeling strategy avoids the possibility that an outlier estimate for one teacher skews the estimate of another teacher. In fact, as shown in the next section, the Full Roster Method produces point estimates that are, under certain circumstances, identical to estimates from the fully interacted Teacher Team Method. Thus, the Full Roster Method also embodies the notion that teachers are jointly responsibly for the achievement of their shared students. Unlike the Teacher Team Method, there is not a straightforward modification of the Full Roster Method that would allow for a hybrid model that incorporates Partial Credit for subgroups of teachers.
2.4. Numerical Comparison of Estimates from the Teacher Team and Full Roster Methods
The teacher regression coefficients obtained using the Full Roster Method () and the overall effectiveness estimates based on the Teacher Team Method (
) are identical under certain conditions. As demonstrated in the appendix,
if (1) the Teacher Team Method is implemented using fully interacted teams, and (2) student covariates are not included in the model. Thus, in the example above, the Full Roster Method would produce a regression coefficient for Teacher A that is precisely equal to 15/20 × [Teacher-A-alone estimate] + 5/20 × [Team AB estimate].
However, the two sets of estimates will generally differ if (1) aggregated teams are specified or (2) covariates are included in the regression. If aggregated teams are specified, the differences occur due to weighting. The Full Roster Method always implicitly weights multiple estimates as if they were produced from a series of fully interacted teams, but the Teacher Team Method would in this case explicitly weight the effects of a smaller number of aggregated teams. When covariates are included, the estimated coefficients of the covariates differ across the two methods. This occurs because the two regression equations include different sets of intercepts. These differences in covariate coefficients, in turn, result in different estimates of teacher effects. See the appendix for details.
3. Implementation of Methods
In practice, one must make a series of decisions to implement any value-added method to account for co-teaching. In this section, we first review the roster confirmation procedure that was used by the school district, an important precursor to understanding our implementation decisions. We then explain the decisions we made for each method.
Unlike the data available in many longitudinal administrative databases, information on teacher–student links in the school district was based on a roster confirmation process covering each instructional term. For each of three school terms, teachers were asked (1) to identify whether or not they instructed each student listed on their administrative roster in math and/or English/language arts; and (2) if so, for what fraction of total class instructional time in that subject (rounding to the nearest quarter). A student who was enrolled for all three terms in a teacher's class for the full amount of instructional time devoted to that subject received a dosage of one.Footnote9 Intermediate values were mainly intended for (Equation1(1)
(1) ) students in pullout programs who spent, for example, 2 days a week with a special education teacher (who was not eligible for a value-added estimate) and (Equation2
(2)
(2) ) students who joined a teacher's class midway through the term. Teachers also had the opportunity to add students who were not on their roster. In addition to the roster confirmation data, we made use of school enrollment data to measure the percentage of each term that students spent in each school. The product of the percentage of time spent in the school and the percentage of time spent with a given teacher within a school determined the fractional dosage attributed to each teacher. In cases in which the total percentage of instructional time added up to more than 100%, we rescaled the dosages so that they summed to one. For students who were claimed by one teacher for part of a term and not claimed for the remainder of the time by another teacher in the same subject, we attributed the student's remaining dosage to a catchall “unspecified teacher” for each grade level. That is, for each grade we estimated an extra teacher variable in addition to the variables representing teachers and teacher teams.Footnote10
3.1. Implementation of the Teacher Team Method
Implementing the Teacher Team Method involves making the follow five key decisions:
| • | Setting the minimum number of students needed for an individual teacher and a teacher team to be included in the value-added model. | ||||
| • | Determining other criteria necessary for forming a team. | ||||
| • | Deciding how to account for students in teams that do not have a sufficient total number of students to receive an estimate. | ||||
| • | Establishing the granularity of teams, that is, whether to define fully interacted teams or aggregated teams. | ||||
| • | Setting the relative weights on multiple estimates for teachers who taught students individually and as part of a team. | ||||
3.1.1. Minimum Student Counts
For the first decision, we chose seven as the minimum number of students for both individual and team estimates. In preliminary work in which we analyzed a variety of approaches, it became apparent that these two thresholds needed to be identical. Otherwise, the number of special cases in the formation of individual and team variables could become unmanageable. In deciding on a threshold value, we had to balance competing objectives. On one hand, we aimed to incorporate the greatest amount of information in the value-added model, including as many valid teacher–student links as possible. On the other hand, we were attentive to the practical concern of data errors in the roster confirmation process: a math teacher mistakenly claiming a few students in English/language arts could appear in the data as an English/language arts teacher, and vice versa. A minimum threshold helps to eradicate potentially errant teacher–student links. In balancing these objectives, we decided to create variables only if teachers or teams could be linked to at least seven students.Footnote11
3.1.2. Other Criteria for Forming Teams
We limited teams to teachers who shared students within the same school. For students shared by teachers across schools (4% of students), we assigned a fractional dosage to the teacher in each school. In other words, we used a hybrid of the Teacher Team Method and Partial Credit Method: within the same value-added model, we employed the Teacher Team Method within schools and the Partial Credit Method across schools. We foresaw little risk of unstable estimates for teachers in different schools, since it would be very unlikely that they shared many students.
Another decision we made was to form teams not only between teachers participating in the roster confirmation process, but also between those teachers and the catchall “unspecified teacher” when there were at least seven students in common. An alternative strategy would have been to create another hybrid between the Teacher Team Method and Partial Credit Method by allowing students to have fractional dosage with their main teacher and fractional dosage with the unspecified teacher. When we modeled the sharing of students in this way, we found that some of the teachers' value-added estimates diverged sharply from the average covariate-adjusted gain score of their students.Footnote12 This discrepancy occurred because estimated effects for the unspecified teacher were negative at all grade levels in both subjects, often substantially so. As a result, estimates for teachers who shared students with an unspecified teacher tended to be higher than the covariate-adjusted gain scores would indicate. To eliminate this “windfall” to teachers with many pullout students, we formed teams when seven or more students were shared, which brought the value-added estimates closer to the average covariate-adjusted gain score. However, this approach did not eliminate the possibility of a benefit to teachers sharing fewer than seven students with an unspecified teacher.
3.1.3. Teams with Few Students
We also used a hybrid between the Teacher Team Method and the Partial Credit Method for cases in which students were taught by multiple teachers who had fewer than seven students in common. For two-person teams, these students were distributed back to the individual teachers (splitting the dosage evenly between them), assuming that they had at least seven solo-taught students. For “broken teams” composed of three or more members, we devised a series of rules to distribute these students among two-person teams or individual teachers.Footnote13 In implementing these rules, we manually checked the teaming arrangements to ensure that the students were distributed as intended because it was not possible to program the full set of rules to cover all possible cases. In some cases, teachers received estimates that were informed by some, but not all, of their students. For example, if a two-person team formed because there were seven or more shared students, but an individual estimate for one of the teachers in the team did not form because there were not at least seven solo-taught students, these students were delinked from the teacher and allocated to the unspecified teacher.Footnote14 This is one example of how in practice the Teacher Team Method can result in a loss of information for individual teachers.
3.1.4. Granularity of Teams
To avoid dropping students, we opted to use aggregated teams, rather than fully interacted teams. An attempt to create multiple teams among the same set of teachers based on different relative student dosage weights would have resulted in more teams with fewer than seven students. These teams would “break,” resulting in additional students becoming delinked from their teachers.
3.1.5. Relative Weights
The final decision that policymakers and developers need to consider is how to model dosage for students who are linked to more than one teacher. In this article, we subdivide the dosage proportionally so that each individual student contributes a total dosage weight of 100% to the value-added model. Alternatively, one could let individual students contribute more than 100%. For example, if two teachers claim a student for the full year, each would be allowed to retain a 100% dosage for both students.Footnote15
3.2. Implementation of the Full Roster Method
The Full Roster Method requires only two implementation decisions: (1) establishing the minimum number of students for an individual teacher to be included in the value-added model; and (2) establishing a rule for handling relative weights when a student is taught by multiple teachers. For the purpose of comparing results generated from the Full Roster Method with those generated from the Teacher Team Method, we set this minimum threshold to seven students, the same number used for the Teacher Team Method. Similarly, we adopted the same rule for relative weights: we subdivide the dosage proportionally so that each individual student contributes a total dosage weight of 100%.
4. Value-Added Estimation
Estimates of teacher value added were based on one year of teacher–student links data covering grades 4 through 8 in the school district. Student post-tests were based on end-of-year results from the state-wide assessment test, and pre-test data were based on their results at the end of the prior school year. We converted the test scores to z-scores by subtracting the mean test score for that grade-subject-year combination, and dividing by the standard deviation of the test for that grade-subject-year. This step allowed us to translate math and reading test scores in every grade and subject into a common metric.Footnote16 We then multiplied the z-scores by a constant (the average standard deviation across all grades within each subject-year combination) so that the units appeared more similar to that of the original test score.
Initial value-added estimates were calculated using regressions like Equation (Equation2(2)
(2) ) for the Teacher Team Method and Equation (Equation4
(4)
(4) ) for the Full Roster Method. All regressions included teacher variables and team variables (if applicable), as well as the following student characteristics available from the school district's administrative database: pre-tests in both subjects, gender, free lunch eligibility, reduced-price lunch eligibility, limited English proficiency status, having a specific learning disability, having other types of disabilities requiring special education, and the proportion of days that the student attended school during the prior year.
We used a two-step process to estimate the results. In the first step, we estimated a grade-specific value-added regression of post-test scores on student background characteristics (including pre-tests) and indicators for teachers and (in the Teacher Team Model) teams. In this step, we applied an errors-in-variables technique to the pre-tests using grade-specific test/retest reliability information obtained from the test publisher's technical manual.Footnote17 We then calculated a pre-test-adjusted test score by netting out the estimated contribution of pre-tests from the post-test. In the second step, the pre-test-adjusted test score was used as the dependent variable in a value-added regression that pooled data from all grades, the preference of the district with which we worked. By pooling across grades, the coefficients on the student characteristics borrow strength from each other for more precise coefficient estimates than would occur were the model estimated for each grade separately. However, we estimate teacher effects separately for each grade. For example, if a teacher has both 7th- and 8th-grade students (and no team-taught students), this teacher would contribute two variables to the model, one for each grade. To account for heteroscedasticity when applying the Teacher Team Method, we calculated robust standard in the second step errors using the Huber–White sandwich estimator. (The second step was necessary due to computational limitations in the errors-in-variables technique that does not allow for measurement error control and robust standard errors simultaneously.) To additionally account for student-level clustering arising from the replication of student observations when applying the Full Roster Method, we used the cluster-robust generalization of the Huber–White technique (Liang and Zeger Citation1986; Arellano Citation1987). The coefficient estimates on the teacher and team variables from the second-stage regression composed our initial value-added estimates.
We calculated final value-added estimates by applying the following process to the initial regression estimates obtained from both the Teacher Team Method and the Full Roster Method:
| 1. | We adjusted the coefficient estimates and standard errors so that the mean and standard deviation of effects in each grade were identical. Because the teacher effects for different grade levels are stated in terms of different units—fourth-grade test scores, fifth-grade test scores, and so forth—it is impossible to distinguish true variability in teacher performance across grade levels from apparent variability that arises through psychometric properties of the tests (even after standardizing all tests to have a standard deviation of one). Therefore, in accordance with the wishes of the school district, we rescaled the estimated distribution of teachers at all grade levels to be similar. | ||||
| 2. | For teachers with both solo-taught and co-taught students, we combined multiple grade-specific estimates by taking a dosage-weighted average within the grade, as explained in Section 2. (This step was only needed when applying the Teacher Team Method.) | ||||
| 3. | For teachers with students in more than one grade, estimates were combined using a dosage-weighted average across grades. | ||||
| 4. | We applied an empirical Bayes shrinkage procedure based on Morris (Citation1983) to offset the possibility that teachers with few students (or students whose post-test scores were hard to predict based on their characteristics) would be distributed in the tails of the distribution due to chance. | ||||
| 5. | To reduce the prevalence of imprecise estimates, we reported estimates only for teachers who taught at least 15 students, a threshold determined in consultation with the school district, which chose to avoid incorporating the least precise value-added estimates (as proxied by number of students taught) into its multiple-measures evaluation system.Footnote18 | ||||
5. Empirical Comparison
A major difference between the methods we examined was that the Teacher Team Method maintained fewer links between teachers and their students due to the limitations of the team-forming rules. When considering teachers who met the 15-student threshold (before any reallocation to the unspecified teacher), the Full Roster Method resulted in 5.3% of math teachers and 3.8% of English/language arts teachers being matched to additional students. Among these teachers, the average increase was 4.5 students in math and 3.9 students in English/language arts. In addition, of the teachers with 15 or more students one more teacher received an estimate based on the Full Roster Method. This occurred because, in the Teacher Team Model, the teacher's students were shared with other teachers in teams of fewer than seven students each, which caused the students to be reallocated to the unspecified teacher.
The increase in the number of teacher–student links naturally resulted in differences in the value-added estimates produced by the two methods. To better evaluate differences based solely on the methodology, we made two adjustments. First, we reestimated the value-added model using the Full Roster Method with the teacher–student links limited to those that would have been maintained using the Teacher Team Method. Second, we restandardized the post-shrinkage estimates obtained from the two methods to a mean of zero and a standard deviation of one among the teachers who met the reporting threshold and received estimates based on both methods. Because the district intended to convert standardized estimates to another scale to be incorporated into a multiple-measures evaluation system, it is appropriate to compare standardized estimates to one another. In other words, any differences in the standard deviation of teacher value added across the two methods would be removed once the estimates were incorporated into the multiple-measures evaluation system.
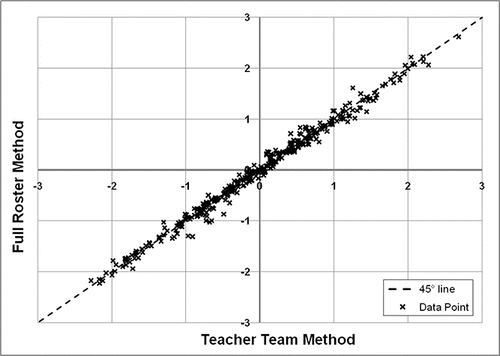
The two methods produced value-added estimates that are very similar for both math and reading. and showa scatterplot of value-added estimates, comparing the Teacher Team Method (on the horizontal axis) to the Full Roster Method (on the vertical axis). Both figures display a tight fit, with most observations concentrated near the 45° line. The correlations between the two sets of estimates are 0.995 in math and 0.994 in reading. However, some observations are noticeably away from the diagonal.
Figure 1. Scatterplot of standardized value-added estimates for teachers of math. Source: Authors' calculations based on district administrative data.
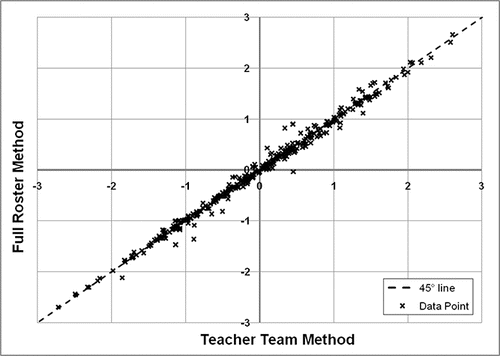
Figure 2. Scatterplot of standardized value-added estimates for teachers of English/language arts. Source: Authors' calculations based on district administrative data.
Based on the discussion in Section II, one of the sources of differences between the two sets of estimates could be a difference in the estimated coefficients on student-level covariates. As shown in , there are small differences in the estimates of covariates between the two methods. In some cases, the Full Roster Method-based estimates are slightly larger, while in others the Teacher Team Method-based estimates are larger.
Table 1. Coefficients on student-level covariates for teacher team method and full roster method, by subject.
To explore the possibility that these small differences in coefficients on student-level covariates might have substantially affected teachers' value-added estimates, we ran the following regression for each subject:
(5)
(5) where DVAk is the difference between the teacher k's value-added estimate on the Teacher Team Method and the value-added estimate based on the Full Roster Method. The vector
denotes dosage-weighted averages of the student covariates included in the value-added regression. Although a few of the estimated coefficients were significant, there did not appear to be a systematic relationship between student characteristics and the sign of the difference in value added obtained from the two methods. In particular, in reading, teachers who had more students with a specific learning disability fared better under the Full Roster Method, while teachers with more students with other disabilities fared better under the Teacher Team Method. In Math, however, we did not find this pattern, but did see that teachers who shared more students with another teacher included in the value-added model fared better under the Full Roster Method. These were the only results that were statistically significant using a p-value of 0.05, and, given the large number of comparisons we were making, could have been produced by chance. When we repeated this analysis but tested whether the absolute value of the difference in estimates was related to student characteristics, we did not find any consistent relationships across subjects, but we did see that estimates tended to diverge more when teachers shared more students with either another teacher in the model or with the unspecified teacher. This is not surprising, as the way in which we handled student sharing was the main difference between the two approaches.
6. Conclusion
We have shown that the two methods of modeling co-teaching, which we call the Teacher Team Method and the Full Roster Method, are theoretically related and empirically similar. Both models implicitly assume that teachers have an effect on student achievement when they teach as a team that is distinct from the effect they have when teaching students individually. From a policy perspective, this implies that co-teachers are held jointly responsible for the outcomes of the shared students. By contrast, a third method, the Partial Credit Method, assumes that teachers have distinct and separable effects on student outcomes and is premised on the idea of individual responsibility. Because it is not empirically tenable to fully implement the Partial Credit Method when teachers have many or all of their students in common, districts must decide whether joint responsibility is acceptable. The alternative, however, is not a value-added model that assumes individual responsibility, but rather is not providing value-added estimates to these teachers.
One advantage of the Teacher Team Method over the Full Roster Method is that it is more adaptable. Specifically, it allows for a hybrid approach in which the Partial Credit Method is used to model individual responsibility in some cases. In our implementation, we applied this hybrid approach to use the Partial Credit Method within the Teacher Team Method to model student sharing among teachers at different schools and those with fewer than seven students in common. In principle, it is possible to expand the extent to which Partial Credit is used within the Teacher Team Method, but this increases the likelihood of statistically unreliable estimates arising from collinearity.
The Full Roster Method has two key advantages for a policymaker who prefers, or is at least comfortable with, the assumption of joint responsibility. First, it allows for a greater number of students to contribute directly to the calculation of a value-added score for a teacher because it does not rely on a complex mechanism for forming team variables, as the Teacher Team Method does. Increasing the sample size for a given teacher will, in turn, increase the accuracy and precision of the value-added estimate. It also adds to the face validity of value-added methods among teachers to know that all of the students they claim during a roster confirmation process directly contribute to their performance score.
The second advantage of the Full Roster Method is that it relies on a simpler, more transparent set of rules, which may make it better suited to high-stakes applications. The team variables used in the Teacher Team Method are formed based on counts of students claimed by each combination of teachers. It is not possible to pre-specify an algorithm that covers every possible scenario of “broken” teams—that is, combinations of teachers sharing fewer students than the minimum number needed to reliably estimate a team effect. Consequently, it may be necessary to adapt the algorithm on the fly to account for special cases. The Full Roster Method relies on a much simpler set of rules that avoids the concern about special cases. As such, this method may be preferable for policymakers who wish to provide a clearer a priori explanation of which students contribute to a teacher's value-added score and how they do so.
Based on our data from a large urban school district, the two methods produced very similar estimates of teacher value added. Given the high correlation in the results, both the Full Roster Method and the Teacher Team Method appear to provide nearly equivalent estimates of teacher value added under the assumption of joint responsibility. Consequently, we recommend implementing the Full Roster Method, based on its computational simplicity.
Supplementary Materials
The supplemental file derives and compares algebraic expressions for value-added estimates from the Teacher Team Method and the Full Roster Method for three modeling scenarios. The first is a base case that includes no student covariates and specifies fully interacted teacher teams; in this case the two methods are numerically equivalent. The next two scenarios show how the estimates from the two methods differ if (1) aggregated teacher teams are specified or (2) student covariates are included in the regression.
USPP_1265473_Supplemental_File.zip
Download Zip (121.2 KB)Additional information
Funding
Notes
3 We found nine technical reports on VAMs that are used for teacher evaluation. They describe the VAMs that have been used in Baltimore (American Institutes for Research Citation2014); Charleston (Resch and Deutsch Citation2015); District of Columbia Public Schools (Isenberg and Walsh Citation2014); Florida (American Institutes for Research Citation2013); Hillsborough County, Florida (Value-Added Research Center Citation2014); Louisiana (Louisiana's Value-Added Assessment Model Citation2013); New York City (Value-Added Research Center Citation2010); Oklahoma (Walsh, Liu, and Dotter Citation2015); and Pittsburgh (Rotz, Johnson, and Gill Citation2014). Of this group, Baltimore, Florida, and Louisiana use random effects and the rest used fixed effects. As noted, some states and districts have used the SAS EVAAS model or the student growth percentile model to measure teacher effectiveness. Both models can be estimated without requiring any adaptations to account for co-teaching. However, these models do not guard against bias that may arise from systematic sorting of students to teachers.
4 The partial credit method may be practical when using random effects models to assess teacher value added (McCaffrey et al. Citation2004). In addition, the SAS EVAAS model, a mixed model, uses the partial credit method (SAS Institute Citation2015). However, for reasons already discussed, here we focus on modeling teacher fixed effects.
5 The data used by Han et al. (Citation2012) had not been fully roster-confirmed, and involved no cases of simultaneous co-teaching. Based on research documenting the extent of co-teaching in different contexts, this outcome seems unlikely with roster-confirmed data (Kluender et al. Citation2011; Battelle for Kids Citation2013; Bel Hadj Amor et al. Citation2013; Isenberg et al. Citation2015).
6 Students become delinked from teachers who share just a few students with another teacher because it becomes impractical to form every possible team. In practice, fixed effects estimates for teachers linked to a small number of students can be unstable and have large standard errors.
7 Dosage can be based on the proportion of the year the student spent in a teacher's school or the amount of instructional time the student spent with a teacher at the school. In practice, as explained in Section 3, we leveraged information of both types, combining school enrollment data with roster confirmation data.
8 Other assignments of dosage are possible. For example, one could assign both teachers in this situation a dosage of 1.0. Throughout this article, we assume that student dosage is assigned to teachers such that each student has a total dosage of one.
9 The roster confirmation process did not collect information on the total time spent teaching math and English/language arts. For example, if a teacher at one school spent 50 min per day teaching math, full-time students in that teacher's class would receive a dosage of one. If a teacher at another school spent 60 min per day teaching math, full-time students in that teacher's class would also receive a dosage of one. The district did not collect data on the number of minutes per day devoted to teaching math and English/language arts. Therefore, the dosage information does not account for any differences across teachers in this regard. Fractional dosage reflects differences within a teacher in the instructional time spent with students.
10 In the Teacher Team Method, it is necessary to account for all student dosage, and therefore to create variables for the unspecified teacher. In the Full Roster Method, the use of an unspecified teacher to account for “missing” dosage is optional. In the comparisons we made, we included the unspecified teacher variables in the Full Roster Method so that the two methods would be as comparable as possible.
11 There are actually two thresholds of interest. We chose seven teacher–student links as the threshold number for us to create an individual teacher or team variable to estimate. However, we were not bound to report every estimate and the school district did not need to include them all in the teacher evaluation system. The school district sought to avoid making decisions based on value-added estimates that it considered too imprecise to be meaningful. So it chose 15 students as a minimum number of teacher–student links for a teacher's estimate to be included in the teacher evaluation system. As a result, there were some teachers for whom we estimated value added but did report this estimate to the school district.
12 The average covariate-adjusted gain for a teacher is calculated by (1) estimating a value-added regression; (2) calculating each student's adjusted gain as the difference between the actual post-test and the post-test that is predicted from the student's pre-test and background characteristics (but not teacher and team variables); and (3) taking a dosage-weighted average of the adjusted gains of the teacher's students.
13 Broken teams with more than two teachers are a more complex case than broken teams with just two teachers because there are four possible ways to distribute student dosage: (1) to a team consisting of teachers A and B as well as to individual teacher C; (2) to a team of A and C plus individual teacher B; (3) to a team of B and C plus individual teacher A; or (4) to teachers A, B, and C as individuals. Thus, we devised a series of rules.
14 Chiang and Chaplin (Citation2010) developed a method for addressing co-teaching in a network of public charter schools using an algorithm that determines when to create teacher teams. Their method forms teams only for teachers who have sole responsibility for fewer than 10 students, while our method creates every possible team, as long as the teachers share at least seven students.
15 Isenberg and Walsh (Citation2015) discussed the trade-offs associated with these choices and explored variants of the Full Roster Method that handle student weighting in alternate ways. Because there is very little difference in the value-added estimates when alternate student weighting is used, this suggests that the comparison of the Teacher Team Results and Full Roster Method results would not change under an alternate weighting method.
16 Converting test scores to z-scores is a common translation of test score data in value-added models developed for school districts (Value-Added Research Center Citation2010, Rotz et al. Citation2014, Walsh, Liu, and Dotter Citation2015). We have applied this translation to both models for consistency, which allows us to compare the differences between the models based solely on how we model co-teaching.
17 We use a single test/retest reliability measure for each test. An alternative approach would be to use a heteroscedastic errors-in-variables (HEIV) estimator that accounts for varying levels of measurement error for different observations (Sullivan Citation2001). Our approach addresses the potential problems of bias and inconsistency that would occur if there were no adjustment but produces less precise estimates than implementing HEIV. However, implementing HEIV would require incorporating information on measurement error for every possible test score, while the gains of such an approach would be small, given that the coefficient on pre-test scores are estimated very precisely using the method we follow. For these reasons, HEIV is to our knowledge never implemented in value-added models developed for school districts.
18 Following the school district's decision, we reported estimates only for teachers who taught at least 15 students. Setting a minimum threshold for reporting value-added estimates used for teacher evaluation is a common practice. For example, some other states or districts have used a 10-student minimum (Value-Added Research Center Citation2010; Rotz et al. Citation2014; Walsh, Liu, and Dotter Citation2015).
Related Research Data
References
- American Institutes for Research (2013), Florida Comprehensive Assessment Test (FCAT) 2.0 Value-Added Model: Technical Report 2012–13, Washington, DC: American Institutes for Research.
- ——— (2014), Baltimore City Public Schools Value-Added Model Technical Report, Washington, DC: American Institutes for Research.
- Arellano, M. (1987), “Computing Robust Standard Errors for Within-Groups Estimators,” Oxford Bulletin of Economics and Statistics, 49, 431–434.
- Bacher-Hicks, A., Kane, T., and Staiger, D. (2014), “Validating Teacher Effect Estimates Using Changes in Teacher Assignments in Los Angeles,” NBER Working Paper 20657, Cambridge, MA: National Bureau of Economic Research.
- Battelle for Kids (2013), Roster Verification, Columbus, OH: Battelle for Kids.
- Bel Hadj Amor, H., Tucker, N., and Özek, U. (2013), “Determining Attribution: Holding Teachers Accountable for Student Growth,” Working Paper, Washington, DC: American Institutes for Research.
- Betebenner, D. W. (2007), Estimation of Student Growth Percentiles for the Colorado Student Assessment Program, Dover, NH: National Center for the Improvement of Educational Assessment.
- Chetty, R., Friedman, J., and Rockoff, J. (2014), “Measuring the Impacts of Teachers I: Evaluating Bias in Teacher Value-Added Estimates,” American Economic Review, 104, 2593–2632.
- Chiang, H., and Chaplin, D. (2010), Recommended Design of Value-Added Measures for Achievement First, Washington, DC: Mathematica Policy Research.
- District of Columbia Public Schools (2011), “The District of Columbia Public Schools Effectiveness Assessment System for School-Based Personnel 2011–2012: Group 1—General Education Teachers With Individual Value-Added Student Achievement Data,” Washington, DC: District of Columbia Public Schools. Available at http://www.nctq.org/docs/IMPACT.pdf
- Duffrin, E. (2011), “What's the Value in Value-Added?” District Administration, 47, 48–52. Available at http://www.districtadministration.com/article/whats-value-value-added
- Ehlert, M., Koedel, C., Parsons, E., and Podgursky, M. J. (2013), “The Sensitivity of Value-Added Estimates to Specification Adjustments: Evidence from School- and Teacher-Level Models in Missouri,” Statistics and Public Policy, 1, 19–27.
- Gnagey, J. (2013), “An Analysis of Different Methods for Incorporating Co-Teachers into Value- Added Models,” Working Paper, Ohio State University. Unpublished manuscript.
- Goldhaber, D., Walch, J., and Gabele, B. (2013), “Does the Model Matter? Exploring the Relationship between Student Achievement-Based Teacher Assessments,” Statistics and Public Policy, 1, 28–39.
- Guarino, C. M., Reckase, M. D., and Wooldridge, J. M. (2015a), “Can Value-Added Measures of Teacher Education Performance Be Trusted?” Education Finance and Policy, 10, 117–156.
- Guarino, C. M., Reckase, M. D., Stacy, B. W., and Wooldridge, J. M. (2015b), “A Comparison of Growth Percentile and Value-Added Models of Teacher Performance,” Statistics and Public Policy, 2, 1–11.
- Han, B., McCaffrey, D., Springer, M. G., and Gottfried, M. (2012), “Teacher Effect Estimates and Decision Rules for Establishing Student-Teacher Linkages: What are the Implications for High-Stakes Personnel Policies in an Urban School District?” Statistics, Politics, and Policy, 3. DOI: 10.1515/2151-7509.1035. Available at https://www.degruyter.com/view/j/spp.
- Hansen, M., Backes, B., Brady, V., and Xu, Z. (2014), “Examining Spillover Effects from Teach for America Corps Members in Miami-Dade County Public Schools,” Working Paper 113, National Center for Analysis of Data in Educational Research.
- Hock, H., and Isenberg, E. (2012), Methods for Accounting for Co-Teaching in Value-Added Models, Washington, DC: Mathematica Policy Research. Working Paper 6.
- Isenberg, E., and Walsh, E. (2014), Measuring Teacher Value Added in DC, 2013–2014 School Year. Final report submitted to the Office of the State Superintendent of Education for the District of Columbia and the District of Columbia Public Schools, Washington, DC: Mathematica Policy Research.
- ——– (2015), “Accounting for Co-Teaching: A Guide for Policymakers and Developers of Value-Added Models,” Journal of Research on Educational Effectiveness, 8, 112–119.
- Isenberg, E., Teh, B., and Walsh, E. (2015), “Elementary School Data Issues for Value-Added Models: Implications for Research,” Journal of Research on Educational Effectiveness, 8, 120–129.
- Kluender, R., Thorn, C., and Watson, J. (2011), Why Are Student-Teacher Linkages Important? An Introduction to Data Quality Concerns and Solutions in the Context of Classroom-Level Performance Measures, Madison, WI: Center for Educator Compensation Reform.
- Liang, K.-Y., and Zeger, S. L. (1986), “Longitudinal Data Analysis Using Generalized Linear Models,” Biometrika, 73, 13–22.
- Louisiana's Value-Added Assessment Model as Specified in Act 54 (2013), “A Report to the Board of Elementary and Secondary Education, September 2013,” available at https://www.louisian-abelieves.com/docs/teaching/2012-2013-value-added-report.pdf?sfvrsn=8
- McCaffrey, D. F., Han, B., and Lockwood, J. R. (2009), “Turning Student Test Scores into Teacher Compensation Systems,” in Performance Incentives: Their Growing Impact on American K-12 Education, ed. Springer, M., ed., Washington, DC: Brookings Institution Press, pp. 113–147.
- McCaffrey, D. F., Lockwood, J. R., Koretz, D., Louis, T. A., and Hamilton, L. (2004), “Models for Value-Added Modeling of Teacher Effects,” Journal of Educational and Behavioral Statistics, 29, 67–101.
- Morris, C. N. (1983), “Parametric Empirical Bayes Inference: Theory and Applications,” Journal of the American Statistical Association, 78, 47–55.
- Resch, A., and Deutsch, J. (2015), Measuring School and Teacher Value Added in Charleston County School District, 2014–2015 School Year. Final Report Submitted to the Charleston County School District, Washington, DC: Mathematica Policy Research.
- Rothstein, J. (2015), Revisiting the Impacts of Teachers, Berkeley, CA: University of California, Berkeley.
- Rotz, D., Johnson, M., and Gill, B. (2014), Value-Added Models for the Pittsburgh Public Schools, 2012–13 School Year, Cambridge, MA: Mathematica Policy Research.
- SAS Institute (2015), “SAS EVAAS for K-12 Statistical Models,” White Paper, Cary, NC: SAS Institute. Available at https://www.sas.com/content/dam/SAS/en_us/doc/whitepaper1/sas-evaas-k12-statistical-models-107411.pdf
- Steele, J. L., Baird, M., Engberg, J., and Hunter, G. (2014), “Trends in the Distribution of Teacher Effectiveness in the Intensive Partnerships for Effective Teaching,” RAND Working Paper WR-1036-BMGF, Pittsburgh, PA: RAND Corporation.
- Sullivan, D. (2001), “A Note on the Estimation of Linear Regression Models with Heteroskedastic Measurement Errors,” Working Paper No. 2001–23, Chicago, IL: Federal Reserve Bank of Chicago.
- Value-Added Research Center (2010), NYC Teacher Data Initiative: Technical Report on the NYC Value-Added Model 2010, Madison, WI: Value-Added Research Center at Wisconsin Center for Education Research, University of Wisconsin-Madison.
- ——— (2014), Hillsborough County Public Schools Value-Added Project: Year 3 Technical Report HCPS Value-Added Models 2013, Madison, WI: Value-Added Research Center at Wisconsin Center for Education Research, University of Wisconsin-Madison.
- Walsh, E., and Isenberg, E. (2015), “How Does Value Added Compare to Student Growth Percentiles?” Statistics and Public Policy, 2, 1–13.
- Walsh, E., Liu, A. Y., and Dotter, D. (2015), Measuring Teacher and School Value Added in Oklahoma, 2013–2014 School Year. Final Report Submitted to the Office of Educator Effectiveness at the Oklahoma State Department of Education, Washington, DC: Mathematica Policy Research.