
 ?Mathematical formulae have been encoded as MathML and are displayed in this HTML version using MathJax in order to improve their display. Uncheck the box to turn MathJax off. This feature requires Javascript. Click on a formula to zoom.
ABSTRACT
Recently, voter ID laws have been instituted, modified, or overturned in many states in the U.S. As these laws change, it is important to have accurate measures of their impact. We present the data collection methods and results of class projects that attempted to quantify the impact of the voter ID laws in areas of three states. We also summarize the types of data used to assess the impact of voter ID laws and discuss how our data address some of the shortcomings of the usual techniques for assessing the impact of voter ID laws.
1. Introduction
When it became clear during the early days of the civil rights movement that progress depended on ensuring that citizens have the ability to vote without restrictive procedures or harassment, the Voting Rights Act of 1965 was passed. It provided federal guidelines to protect voting rights. After the 2000 election, however, states began to enact laws regulating how voters prove their identity to vote in general elections. These laws included restricting the form of ID required (e.g., requiring state-issued and/or photo ID), when it must be presented (e.g., every election or only for first time voters), and how would-be voters without the required ID would be handled at polling places (e.g., use of provisional ballots). By 2013, 33 states had such laws on the books, including Texas (passed in 2011), Pennsylvania (2012), and Virginia (2013) (U.S. Government Accountability Office, (GAO), Citation2014).
In 2013, the Supreme Court declared in Shelby County v. Holder (Citation2013) that provisions of the Voting Rights Act that identified the jurisdictions requiring prior approval were no longer constitutional. Several states immediately enacted new procedures requiring stricter forms of voter ID and limiting hours and voting locations. These laws have been challenged in the courts based on violation of the remaining portions of the Voting Rights Act.
Besides objections on legal grounds, others have raised concerns that voter ID laws create burdens that could prevent any eligible voter from successfully casting a ballot. The theoretical underpinnings for such concerns are based on the idea that voters are rational actors who assess the costs and benefits of voting (Riker and Ordeshook Citation1968). Any increase in cost, whether in the form of increased time or money, would decrease turnout if the voter does not perceive an increased benefit.
For a voter ID law to have an impact, it must cause a change in the propensity to vote for all individuals, or for one group more than another. Voting behavior is observable, so at least the outcome is a manifest variable. However, proving that the voter ID law causes an observed outcome is difficult since elections are not conducted as experiments. It is impossible to observe the outcome of voting behavior for a single individual both under the condition (voter ID law in place) and its counterfactual (no voter ID law in place). Thus, there are challenges in obtaining data to assess impact.
This article describes data collection and analyses carried out as class projects. The collective effort adds to the evidence about the impact of the voter ID laws in three states: Texas, Pennsylvania, and Virginia. The specific voter ID law varied among the three sites. The Texas voter ID law in effect in 2014 was one of the most restrictive in the country. Texas's law accepted only seven types of government issued photo ID, such as driver, military, and concealed carry licenses. If the potential voter could not present such an ID at the polling place, they could complete a provisional ballot, which would count only if the voter presented a qualifying ID within 6 days at a designated location. The 2012 Pennsylvania voter ID law, which required a photo ID for in-person voting, was struck down in January of 2014 (Applewhite v. Commonwealth, 330 M.D. 2012; 2014 Pa. Commw. LEXIS 62). Thus, for the 2014 election, only first-time voters in a district and those denoted in the polling book had to show ID and it did not need to be a photo ID. The Virginia voter ID law allowed a wider range of ID, including some nongovernment issued ID types. These include an employment or student photo ID.
Our work was motivated by a small study done by American University students in Northern Virginia during the off-year 2013 statewide election. That study estimated that 2% of potential voters were turned away from the polls because they lacked the ID required by the State of Virginia. Because of students’ interest in the issue, one of the authors (MG) decided to expand the study for the 2014 mid-term election. She placed an article in Amstat News (Gray Citation2014) asking for participation by other faculty. The two other authors of this article responded and the project was born.
In Section 2, we describe the types of data that are typically used to measure the impact of voter ID laws, and in Section 3, we present the findings of previous studies, emphasizing the specific parameters estimated. We discuss the goals of our study and how the framework of our study compares to other extant studies in Section 4. Sections 5 and 6 contain the methods and results of our study. Finally, in Section 7, we compare our results to those of existing studies and draw conclusions on the impact of voter ID laws.
2. Data for Measuring the Impact of Voter ID Laws
What data would allow identification of any impact of voter ID laws on turnout, or of disparate impact on any demographic subgroup? Studies that assess the impact typically use data of one of three types: ID ownership files with voter registration lists, aggregated longitudinal data on registration and turnout, and retrospective survey data from a sample of would-be and/or actual voters. Assessing impact from any of these sources has limitations.
First consider ID ownership data. Many studies have matched administrative ID and voter registration files to estimate the proportion of registered voters lacking an ID. However, ID ownership, or lack thereof, does not necessarily change a person's propensity to vote. Studies have shown that those without an ID share demographic characteristics with low propensity voters even in states without voter ID laws (Barreto, Nuno, and Sanchez Citation2009). Thus, some claim that lack of ID does not change voter behavior (Zengerle Citation2012). Conversely, the propensity to vote can be affected even if the registered voter does own a qualifying ID. Voter ID laws are complex and ever changing, so that a voter can be confused about requirements, and fail to vote due to the perception, rather than the fact, that he does not own a qualifying ID (Hobby et al. Citation2015). Therefore, if the goal is to assess whether the law actually, rather than potentially, affects voting behavior, ID nonownership is an imperfect proxy. ID ownership data are used mostly in support of legal proceedings for challenges to voter ID laws, often prior to an election (e.g., Ansolabehere Citation2012; Barreto and Sanchez Citation2012). In these cases only potential impact is relevant, since no actual voter behavior resulting from the law has occurred. Even if potential impact is of interest, these studies are subject to errors (e.g., matching errors, Marker Citation2014) that weaken their conclusions. Finally, if the question to be addressed is disparate impact on demographic subgroups, voter registration files often do not contain identifiers of race or ethnicity.
The second type of data used for studying voter ID laws is longitudinal data on registration and turnout rates. One source of such data is administrative records. Since 2002, states are required to maintain an electronic file containing administrative data on voter registration and turnout. The rules for who may access the micro-data vary by state, but summaries are available from the United States Elections Project (McDonald Citation2017) website (www.electproject.org). Sample data on registration and turnout over time are also available from two ongoing surveys, the Current Population Survey (CPS) voter supplement and the Cooperative Congressional Election Study (CCES). Both surveys collect self-reported data on registration and voting behavior from a nationwide sample. The CPS supplement is from an address-based probability sample of households collected in every presidential election year since 1964 (U.S. Census Bureau Citation2006). The CCES is an online survey conducted by a private marketing company for a consortium of researchers since 2006 (Salazar Citation2015). Unlike voter registration files, these surveys contain demographic and socioeconomic characteristics of respondents, making comparisons of voting rates by subgroups possible. However, sample sizes are not sufficient to examine rates for small areas or groups. Because it is self-reported, the survey data can also suffer from social desirability bias (Karp and Brockington Citation2005).
Despite these weaknesses, both survey and administrative data have been used to directly examine the impact of voter ID laws. These studies compare turnout rates for states with and without laws, or across states with a range of strictness on the ID's allowed. Since these data contain information about actual (reported or observed) rather than potential voting behavior as the matching studies do, they allow a more direct measure of impact. However, since states having laws are not randomly selected, all the usual problems with attributing causation in observational studies occur. Researchers have used various methods to account for confounding variables. One approach is to treat the data as a quasi-experiment and analyze it using a difference-of-differences design (e.g., Alvarez, Bailey, and Katz Citation2011; GAO Citation2014, Appendix V). This method compares the change in turnout rates from one election to another for a specific set of voter ID states and its nonvoter ID neighbors. This mitigates effects of some confounders, such as national candidate popularity. However, other differences, such as competitiveness of state races and differing state ballot items, can remain and weaken attribution of causality.
The third type of data used to analyze the effects of voter ID laws is a cross-sectional sample of voters or nonvoters in which they are asked directly about their voting behaviors and motivations. One national source of such data is the aforementioned CCES, in which respondents are interviewed in two waves in election years, one before and one after Election Day. The post-election questionnaire asks respondents if they voted, and if not, why not. Other researchers have fielded their own local surveys, using general frames or registered voter frames, asking nonvoters why they did not vote (e.g., Hobby et al. Citation2015). The main weakness of these data for estimating impact is the presence of measurement error. First, self-reported data may contain errors in the voting status response, as noted above. Even if voting status is known because the frame contains the information, a nonvoter may be unable to provide accurate information about why he did not vote because he had multiple reasons, does not recall, or is reluctant to provide the reason. This problem is especially acute when the nonvoter is questioned at a significant interval after the election.
3. Previous Results Measuring Voter ID Impact
In this section, we present the estimates of voter ID impact given in previous studies. To do this, it is helpful to examine the hypothesized causal factors that explain how voter ID laws could impact eligible voter behaviors, and to specify parameters of interest based on this view. We discuss how these parameters have been estimated from various data analysis approaches.
presents potential outcomes for each eligible voter. It first partitions eligible voters based on whether or not a person would vote if there were no voter ID law in-place, with the total number of would be voters and would not be voters denoted by nwv and . The second question partitions voters into those with and without a qualifying ID, with the totals denoted by nid and
, respectively. Finally, the possible voting outcomes are presented. We assumed no voting official errors, that is, we assumed that no one with a proper ID was barred at the polling place and that no one without a proper ID was allowed to vote.
Figure 1. Diagram of hypothesized causal factors for how voter ID laws impact voter behavior.
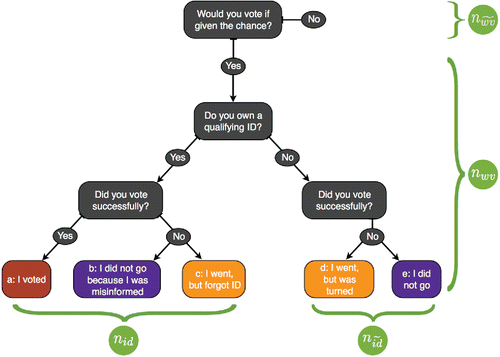
The goal of any study of voter ID laws is to estimate the count of some set of outcomes in , or to estimate their size relative to certain marginals. A limitation of every study is the uncertainty in the assignment of eligible voters to particular outcomes, or in generalizing results. Clearly, the same individual can follow a different path in the diagram in different elections, either because his propensity to vote varies, he acquires an ID, or the state law changes. Similarly, if the same individual were in a different state in an election, he may also move from one outcome to another due to differences in the type of ID required, the state laws controlling the convenience of voting, and ballot competitiveness. So any study's estimate is specific to time and place. Additional uncertainty arises from the fact that the voting intention of individual voters may not be well defined. It is known for those who turn out to vote (outcomes a, c, and d), but for others, the only method of ascertaining intention is by survey or by past voting behavior as a proxy. This means that estimating nwv can be difficult.
Legal cases against implementation of voter ID laws often rely on ID ownership and not behavior. Hence, the parameter of interest is either or
the proportion of all possible or just intentional voters who do not have the required ID, where n represents the number of possible and
the number of nonintentional voters who do not have the required ID. ID ownership matching studies that use administrative records can only estimate pid, 1 since voting intention cannot be determined from administrative files. The GAO recently reviewed 10 studies that relied on the matching of driver's license and voter registration files in a variety of states (GAO Citation2014). They showed estimates of pid, 1 that ranged from 5% to 16%. However, pid, 1 is likely to be smaller in states that allow other forms of ID. For example, Hobby et al. (2014) found in a survey of nonvoters in Texas Congressional District 23 (CD-23) that while 10.1% of voters did not have a qualifying driver's license, only 2.7% did not possess any of the seven forms of ID allowed by the Texas voter ID law. Some evidence also suggests that pid, 2 is smaller than pid, 1. In particular, Barreto, Nuno, and Sanchez (Citation2009) found in a survey of registered voters in Indiana that the ID ownership rate ranged from 2.7% to 4.7% higher for likely voters than likely nonvoters, depending on the type of ID considered.
The actual impact of the voter ID laws on voting behavior is not measured by pid, 1 nor even pid, 2. Besides those who don't own a required ID, there are other eligible voters who do not vote because they erroneously believe they lack the proper ID and thus don't turn out (outcome b). Another subset are those who own ID but do not bring it to the polling place (outcome c). For studies assessing the impact of the law, the parameter of interest is the proportion that the law prevents from voting of either all voters or intentional voters. These parameters are plaw, 1 = (nb + nc + nd + ne)/n and plaw, 2 = 1 − na/nwv, respectively.
Studies of this issue use both administrative and survey data. Neither can provide estimates of plaw, 1 or plaw, 2 directly. However, they can provide the voting rate, defined as the fraction of the registered (or eligible) voter population that successfully cast a ballot. Thus, one statistical approach for estimating plaw, 1 from such data is to calculate (or estimate if a survey) the difference between the voting rate in a comparable previous time period when the voter ID law was not in effect or in an area comparable to the target area. That is, they compute
(1)
(1) where the superscripted γ denotes the comparable time or place. If it can be assumed that the voting rate would be approximately equal in the two times (places) without the law (i.e., nγwv/nγ ≈ nwv/n), then δ ≈ plaw, 1. These studies rarely assess plaw, 2 but they could by noting that δ/pγvote ≈ plaw, 2. Alternatively, some studies compute a difference of differences using time and place data. For this they compute
where δ is defined as in Equation (Equation1
(1)
(1) ) with γ denoting a comparable place to the focal state, and δ− 1 denoting the same, but in the previous comparable time period, before either place had a voter ID law. Then δΔ ≈ plaw, 1 if the difference in voting rates for the two places from one election to the next would remain the same, absent the change in voter ID law.
The results for these studies have been mixed, ranging from no effect to small single digit percentage changes. The GAO report (GAO Citation2014) reviewed ten studies that made use of longitudinal data using one of these methods to estimate plaw, 1. Five found that plaw, 1 could not be statistically distinguished from 0, four estimated it to be between 1.6% and 3.9%, and one estimated an increase of about 2% in the voting rate after the law was enacted. These studies targeted different time periods and types of races (presidential and congressional), and most averaged over states with certain categories of voter ID laws, or included more than one election cycle. Thus, most were not specific to any time or place.
The GAO report also described its own study, which used a difference-of-differences design to estimate plaw, 1. It estimated the change in turnout between presidential elections of 2008 and 2012 in two states, Kansas and Tennessee, which had implemented voter ID laws in that time period. These differences were compared to those in four similar states that did not enact such laws. Their estimates of plaw, 1 were 3.0% and 2.7% in the two states. Since the turnout in 2012 in Kansas and Tennessee was roughly 50% (57% and 52.2% respectively), the proportion of intentional voters prevented from voting by the laws, plaw, 2, would be approximately double.
There is little data available to estimate the fraction disenfranchised by the ID laws, plaw, 3 = (nb + ne)/nwv, colored in purple in . One study, Hobby et al. (Citation2015), suggests it is a substantial fraction of the nonvoting intentional voters. It concluded that “… the most significant impact of the current Texas voter ID law is confusion and subsequently depressed voter turnout.” Their survey suggested that twice as many nonvoters cited lack of ID as the primary reason they did not vote (5.8%), as actually did lack ID (2.7%).
We believe that studies that aim to directly measure the size of individual cells in using surveys are much more likely to provide evidence of effects than studies that use aggregated longitudinal data. The difficulty of detecting effects of voter ID laws from aggregate data can be explained by the variability in voter turnout from one election to another, even when laws do not change. We examined the power of a difference-in-differences study using turnout data from 2008 to 2016. (See Appendix in the supplementary files for details.) We found that small effect sizes, such as a 1% impact on the voting rate, would be detected by such studies less than half of the time, even under the most optimistic scenario considered. This analysis emphasizes the point that absence of significant results from even careful analyses of aggregate voting data would not be unusual, even if real voter ID effects exist. Effects in the small single digits are consistent with the mixed findings in such studies.
4. Study Goals
To determine the impact of voter ID laws on potential voters, we conducted an exit poll on Election Day near the campuses of the participating schools (American University (AU), Swarthmore College (SC), and Southern Methodist University (SMU)). The sites were portions of Northern Virginia; Philadelphia, Pennsylvania; and Dallas County, Texas. Our data are of the third type discussed in Section 2, a cross-sectional sample of potential voters. We seek to estimate the proportion of intentional voters who are denied voting because they forgot or lack an ID, denoted by plaw, 4 = (nc + nd)/(na + nc + nd). These events are colored orange in .
Our data have some strengths that other cross-sectional survey data do not. Our respondents were interviewed as they were leaving a polling place, and asked to report whether they had successfully voted or not. If they indicated they had not, they were asked the reason. Because of the proximity of denial of voting to data collection, the respondents are more likely to be able to identify the primary reason they did not vote. Also, every respondent is known to have intended to vote because they were exiting a polling place; thus there is no uncertainty as to whether the impact is a potential or an actual one. On the other hand, our data have the disadvantage that they do not allow assessment of the total impact of voter ID laws on turnout rate, since the sampling frame does not include those who either know or believe they do not own a qualifying ID and therefore do not appear at a polling place. Nevertheless, the data from this study provide the means to estimate an accurate lower bound on the impact of voter ID laws on turnout, and allow for assessment of differential impact of this component for demographic groups.
Studies that examine the size of the individual outcomes of are less common. We have identified only one other published study (Cobb et al. Citation2012) similar to ours. It was carried out during the general election of 2008 in Boston to examine whether there were discrepancies by race and ethnicity in the proportion of voters asked to show ID at their polling place. That study's similarities to ours are that the data collectors were local university students, and the sample design and questionnaires were similar. However, the primary purpose of their study was different. In Massachusetts in 2008, no voter ID law had been implemented, and voters were not required to show ID at the polling place except in special circumstances. Thus, their study was not designed to assess impact of voter ID laws, but rather to determine how accurately poll workers implemented voting procedures.
For our study, the question of primary interest was what proportion of voters who came to a polling place on Election Day were unable to cast their ballot due to lack of required ID. Thus, each site's questionnaire asked persons exiting the polling place whether they had successfully cast a ballot. If they had not, they were asked why. Basic demographic characteristics of the respondents were recorded so that demographic differences could be examined.
Additional study goals varied somewhat among the sites, due in part to differences in the Voter ID laws in the three states. In Pennsylvania, voters were asked if this was their first time voting in the district, which allowed us to assess how accurately the polling place attendants were enforcing the Pennsylvania law. The Texas questionnaire included an item asking voters if they had cast a provisional ballot, to gain a fuller picture of the percentage of voters affected by any aspect of the ID law.
The Texas questionnaire also included some questions of interest to a survey sponsor, the League of Women Voters of Dallas County (LWV). One of their missions is to inform the electorate, so they were interested in identifying needed voter education. Thus, the Texas questionnaire included questions probing sources of voting difficulty, whether it was related to voter ID or not. All successful voters were asked whether more than one trip to the polling place had been required to successfully cast their ballots.
5. Methods
5.1. Sample Design
Exit polls are typically conducted by news organizations. Since 2003, a consortium of major news organizations called the National Election Pool (NEP) jointly funds the work. The methodology for our sampling procedures is similar to the NEP's, which is a two-stage probability design, with polling places as the primary sampling unit (PSU) and voters exiting the polling place, chosen according to a systematic design, as the secondary units (SSU's, American Association for Public Opinion Research (AAPOR) Citation2007). All three of our sites also used a two-stage design, collecting data from a sample of voters at a sample of polling places.
In our studies, the first-stages of selection used a probability design, which were stratified random samples in Virginia and Texas and a simple random sample in Pennsylvania. In Virginia, the population sampled consisted of those who vote in Arlington, Fairfax, and Loudon counties and the cities of Alexandria and Fairfax City. The first-stage sample included 28 out of the 405 precincts in those areas. The strata were based on income and racial composition derived from census data for the precinct. The precincts were stratified into two strata based on whether or not the combined population of African Americans, Hispanics, and Asians constituted more than 50% of the population of the precinct.
In Pennsylvania, the population was restricted to those voting in the precincts in seven zip codes in Philadelphia. The zip codes were those that could be accessed by train, so that transportation was available to the student-interviewers. From the 137 precincts in those seven zip codes, a simple random sample of 30 precincts was selected. A few precincts were excluded from the frame because they were over 1.1 miles from a train stop. The 30 precincts were assigned to times across the day based on the availability of the students.
In Texas, the population included those voting in Dallas County. The PSU's were half-hour time periods at all Dallas County polling places; therefore the frame included 10,056 PSU's. A stratified sample of 50 PSU's was selected, with strata defined by time (morning/mid-day/evening) and an index related to voting propensity. The index was a function of the proportion of old, young, and Spanish-surnamed voters registered in the precincts, all of which were identifiable from the voter registration file.
In all three surveys, the SSU's were the people exiting a polling place. In Virginia, the voters were not selected according to a probability sample; rather for convenience, the student interviewers were instructed to stay at their polling site long enough to collect 20 responses. At the other sites, however, a probability sample was implemented at the second stage. In Pennsylvania, the students used a systematic sample design, selecting every third person over a 30-min time period. In Texas, the within-PSU design was intended to be either a cluster or systematic sample. The protocol was to interview every person exiting during their half-hour PSU, unless that was impossible due to heavy voter traffic. In that case, they changed to systematic sampling, at a rate that resources allowed, and recorded the sampling rate used.
5.2. Data Collection and Analysis Methods
Interviewers for NEP exit polls approach the selected respondents as they leave the polling place and request participation. Respondents receive a paper questionnaire, which are filled and deposited in a box by the respondent, to maintain confidentiality. A similar method was used by the interviewers in our Pennsylvania site, but the Virginia and Texas questions were delivered orally and recorded by the interviewers. A Spanish version of the Texas questionnaire was produced, and Spanish-speaking interviewers were assigned, when possible, in precincts that had a high density of Hispanic surnames in the voter registration file. Copies of all three questionnaires are available in the supplementary materials.
At each site, the interviewers conducting the survey were students in statistics courses. They ranged from introductory courses for undergraduates to a graduate level course in sampling. Two to four students were typically assigned to collect the data at each sampled PSU. Though NEP typically assigns just one interviewer, including multiple interviewers at a single site should improve the ability to maintain the assigned skip interval (Bump Citation2016).
Training was conducted for the interviewers as part of their coursework. Topics covered included principles of survey sampling, the sources and impact of nonsampling errors, and ethical principles of human subjects research. Students were trained to minimize nonresponse by using scripted language to request an interview and to display clothing or badges with their school logos.
After data collection, the students reviewed and input the data into a common database. The number of questionnaires with the primary question complete was 670, 218, and 626 at the Virginia, Pennsylvania, and Texas sites, respectively. Sampling weights and design variables (strata and PSU identifiers) were prepared and appended to the sample records in the data from the probability samples (Texas and Pennsylvania). Analyses for these states were conducted using survey analysis software. The data from Virginia were summarized as though the secondary units were equally weighted, but no standard errors were computed because of the lack of proper weighting,
5.3. Nonresponse
Slightly less than half the voters approached by interviewers in the NEP exit polls agree to participate (AAPOR Citation2007; DeSilver Citation2016). The response rates at the polling places for all our sites considerably exceeded that, with rates of 68% (Texas), 78% (Pennsylvania), and 100% (Virginia) for the primary survey questions. The variability in these rates could have been caused by regional differences in mode and logistics. For example, Texas law requires interviewers to approach respondents outside the polling place in the outdoors, where there was a steady rain on Election Day. Possible reasons why our response rates exceeded NEP response rates are that our questions were less sensitive (not asking about candidate preference) and because our interviewers identified themselves as being from local institutions. On the other hand, the NEP exit poll sample is supplemented by telephone surveys of absentee and early voters, whose numbers have been growing in recent years. Our estimates do not include this component, so our estimates apply only to Election Day voters.
There was an additional layer of nonresponse at the first stage of sampling at the Texas site. Only 39 of the 50 sampled PSU's were staffed with students on Election Day due to students' scheduling conflicts. A few other PSU's were omitted due to last-minute emergencies, such as refusal of access by uninformed polling officials and traffic delays. Adjustments for nonresponse were made with weighting, where weighting classes were defined as strata and PSU's for the first and second levels, respectively. The Pennsylvania data were also adjusted for nonresponse via weighting with weighting classes defined by the PSU's.
6. Analysis and Results
The primary question we addressed was how frequently would-be voters are prevented from voting due to lack of a required ID. reports these results for all three sites. The table displays our estimates of the percentage of visits to the polling place ending in an unsuccessful vote and the percentage that the respondent reports are due to lack of ID. Estimates of the percentage of nonvoting visits ranged from a high of 8.2% in the Texas site to a low of 1.9% in Philadelphia. The percent unable to vote due to the ID law ranged from 0.41% to 1.8%, indicating that the majority of unsuccessful trips to polling places are due to some cause other than voter ID issues. However, those unable to vote due to a problem with ID were often concentrated in certain demographic groups. In Dallas, these trips were exclusively experienced by minority (black or Hispanic) females, while in Northern Virginia, all were in low income majority–minority precincts and were predominantly male. This illustrates one problem with studies that aggregate the affected populations across states with differing voter ID laws to assess if there is a differential impact on demographic subgroups. The Texas law required that the name on the state-issued ID exactly match the name on the voter registration card, while Virginia's law did not. The exact match requirement is more likely to cause problems for currently or previously married women, which could explain the discrepancy in these states. If the data were aggregated, the effect would not be apparent.
Table 1. Summary of results (SE in parentheses) of primary question.
The large percentage of unsuccessful trips to the polling place for Dallas County voters was of particular interest to the LWV. The lack of ID was estimated to account for only about 5% (SE = 3%) of these unsuccessful trips, which is about the same as the estimate of those not voting due to a line that was too long. By far the most common reason was that the voter was at the wrong polling place, which occurred in an estimated 74% (SE = 7%) of the unsuccessful trips.
The Texas questionnaire also included questions to successful voters about their voting experience to see if it had been affected by the voter ID law. They were asked whether the interview was occurring during their first trip to the polling place. If not, they were asked to identify what necessitated a return trip and whether the ballot they cast was a provisional ballot. This series of questions allowed us to estimate the percentage of voter trips in which the voter had experienced any problem related to the voter ID law. shows results from this analysis. Collectively about 1.5% of voter trips were affected by the voter ID law. A female voter was 12.6 times as likely to have had one of these problems than a male (p-value < 0.0001), and a black voter was 4.5 times as likely to have such a problem than a non-black voter (p-value < 0.0001).
Table 2. Estimates of percentage (SE) of Dallas County voters experiencing various problems on Election Day.
The questionnaire at the Pennsylvania site asked the respondents if they were a first time voter in the district and if they had been asked to show ID. The reason for these questions was to determine the frequency of incorrect implementation of the voter ID law by election officials. Pennsylvania's strict voter ID law had been overturned before the 2014 election, due to the judge's ruling that the state's campaign to explain the law misinformed voters (2014 Pa. Commw. LEXIS 62). Consequently, a less stringent law was in effect for the 2014 election, which required first-time voters in an election district and those noted in the poll book to show ID. Because of the recent change, there was concern that the law might be misapplied on Election Day, which our survey suggested was justified. Eighteen percent of respondents reported being first time voters in a district and yet 43.0% reported being asked to show ID. reports the results from these questions. Assuming everyone answered correctly, this result means almost a third of the nonfirst time voters were asked to show ID, with nonwhite voters asked more often than white ones.
Table 3. The percentage (SE) of those interviewed in Philadelphia who had to show ID, conditioned on whether they were a first time voter in the district.
7. Conclusions
Since the inception of voter ID laws, data have been employed to estimate the impact of these laws. Legal cases have often relied on ID ownership data to estimate the potential impact of voter ID laws. Matching ID ownership with voter registration files, estimates of the proportion of eligible voters without a valid ID ranged from 5% to 16% in a recent GAO (Citation2014) review. Aggregated, longitudinal data have been used to estimate the proportion of voters that the law prevents from voting. These results have been mixed, often with estimates that cannot be statistically distinguished from 0 or estimates that are positive but close to zero. Based on our power calculations, this would not be surprising even if the laws reduce turnout by a couple of percent.
Since we conducted exit polls on Election Day, we were able to directly estimate the proportion of would be voters who were turned away at the polls due to ID issues in the three areas we surveyed. These estimates ranged from 0.41% to 1.8%. As illustrated in , the disenfranchised voters our survey encountered are only a subset of those impacted by the laws. Even if the impact was as small as 5%, such a reduction in turnout could be practically meaningful, since in the 2014 federal elections, two races were decided by a margin of less than 0.5%. Four were by less than 1%. Further, and perhaps most concerning, based upon the legal arguments that have been made against the laws, we did find some evidence of a disparate impact based on demographic characteristics of the would-be voters.
Voter ID laws will continue to be an important and contentious issue for elections to come. To be able to accurately estimate the impact of these laws, there is a genuine need for more data. Exit polling data can produce estimates of the proportion of would-be voters who are not allowed to vote due to ID issues and can measure disparate impact for various demographic groups. As current and future voter ID laws are debated in society, government, and court, it is important that relevant data measuring the impact of these laws are part of the discussion.
Supplemental Material
Supplemental materials contain each of the surveys given at the polling sites and an appendix where we examined the power of a difference-in-differences study using turnout data from 2008 to 2016. The materials can be accessed on the publisher's website.
USPP_1407721_Supplementary_Files.zip
Download Zip (415.4 KB)Acknowledgments
The authors gratefully acknowledge the Swarthmore College Lang Center for Civic and Social Responsibility for their financial and logistical support and Scott Cook for co-implementing the exit polling activity in Philadelphia; Megan Snow of American University for GIS assistance; and the Dallas County League of Women voters who facilitated the project in several ways, including securing the database of registered voters in the county from the Dallas County Elections Office, securing permission for our project and clarifying logistics with elections officials, and providing transportation to the polls for some of our interviewers.
Related Research Data
References
- Alvarez, M., Bailey, D., and Katz, J. (2011), “An Empirical Bayes Approach to Estimating Ordinal Treatment Effects, ” Political Analysis, 19, 20–31.
- American Association for Public Opinion Research. (2007), “Explaining Exit Polls,” [online]. Available at http://www.aapor.org/Education-Resources/Election-Polling-Resources/Explaining-Exit-Polls.aspx
- Ansolabehere, S. (2012), “Report on Racial Differences in Matching Voter Registration Lists to Driver's License and License to Carry Databases in the State of Texas,” paper submitted June 30, 2012, Texas v. Holder, No. 12–0128 (D.D.C).
- Barreto, M. A., Nuno, S., and Sanchez, G. (2009), “The Disproportionate Impact of Voter-ID Requirements on the Electorate – New Evidence from Indiana,” PS: Political Science and Politics, 42, 111–116.
- Barreto, M. A., and Sanchez, G. R. (2012), “Rates of Possession of Accepted Photo Identification, among Different Subgroups in the Eligible Voter Population, Milwaukee County, Wisconsin.” Expert report submitted on behalf of plaintiffs April 23, 2012, in Frank v. Walker, No. 11–01128 (E.D. Wis.).
- Bump, P. (2016), “How Exit Polls Work, Explained,” Washington Post [online]. Available at https://www.washingtonpost.com/news/the-fix/wp/2016/04/22/how-exit-polls-work-explained/.
- Cobb, R. V., Greiner, D. J., and Quinn, K. (2012), “Can Voter ID Laws Be Administered in a Race-Neutral Manner? Evidence from the City of Boston in 2008,” Quarterly Journal of Political Science, 7, 2–3.
- DeSilver, D. (2016), “Just How Does the General Election Exit Poll Work, Anyway?” Pew Research [online]. Available at http://www.pewresearch.org/fact-tank/2016/11/02/just-how-does-the-general-election-exit-poll-work-anyway/
- Government Accountability Office. (2014), “Issues Related to State Voter Identification Laws,” (GAO-'14–634) [online]. Available at http://www.gao.gov/assets/670/665966.pdf
- Gray, M. (2014), “Statistics Students Learn Every Vote Counts,” AMSTATNEWS, 441, 16.
- Hobby, Gov. B., Jones, M. P., Granato, J., and Cross, R. (2015), “The Texas Voter ID Law and the 2014 Election: A Study of Texas's 23rd Congressional District,” Rice University [online]. Available at https://scholarship.rice.edu/handle/1911/92679
- Karp, J. A., and Brockington, D. (2005), “Social Desirability and Response Validity: A Comparative Analysis of Over-reporting Voter Turnout in Five Countries,” Journal of Politics, 67, 825–840.
- McDonald, M. P. (2017), United States Elections Project [online]. Available at http://www.electproject.org.
- Marker, D. (2014), “The Statistical Role in Voter ID Laws,” Statistics and Public Policy, 1, 46–50.
- Riker, W. H., and Ordeshook, P. C. (1968), “A Theory of the Calculus of Voting,” American Political Science Review, 62, 25–41.
- Salazar, E. (2015), “Announcing the 2016 Cooperative Congressional Election Study,” American Political Science Review, 62, 25–42.
- Shelby County v. Holder, 133S.Ct. 2612. (2013)
- U.S. Census Bureau (2006), “Design and Methodology: Current Population Survey,” Technical Paper 66 [online]. Available at http://www.census.gov/prod/2006pubs/tp-66.pdf
- Zengerle, P. (2012), “Young, Hispanics, Poor Hit Most by US Voter ID Laws,” Reuters Online [online]. Available at http://www.reuters.com/article/us-usa-campaign-voterid-idUSBRE88P1CW20120926