
Abstract
When compiling industry statistics or selecting businesses for further study, researchers often rely on North American Industry Classification System (NAICS) codes. However, codes are self-reported on tax forms and reporting incorrect codes or even leaving the code blank has no tax consequences, so they are often unusable. IRSs Statistics of Income (SOI) program validates NAICS codes for businesses in the statistical samples used to produce official tax statistics for various filing populations, including sole proprietorships (those filing Form 1040 Schedule C) and corporations (those filing Forms 1120). In this article we leverage these samples to explore ways to improve NAICS code reporting for all filers in the relevant populations. For sole proprietorships, we overcame several record linkage complications to combine data from SOI samples with other administrative data. Using the SOI-validated NAICS code values as ground truth, we trained classification-tree-based models (randomForest) to predict NAICS industry sector from other tax return data, including text descriptions, for businesses which did or did not initially report a valid NAICS code. For both sole proprietorships and corporations, we were able to improve slightly on the accuracy of valid self-reported industry sector and correctly identify sector for over half of businesses with no informative reported NAICS code.
1 Introduction
The North American Industry Classification System (NAICS), introduced in 1997 to replace Standard Industry Classification (SIC), is a business classification system based on industry production processes. The NAICS was developed by the Office of Management and Budget (OMB) through their Economic Classification Policy Committee (ECPC) in collaboration with the Bureau of Economic Analysis (BEA), Bureau of Labor Statistics (BLS), Census Bureau, and corresponding agencies in Canada and Mexico (OMB 2017). The NAICS categories are updated every five years under a fixed schedule for years ending in a two or seven. In the United States, the NAICS is used for publishing national statistics by industry including Gross Domestic Product (GDP), Gross Output, Employment, and Input-Output Accounts. NAICS codes in tax data are used in developing and executing targeted tax policies to benefit or customize taxes for specific industries. For example, NAICS codes were central in identifying eligible taxpayers when implementing the CARES Act provision that provided small business support to doctors and hospitals.Footnote1
The NAICS has a six-digit hierarchical structure. summarizes the information contained in the code structure reading the code from left to right. For example, consider Go-Fast Transmission Repair Shop (NAICS: 811113) which breaks down as: other services (Economic Sector: 81), repair and maintenance (Industry Sub-Sector: 811), automotive repair and maintenance (Industry Group: 8111), automotive mechanical and electrical repair and maintenance (NAICS Industry: 81111), and automotive transmission repair (National Industry: 811113). The two-digit Economic Sector categories have not been changed in any NAICS updates.
Table 1 NAICS structure – number of digits.
NAICS codes are self-reported (since 1985) on tax forms so they are subject to error. To assist taxpayers, instructions for these forms include charts of Principal Business/Professional Activity Codes with associated NAICS codes. These charts have varying degrees of granularity depending on the form type.
Forms SS-4 Application for Employer Identification Number have 12 principal activity codes that loosely correspond to a subset of NAICS Economic Sectors (IRS Citation2017)
Forms Schedule C Profit or Loss from Business (Sole Proprietorship) have principal activity codes that correspond to all applicable NAICS Economic Sectors and 315 specific six-digit codes (IRS Citation2018a)
Forms 1120 U.S. Corporation Income Tax Return Schedule K—Other Information have principal activity codes that correspond to all applicable NAICS Economic Sectors and 418 specific six-digit codes (IRS Citation2018b)
Forms 1065 U.S. Return of Partnership Income have principal activity codes that correspond to all applicable NAICS Economic Sectors and the same 418 specific six-digit codes (IRS Citation2018c)
The goal of this research is to develop effective predictive supervised models that can be used to validate reported NAICS codes in IRS administrative data and fill them in when reported codes are missing or invalid. This initial work is focused on sole proprietorships filing with Form 1040 Schedule C and corporations filing with the various Forms 1120 (1120, 1120S, 1120-L, 1120-PC, 1120-RIC, 1120-REIT, and 1120-F, here collectively referred to as Form 1120) at the two-digit NAICS (Economic Sector) level.
1.1 Related Research
Although NAICS codes are used extensively by both government agencies and industry for statistical and administrative purposes, there is no single government agency that assigns and maintains NAICS codes for business entities. Federal agencies such as the Census Bureau, Bureau of Labor Statistics, Environmental Protection Agency, Occupational Safety and Health Administration, and Small Business Administration all independently collect or assign NAICS codes to meet their respective program needs. The Census Bureau assigns NAICS codes for their surveys using the Economic Census as well as data from other federal agencies together with experienced staff. This process can be manually intensive and costly and as a result the Census Bureau has explored using statistical model-based approaches to automate the NAICS code assignment process (Dumbacher and Russell Citation2019) and extend earlier work on a joint Census-IRS autocoder application (Kearney and Kornbau Citation2005) using business description write-ins from the Economic Census focusing on the NAICS Economic Sector (first two digits). Using a bag-of-words approach for text classification, they fit naïve Bayes and regularized logistic regression using 2012 data to train their models and 2017 data to test achieving accuracy rates of 76.9% on training data and 61.2% on test data with their best performing models. Cuffe et al. ( 2019) extended this work, incorporating public data, including website text and user reviews obtained using public APIs such as Google Places, Google Types, Yelp, and other APIs. The objective of this novel work was to assess the usefulness of these data together with machine learning methods for generating NAICS codes to produce federal statistics. Although the authors reported a modest predictive accuracy of 59% for their best fitting random forest model, they noted substantial variation in predictive accuracy from 5% in sectors with little data to 83% among sectors with large amounts of data; an interesting although not unexpected result given many machine learning methods require large amounts of data to achieve good results.
A common theme throughout this work is the focus on automating the NAICS code assignment process due to resource constraints. The IRS Statistics of Income (SOI), one of 13 federal statistical agencies, also uses an extensive manual review process with an experienced staff of tax examiners to validate and correct, if necessary, self-reported NAICS codes for their statistical products. Our work focuses on a different, albeit similar problem of validating NAICS codes in our administrative systems to support IRS programs.
1.2 Problem Description
Researchers and IRS business operations often use IRS administrative data by industry when samples cannot provide the required granularity and precision. NAICS codes are important as the only straightforward way to do this. However, NAICS code reporting is prone to error, and because of the lack of tax consequences, these errors are often overlooked even in examined returns. We have no global statistics on the error rate in administrative data. However, Statistics of Income (SOI) draws a sample of returns for computing national statistics, and these returns are validated in detail, including correction of NAICS code if necessary.
Types of coding error include
Missing or invalid codes entered. We label these as “noninformative.”
Code 999999 (“other”), while technically valid for Schedule C, is usually misapplied and is functionally the same as a missing code. We also considered these “noninformative”; approximately 1% of Schedule C cases reported as Sector 99 actually were 99.
Valid code entered but incorrect for the entity.
Partially correct codes that is, correct for Economic Sector but incorrect for Industry Sub-Sector.
The rate at which SOI corrects the NAICS Economic Sector (first two digits) for the 1040 Schedule C filers in its samples was fairly stable over the time frame for this research. However, the type of SOI corrections trended slowly toward more taxpayers failing to identify a valid NAICS code. The rate at which SOI corrects the NAICS Economic Sector for Form 1120 filers in its sample trended slightly upward over the time frame of this study, while Form 1120 filers failed to provide valid NAICS codes at consistently low rates (less than 2%). See for details.
Table 2 NAICS code error rates in SOI sample for matched noneliminated 1040 Schedule C and Form 1120 Economic Sector.
SOI Schedule C data have several complications that SOI Form 1120 data do not because a single individual may file multiple Schedule Cs. (IRS records for tax year 2016 indicate that about 11% of Schedule C filers file two or more Schedule Cs, accounting for over 20% of the schedules themselves.) First, the SOI cases are weighted by F1040, not by Schedule C; the weighted values provided are the product of naively extending the weight of each F1040 to its associated Schedule Cs. Second, the accuracy of the reported NAICS code cannot be determined without a successful data link, which reduced the usable sample size; see Methods for details. Third, it is possible for the SOI examiner to determine that there was no business and the Schedule C should not have been filed at all; these cases were dropped.
2 Methods
2.1 Data
2.1.1 Data Linkage
This study involved a combination of statistical data from SOI and IRS tax administrative data. Ground truth NAICS code data from SOI’s validated sample was combined with as-filed tax return administrative data to create models which could be applied to unverified incoming return data. This as-filed data was included with SOI’s Form 1120 data, but to obtain the data for Schedule C we had to link with Individual Income Tax administrative records (IRTF).
The IRTF data and SOI data are structured differently. IRTF data has one record per Schedule C. Individuals with multiple sole proprietorships are instructed to file a Schedule C for each, in descending order of gross receipts, for up to eight Schedule Cs electronically or many more on paper. However, if there are more than three, then the records will be consolidated into only three Schedule Cs before being added to IRTF. SOI data is on a by-taxpayer level, with different fields to record information on up to three Schedule Cs. Therefore, one SOI record may legitimately match up to three IRTF Schedule C records. The Cs are ordered in both datasets. The SOI data has fields for first, second, and third Schedule C; the IRTF Schedule C records have “section numbers” for that purpose. One might therefore, naively match Section 1 to “first SOI C,” and so on, and indeed a naïve match for those values is already attached to the SOI data for some line items, called “as filed.”
Taxpayer Identification Number (TIN) is the key identifying field in IRTF data; while all SOI records include a TIN, the SOI unique identifying field for SOI records is record ID. Some data errors occur where multiple record IDs appear in the same filing period with the same TIN. At least one of these TINs must be incorrect, so any Schedule Cs pulled under that TIN matched to those SOI fields would also be incorrect.
Since the SOI “as filed” fields were drawn from IRTF data, they should always match IRTF values unless they have mistakenly not been included at all. In the small number of cases where they are not missing and do not match, the cases are eliminated as probable mismatches (less than 0.5% of initially matched Cs). This also eliminates most of the duplicate cases caused by multiple record IDs with the same TIN or more than three Schedule Cs appearing in IRTF, but a few remain (in all study years except TY2016 less than 0.1% of remaining Cs). These remaining unexplained duplicate cases are set aside. Remaining matched Cs are our sample ().
Table 3 Schedule C sample matching outcomes by study year.
While the naïve approach will produce a correct match of predictor data to corrected NAICS codes in most cases, the actual situation is more complicated. SOI’s first, second, and third C fields are for the Cs which should have been in the first, second, and third position. If a taxpayer filed two Schedule Cs with distinct NAICS codes and SOI concluded the Cs were in the wrong order, then the naïve approach would link the Section 1 Schedule C with the NAICS code that belongs to the Section 2 Schedule C and vice versa. If the taxpayer filed two Schedule Cs and SOI deemed the first one to not actually be a business, then the naïve approach would conclude the second one was deemed not to be a business, and the Section 1 Schedule C would again be linked with the NAICS code which should be associated with the Section 2 C. Various other rearrangements are also possible.
The situation is still more complicated because IRTF and SOI use different rules for rolling up multiple filed Cs into the three that will go in the data. SOI tries to combine Schedule Cs in the same industry together; if more than three industries are present, the three largest are kept and all smaller ones are combined with the largest C.1 IRTF data entry tries first to combine Cs with the same proprietor SSN (which may be an issue when the F1040 represents more than one person), and if possible combine Cs with net profit separately from Cs with net loss.Footnote2 This leaves some situations ambiguous; for example, if a single taxpayer has four Schedule Cs with net loss, it does not make clear which two should be merged.
Because SOI does not correct the “gross receipts” field, it can usually be matched to the “gross receipts” field in IRTF to confirm a match or identify a rearrangement or simple merge. Using this and a SOI field for count of Cs, over 97% of sample IRTF Schedule Cs could either be matched to a corrected NAICS code or identified as having been deemed not a business. The remainder could not be, and without a good outcome value, had to be excluded from the sample ().
While the number of cases excluded is relatively small, it is important to note that they are not a random subset. They are concentrated in the sample strata associated with very high positive or negative income.
2.1.2 Text Analysis
The tax return data include: (dollar value) line-items, for example, Gross Receipts; return characteristics, such as date incorporated or filing status of sole proprietor; and text predictors. There is one text field available for Schedule C and two for Form 1120.
Each Schedule C has a field for “description of business or profession” which may be freely filled in by the taxpayer or left blank. If the taxpayer consults a NAICS table, they will find a short description corresponding to each NAICS code, and some of them copy this description into the field, but many do not. They may also leave the field blank, but this is uncommon. Even among Schedule Cs in our sample with missing, invalid, or noninformative NAICS codes, only 7% had a blank description field; in the full sample, 2% had a blank field.
In the IRTF data the field is truncated to twenty characters. While 62%–70% of descriptions in the sample already had fewer than twenty characters and so are unaffected, many others are cut off mid-word. (The range is due to ambiguity in descriptions whose truncated form is nineteen characters; they may or may not have contained more words after a space.) After tokenizing, we cleaned the data by identifying the most common obviously truncated tokens and creating rules to replace them with their un-truncated form. This also served to combine some synonymous tokens. (For example, any token containing the string “extracti” was turned into “extracting.” This captured the truncations “extracti” and “extractin” but also the synonymous, as far as business descriptions go “extraction.” A complete list of rules is available upon request. These rules were individually defined and while they covered the most common truncations, many other truncations and spelling errors were not corrected for, and many other synonymous tokens were left distinct.)
After removing stop words and applying the data-refining rules, over 25,000 distinct tokens remained. Due to the short length of the field, few Schedule Cs had more than three tokens, and none more than five. The most common tokens are listed in .
Table 4 Twenty most common tokens, Schedule C.
Although only 253 tokens appeared more than five hundred times, this is still unwieldy as individual predictors and cutting off there would exclude clear sector-linked tokens such as “medicine,” “spa,” or “actor.”
To avoid losing useful data and limit the number of predictors, we took advantage of the background information in the NAICS. Each industry sector (two-digit NAICS code) has a several-paragraph “long” description in the NAICS manual. In addition to this, each NAICS code in use corresponds to a “short” description in words as well as a number for each digit level of specificity. (For example, NAICS code 713950 is “Bowling Centers”; 7139 is “Other Amusement and Recreation Industries”; 713 is “Amusement, Gambling, and Recreation Industries.”) All of the short descriptions falling within each sector were combined with the long sector description to create a comparison “document.” We created such a “document” for each sector, tokenized, removed common stop words, and calculated term frequency-inverse document frequency. (We used R package tidytext).
We calculated term frequency-inverse document frequency on the data, treating each Schedule C as a document. We then calculated cosine similarity between each Schedule C and each sector according to our comparison data.
The final product for text analysis was a similarity predictor for each industry sector, measuring the similarity of the case’s description to the NAICS definition text for that sector. (We also reran the analysis using more standard bag-of-words TF-IDF analysis of the most common stemmed terms but obtained poorer results.)
For Form 1120 we used a relatively simple term frequency-inverse document frequency approach to create text predictor variables. Form 1120 Schedule K contains two text fields related to industry. These are fields for the filer to describe the “business activity” and “product or service.” Each field is limited to 30 characters. We combined these fields into one text string for processing, removed any punctuation and standard stop words, and “stemmed” the words to remove common word endings in order to combine synonymous terms. (For this text processing we used the R package tm.) This resulted in a corpus of over 16,000 unique word stems. After processing, most returns had two to four terms in their combined text fields, though some had as many as ten and a relatively large proportion (12.4%) had no terms. The most common tokens are listed in .
Table 5 Twenty most common tokens (word stems) on Form 1120.
In order to limit the number of text variables to work with when modeling, we retained terms that occurred in at least 0.5% of text entries and removed the sparser terms. This left 64 terms, which were made into term frequency-inverse document frequency variables.
2.1.3 Sample Characteristics
We used SOI sample strata when subsampling for cross-validation and creation of holdout samples. The individual strata are based on levels of positive and negative income (deflated to a 1991 baseline to enable comparison) and the presence or absence of special forms or schedules, high business income, and nontaxable status. (IRS Citation2018d, 205) Corporate strata are based on assets and proceeds. (IRS Citation2019a, 384–385)
Businesses are not evenly distributed across NAICS sectors in the population or in the sample. Sample breakdown of validated NAICS sector for Schedule C and Form 1120 is reported in ; for comparison, SOI’s population estimates for sole proprietorships and corporations appear in in the Appendix A. Sector 52 is overrepresented in both samples, and Sector 21 overrepresented in Schedule Cs.
Table 6 Industry sectors and verified sample counts.
2.2 Modeling
Approaching NAICS codes, there are several possible modeling “targets.”
Is the stated code correct (that is, does it accurately describe the business), or is it a reporting error? How likely is it to be a reporting error? This need only be modeled on the subset of cases where the reported NAICS code was valid (that is, an actual NAICS code rather than a number with no NAICS meaning); when the code is invalid or missing, it must be an error.
What is the correct NAICS code, and how confident are we in that? This can be modeled on the entire set, on only those with valid reported codes, or on only those without valid reported codes.
Almost all Form 1120 have valid codes reported, but as seen in , over half the Schedule C error rate is due to a lack of a valid code, and the error rate among valid codes is smaller. For this reason, for Form 1120 we looked at returns with both valid and invalid reported codes together, and predicted the correct code, but for Schedule C we split them, and predicted errors in valid reported NAICS codes and predicted the correct sector for cases with noninformative reported codes.
Two perennial challenges of working with tax return data are (a) they tend to be highly correlated with one another (due to some being, in part, linear combinations of others), and (b) their individual distributions are heavily skewed, with many small or zero values and a few very large values. The text predictors have fewer extreme values, but still exhibit scarcity, and we anticipate many interaction effects.
Random Forest models can handle scarcity, extreme values, correlation, and interactions without difficulty. Random forest is a machine learning technique in which multiple small classification trees are constructed from subsamples and the output of all trees is combined for the final classification. We present the results of random forest models, using the R package randomForest. (Version 4.6-14). After the model is fitted, the “forest” can be retained to classify new data.
Our final random forest models involved a mix of line item and text predictors. Randomforest models are tuned with two parameters: number of trees and predictors tried per tree. We optimized with cross-validation. Variable importance for the models appears in and .
Table 7 Variable importance for Schedule C random forest models.
Table 8 Variable importance for 1120 Corporate random forest model.
Table 9 Naive baseline results.
3 Results
3.1 Baseline Results
To evaluate model success we looked at two measures. First, we computed the simple success rate (also commonly referred to as “accuracy”), or what percentage of the predicted values matched the actual values. Second, we computed the Matthews Correlation Coefficient (MCC). MCC is another way of evaluating classification success which is especially useful on heavily unbalanced datasets (Chicco and Jerman Citation2020). While it was originally designed to evaluate binary classification, there is a generalization to the multiclass case, also known as the RK correlation coefficient. It incorporates the actual occurrences and predicted occurrences in each class (Gorodkin Citation2004).Footnote3
For the rest of this analysis, we will be looking at models fitted while excluding a one-eighth holdout sample (of the relevant set); model success and MCC will be evaluated on the holdout sample.
For a naïve baseline, we assume all valid reported NAICS codes are correct and assigned cases with noninformative reported NAICS codes to be the most common valid sector for their form type – Sector 54 in both cases (although Sector 52 is most common in the F1120 sample). The results are in .
Note that for Schedule C, valid reported NAICS codes are correct in over 90% of cases.
3.2 Random Forest Results
Summary results for random forest models are presented in . In all cases this approach yields improvements over the naïve baseline, especially for Form 1120. Improvement on the Schedule C valid reported set is less noteworthy (or significant).
Table 10 Results for random forest models.
In addition to a class prediction, random forest models can give an estimated probability for each class, which we may interpret as the confidence we can have in a reported or predicted NAICS code. We can compare this probability to whether the prediction succeeded. For error prediction on the valid set, an analogous approach is to compare the predicted probability of error to whether an error occurred. Results are illustrated in .
Fig. 1 Form 1120 random forest probability of predicted NAICS code compared to prediction success; boxplot and conditional density plot.
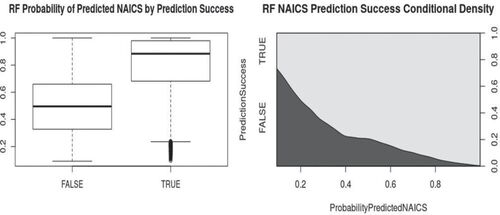
Fig. 2 Schedule C random forest predicted probability of reporting errors compared to actual errors on holdout sample; boxplot and conditional density plot.
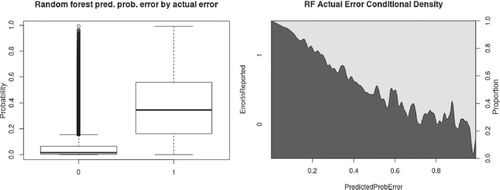
Fig. 3 Schedule C random forest probability of predicted NAICS code on noninformative set compared to prediction success; boxplot and conditional density plot.
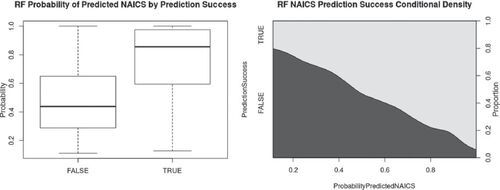
For Schedule C, we have focused on predicting NAICS codes on the noninformative set and predicting reporting error on the set of valid reported NAICS code, with only brief mention of predicting correct NAICS code on the valid reported set. The reason is that NAICS code prediction on the valid reported set has an element of risk that is not present when working on the noninformative data. A prediction on the noninformative set may be wrong, but it is replacing an unusable absence of information. A prediction on the valid reported set, if wrong, is replacing something which might be right–it is potentially a “false correction.” We can define a “false correction rate” as the percentage of cases where the NAICS code was correctly reported but predicted as incorrect. displays confusion matrices for the results of different modeling approaches on the valid reported set.
Table 11 Schedule C valid reported set random forest model results confusion matrices.
Approaching the problem as prediction of reporting error is more conservative, that is, less likely to identify a correctly reported industry sector as incorrect.
Referring to and , we see that the lift over baseline for predicting NAICS code on the valid reported set is under 1%; while the model corrects more than it falsely corrects, the false correction rate is larger than the net gain.
4 Discussion
Random forest models using tax return line-items and text fields provide a viable way of predicting two-digit NAICS codes for both Form 1120 and Form 1040 Schedule C businesses, and can also provide an estimated level of “confidence” in this prediction. In the case of Schedule Cs with valid reported NAICS codes, accepting the reported value performs similarly to the best model and avoids introducing errors. In the case of Form 1120 with valid reported NAICS codes, using a model should reduce the error rate; for cases of both form types with missing, invalid, or noninformative NAICS codes, using a model can produce usable results.
Extending this methodology to three- or four-digit NAICS codes would be a more complex problem (and would also require more consideration of trends in NAICS revision) but is an avenue worth exploring.
Acknowledgments
The authors thank Barry Johnson, Director SOI, for the data and support and Mike Strudler, SOI Individual and Tax Exempt Branch for invaluable assistance with SOI treatment of multiple Schedule Cs. The authors also thank Dr. Karl Branting, our panel discussant, at JSM 2020, for helpful feedback. Portions of this paper appeared in the Proceedings of the 2020 Joint Statistical Meetings.
Disclosure Statement
The authors have no personal or financial stakes in the results of this study.
Notes
1 Correspondence, Mike Strudler, SOI, 2019/10/10
2 Internal Revenue Manual 3.11.3.12.(1-1-2016 revision)
3 Further description of multiclass MCC may be found on ‘The RK Page’, rth.dk/resources/rk/introduction/index.html.
References
- Chicco, D., and Jerman, G. (2020), “The Advantages of the Matthews Correlation Coefficient (MCC) over F1 Score and Accuracy in Binary Classification Evaluation,” BMC Genomics, 21, 6. DOI: 10.1186/s12864-019-6413-7.
- Cuffe, J., Bhattacharjee, S., Etudo, U., Smith, J. C., Basdeo, N., Burbank, N., and Roberts, S. R. (2019), “Using Public Data to Generate Industrial Classification Codes,” in Big Data for 21st Century Economic Statistics, eds. K. G. Abraham, R. S. Jarmin, B. Moyer and M. D. Shapiro, Chicago, IL: University of Chicago Press, Forthcoming-Cited with permission.
- Dumbacher, B., and Russell, A. (2019), “Using Machine Learning to Assign North American Industry Classification System Codes to Establishments Based on Business Description Write-Ins,” in Proceedings of the American Statistical Association 2019.
- Gorodkin, J. (2004), “Comparing Two K-Category Assignments by a K-Category Correlation Coefficient,” Computational Biology and Chemistry, 28, 367–374. DOI: 10.1016/j.compbiolchem.2004.09.006.
- Internal Revenue Service (2017), “Instructions for Form SS-4, Application for Employer Identification Number,” [online], Available at https://www.irs.gov/pub/irs-prior/iss4–2017.pdf.
- Internal Revenue Service (2018a), “Instructions for Schedule C (Form 1040 or Form 1040-SR), Profit or Loss From Business (Sole Proprietorship),” [online], Available at https://www.irs.gov/pub/irs-prior/i1040sc–2018.pdf.
- Internal Revenue Service (2018b), “Instructions for Form 1120, U.S. Corporation Income Tax Return,” [online], Available at https://www.irs.gov/pub/irs-prior/i1120–2018.pdf.
- Internal Revenue Service (2018c), “Instructions for Form 1065, U.S. Return of Partnership Income,” [online], Available at https://www.irs.gov/pub/irs-prior/i1065–2018.pdf.
- Internal Revenue Service (2018d), “Statistics of Income—2016: Individual Income Tax Returns,” [online], Available at https://www.irs.gov/pub/irs-soi/16inalcr.pdf.
- Internal Revenue Service (2018e), “Statistics of Income—2016: Sole Proprietorship Returns,” [online], Available at https://www.irs.gov/pub/irs-soi/16sp01br.xls.
- Internal Revenue Service (2019a), “Statistics of Income—2015: Corporation Income Tax Returns,” [online], Available at https://www.irs.gov/pub/irs-prior/p16–2019.pdf/#page=375.
- Internal Revenue Service (2019b), “Statistics of Income—2015: Corporation Income Tax Returns,” Table 5.3, [online], Available at https://www.irs.gov/pub/irs-soi/15co53ccr.xlsx.
- Kearney, A. T., and Kornbau, M. E. (2005), “An Automated Industry Coding Application for New US Business Establishments,” in Proceedings of the American Statistical Association 2005.
- Office of Management and Budget (2017), “2017 North American Industry Classification System (NAICS) Manual,” [online], Available at https://www.census.gov/eos/www/naics/2017NAICS/2017_NAICS_Manual.pdf.
Appendix A:
Population Industry Estimates
Table A1 Population industry estimates.