
Abstract
Senior leaders in the U.S. Department of Defense, as well as nuclear strategists and academics, have argued that the advent of nuclear weapons is associated with a dramatic decrease in wartime fatalities. This assessment is often supported by an evolving series of figures that show a marked drop in wartime fatalities as a percentage of world population after 1945 to levels well below those of the prior centuries. The goal of this article is not to ascertain whether nuclear weapons are associated with or have led to a decrease in wartime fatalities, but rather to critique the supporting statistical evidence. We assess these wartime fatality figures and find that they are both irreproducible and misleading. We perform a more rigorous and traceable analysis and discover that post-1945 wartime fatalities as a percentage of world population are consistent with those of many other historical periods. Supplementary materials for this article are available online.
The strategy of nuclear deterrence has an inescapable inherent risk. So long as nuclear weapons exist, the world gambles that deterrence of nuclear war will not fail; conventional wars will not escalate to nuclear wars; substate actors will not come into possession of nuclear devices; and false alarms, miscommunications, and technical malfunctions will not lead to accidental use. Any nuclear use could escalate to unconstrained nuclear warfare, which would be devastating to humanity and much of life on earth for generations.
At the same time, however, some nuclear strategists and senior defense officials have argued that the prospect of nuclear devastation has deterred wars among great powers with a concomitant reduction in wartime fatalities compared with the centuries preceding the advent of nuclear weapons, most notably compared with the world wars of the 20th century. As do all arguments that seek to influence U.S. nuclear policy, this merits close analytic scrutiny.
Analysts have studied wartime fatalities over time for evidence that the specter of nuclear war has deterred conventional wars. One particular histogram of wartime fatalities produced in the late 1990’s has been especially influential in the defense community. This figure depicts wartime fatalities, normalized by world population, from the end of the Second World War to the 1990’s as unprecedentedly low compared with all other time periods since the year 1600. The figure and derivative versions it has inspired have been used to illustrate this suggested benefit of nuclear weapons, with the most recent use in the 2018 Nuclear Posture Review (NPR) (OSD Citation2018). Because of the influence of these figures in the defense community, it is important that their analytic basis is understood and either verified or refuted.
Thus, the goal of this article is neither to analyze the ability of nuclear weapons to effectively deter conventional warfare nor to determine whether a causal link exists between the advent of nuclear weapons and a decrease in wartime fatalities. Rather, our goal is to assess these histograms of wartime fatalities and the statistical analysis on which they are based. These histograms have been invoked to support the argument that nuclear weapons have reduced wartime fatalities and regardless of whether this conclusion is valid, it is undermined by fundamental errors in the supporting histograms.
We begin with a discussion of the original figure at issue and how it has been used and transformed over the years. We discuss the validity of conclusions that can be drawn from such histograms. How nuclear deterrence has affected conventional warfare cannot be determined from statistical analyses of wartime fatalities alone. Next, we attempt to reproduce the original figure by using the cited data sources, only to find it irreproducible and the presentation of the results misleading. In addition, we assess the most recent variant of the figure used in the 2018 NPR and find similar analytical errors as the original. (An earlier perspective criticizing the NPR figure in the context of residual risk of nuclear war and risk acceptance is found in Scouras (Citation2019).) In the latter sections of the article, we present a more rigorous and traceable analysis of wartime fatality statistics and observe that wartime fatalities after World War II are consistent with those of many historical periods since the year 1600.
The “G.I. Joe” Chart: Evolution and Use
Wartime fatalities in the nuclear era compared to those in earlier eras are quantified in various versions of a histogram of wartime fatalities, normalized by world population, spanning 1600 to the late 20th century. The earliest known (to the authors of this article) version of this histogram is shown in . While we have not been able to find this exact figure in published literature, for reasons we articulate later in this article, we believe it was produced before or during 1998 and provides the template for all later versions.
Fig. 1 The G.I. Joe chart.
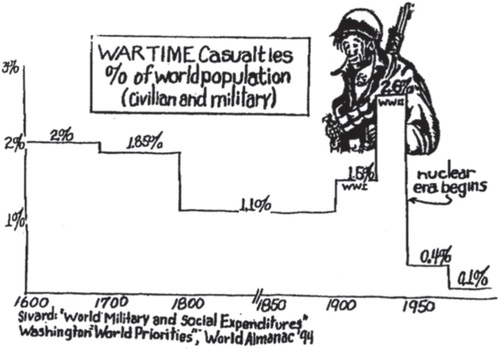
In this article, we will refer to this version as the “G.I. Joe” chart because of the Bill Mauldin cartoon of infantryman Joe that appears in the figure above the interval for World War II (Mauldin Citation1944). The data sources that were used to produce this figure are The World Almanac and Book of Facts 1994 (Famighetti Citation1993, p. 828), which provides data for the world population, and “Sivard: ‘World Military and Social Expenditures,”’ which is taken to refer to Ruth Leger Sivard’s World Military and Social Expenditures reports (Sivard Citation1974, Citation1976, Citation1977, Citation1978, Citation1979, Citation1980, Citation1981, Citation1982, Citation1983, Citation1985, Citation1986, 1987–Citation1988, Citation1989, Citation1991, Citation1993, Citation1996), some of which include tables of “War and War-Related Deaths.” Because Sivard’s reports only provide data for war-related fatalities, we conclude that the G.I. Joe chart actually shows wartime fatalities, not casualties as stated in its title. In the Assessing the Validity of the G.I. Joe and the NPR Histograms section and the supplementary material, we explore these data sources and how the G.I. Joe chart was created.
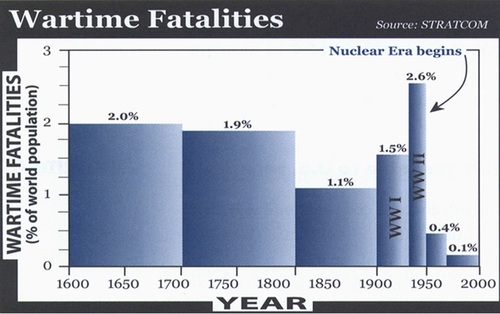
A derivative version of the G.I. Joe chart, produced at USSTRATCOM, appeared in U.S. Nuclear Policy in the 21st Century (Joseph and Lehman Citation1998), which was published by the Center for Counterproliferation Research at National Defense University and the Center for Global Security Research at Lawrence Livermore National Laboratory in 1998, and is reproduced in . This figure appeared with the caption “Wartime fatalities as a percentage of population have declined significantly in the 50 years since the nuclear era began.” This figure has striking similarities to the G.I. Joe chart, which leads us to conclude this is a computer-rendered recreation of the G.I. Joe chart rather than a new analysis. Similarities between the figures include the choice of intervals for each bin and the resulting wartime fatality percentages. Additionally, the titles and labels are similarly worded, with the exception of the correction of the word Casualties to Fatalities.
Fig. 2 U.S. Nuclear Policy in the 21st Century (1998) wartime fatalities chart.
We believe the G.I. Joe chart preceded for several reasons. First, includes the correction in the title. Second, it seems implausible that someone would take a computer-rendered figure and subsequently sketch it out by hand. Third, the G.I. Joe chart cites the 1994 version of the World Almanac as the source for world population data, which suggests it was produced around this date. Fourth, the G.I. Joe chart includes a citation of the data sources used to produce the figure, whereas and the article it was published in do not. Fifth, and perhaps most convincingly, the G.I. Joe chart reports 1.85% for the 18th century, while rounds this to 1.9%.
There are several differences between the G.I. Joe chart and . The first is that tick marks have been added to the axes; however, the x axis ticks are not evenly spaced, and how they correlate to the axis’s year labels is not clear. The tick marks also reveal that the last bin in extends to the year 2000. (Although it is not clear from , we have concluded that the last bin in the G.I. Joe chart includes data through 1990. This is discussed further in the Assessing the Validity of the G.I. Joe and the NPR Histograms section.) Because the height of the bin remains unchanged, we believe that the last bin was extended to 2000 yet still labeled with same percentage (0.1%).
Between 2006 and 2014, new versions of this histogram appeared in the published literature (Mies Citation2006, Citation2012, Citation2013; Payne and Schlesinger Citation2014). These subsequent versions all appear to be simple reproductions of the G.I. Joe chart with minor artificial changes, most notably the addition of two bins, one between the world wars and the other after World War II. However, these appear to be added without consideration of how additional bins should change the heights of the neighboring bins. Similarly, in all of the derivative versions, the last bin has been extended to the year 2000 (The War and War-Related Death tables in World Military and Social Expenditures only provide data through 1995.) in an artificial manner, without citing additional wartime fatality or world population data.
It is noteworthy that the G.I. Joe chart was the only figure in this series that included a citation of the wartime fatality data and the world population data. Providing information on the original wartime fatality and world population data used to create these figures, either in the figure itself or within the text of the document, is necessary for ensuring that these figures can be critically assessed and validated by others.
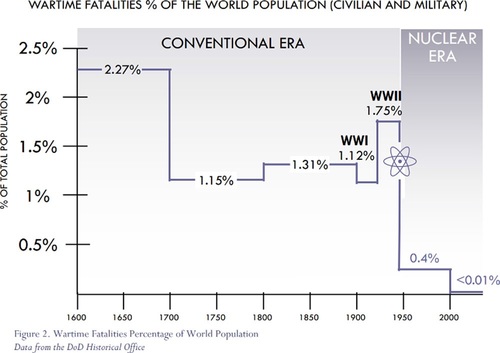
In 2018, a wartime fatalities histogram with many similarities to and appeared in the NPR (OSD Citation2018, p. 17). The figure from this report is reproduced here as . In conjunction with the figure, the NPR text included the statement, “Since the introduction of U.S. nuclear deterrence, U.S. nuclear capabilities have made essential contributions to the deterrence of nuclear and nonnuclear aggression. The subsequent absence of Great Power conflict has coincided with a dramatic and sustained reduction in the number of lives lost to war globally.” The NPR figure shows some striking similarities to the G.I. Joe chart, such as one-hundred-year intervals between 1600 and 1900 and smaller intervals during the 20th century as well as similar wording in the histogram titles and axis labels. However, the resulting wartime fatality percentages are markedly different—an indication that an alternative data source was used for wartime fatalities and/or world population. The similarities between the structures of the figures and the differences in the resulting percentages are discussed in detail in the online supplementary material.
Fig. 3 2018 Nuclear Posture Review figure.
It is important to note that these figures are not just being used to compare the nuclear era with the world wars. The use of these figures, whose data representations span four centuries, suggests that the argument being made is that wartime fatalities as a percentage of world population in the nuclear era are lower compared with those of all other eras since 1600. This claim is also supported by the accompanying text in some of the articles in which these figures appear.
Furthermore, while some authors are careful to not claim that these figures prove that the advent of nuclear weapons has caused a decrease in wartime fatalities, the figures and accompanying text indicate that this is the argument being made. These figures have been reused and this sentiment has been echoed in other documents and presentations (Murdock Citation2008; US Air Force Citation2014; Garamone Citation2017), reinforcing the importance of a meticulous critique of the histograms and the conclusions drawn from them.
We emphasize that statistical analyses of historical wartime fatalities alone cannot provide any indication of the number of wartime fatalities that would have occurred between the end of World War II and the present day if nuclear weapons had not been invented—fatalities might have been higher or lower. Therefore, these figures do not indicate whether nuclear weapons have helped to reduce wartime fatalities. Warfare is complex, and trends in wartime fatalities could be attributed to many factors besides nuclear weapons, including advancements in battlefield medicine, changes to conventional weaponry, and changes to relationships between nations, such as international alliances and trade agreements. Establishing a causal relationship would require a multidisciplinary analysis to try to understand how the world would have developed without nuclear weapons and/or historical analyses to determine whether/how nuclear weapons have prevented conflicts or kept conflicts from escalating.
Assessing the Validity of the G.I. Joe and the NPR Histograms
The goal of this section is to examine, understand, and either validate or refute the G.I. Joe chart and the NPR figure. We summarize our unsuccessful attempts to recreate both the G.I. Joe chart and the NPR figure using the cited data sources, bin structures, and population normalization method. A more detailed description of our attempts to recreate the G.I. Joe chart and the NPR figure can be found in the supplementary material. Additionally, we critique the bin structure in both the G.I. Joe chart and the NPR figure and discuss the merits of uniform bin sizes in histograms. Finally, we consider the benefits of alternative normalization approaches by world population.
To reproduce the G.I. Joe chart, we have taken what we believe to be the same approach used to create it. The wartime fatality data for our recreation were taken from the combined War and War-Related Deaths tables of the fourteenth and sixteenth editions of World Military and Social Expenditures by Ruth Leger Sivard and the world population data was taken from The World Almanac and Book of Facts 1994 (Famighetti Citation1993, p. 828). We closely examined the G.I. Joe chart to estimate bin boundaries, and using the estimated bin ranges, we calculated the sum of war-related deaths in each bin and divided by the world population at the midpoints of the intervals.
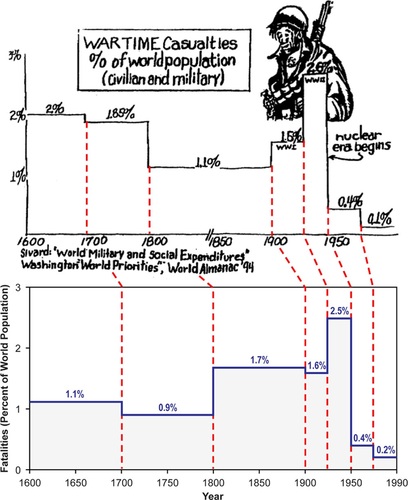
Making this simplistic calculation, we attempted to reproduce the G.I. Joe histogram but found that it is not reproducible. Our attempted reproduction is shown in (lower) along with the original G.I. Joe chart for comparison. We have kept the same interval ranges so the two charts can be more readily compared; however, the intervals in the two charts do not line up because our reproduction uses a linear x axis. To help guide the eye, we added red lines to connect the interval ranges between the two figures. While there is relatively good agreement after 1900, we see a large discrepancy between the G.I. Joe chart and our reproduction in earlier centuries.
Fig. 4 Reproduction of the G.I. Joe chart using the cited data.
For an extended discussion on these data sources, our methodology, and assumptions we made when recreating this figure, please refer to the online supplementary material.
We next attempted to reproduce the 2018 NPR figure, shown in . Through E-mail correspondence (E-mail exchange with Glen Asner, deputy chief historian at the OSD Historical Office, March 2, 2018.) with the Office of the Secretary of Defense (OSD) Historical Office, we learned that the data sources used were Peter Brecke’s Conflict Catalog, (For a description of the Conflict Catalog, see Brecke (1999). The catalog is available as an Excel file that can be downloaded from http://www.cgeh.nl/sites/default/files/Conflict Catalog 18 vars.xls.) “with some additional verification from Ruth Sivard’s World Military and Social Expenditures, 1996.” The OSD Historical Office also informed us that the world population data were from the History Database of the Global Environment (HYDE) (Goldewijk et al. Citation2010) and that to normalize the wartime fatalities, they “averaged world population at the beginning of each period with the world population at the end of each period.” (E-mail exchange with the OSD Historical Office.)
With this information provided by the OSD Historical Office, we reproduced the NPR figure with our best estimates of the NPR interval ranges. Because it was unclear what the OSD Historical Office meant by “with some additional verification from Ruth Sivard’s World Military and Social Expenditures, 1996,” we calculated the wartime fatality percentages using both databases independently and overlaid them on the same plot, as shown in . Also included in are the original NPR percentages, (In the original NPR figure, the bin from 1946 to 1999 is labeled as having a height of 0.4%. However, close inspection of the NPR figure reveals that the bin height is probably between 0.25% and 0.3%. We do not know whether the error is in the bin height or the percentage label.) shown in light purple. Additional information on the reproduction of the NPR figure is in the supplementary material.
Fig. 5 Attempted reproduction of the NPR figure.
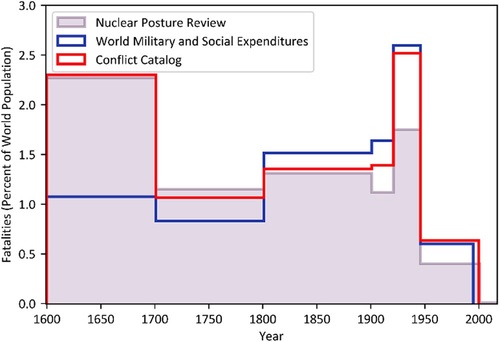
Despite the relatively good agreement between the NPR figure and our reproduction using the Conflict Catalog for the first three centuries, there is a large discrepancy in the 20th century. The NPR percentages are significantly lower than the percentages calculated using both the Conflict Catalog and World Military and Social Expenditures.
Interval Selection Considerations
Notwithstanding our failure to replicate either the G.I. Joe chart or the NPR figure, our reproductions show a trend similar to that in the G.I. Joe and NPR figures; there appears to be a significant decrease in the percentage of wartime fatalities after the advent of nuclear weapons compared with all earlier periods. However, representation of the data with nonuniform time intervals is easy to misinterpret and can be misleading. The apparent significant reduction of wartime fatalities as a percentage of world population in the nuclear era, compared with all other eras, is an artifact of the nonuniform bin structure used. By using large one-hundred-year bins for the first three centuries and smaller bins after 1900, the wartime fatality percentages in the first three centuries appear to be significantly higher relative to the post-1900 bins.
To allow wartime fatalities to be compared over time in an easily interpreted manner, it is essential to either use uniform interval sizes over the entire plot range or correct for any bin nonuniformity. According to the NIST/SEMATECH e-Handbook of Statistical Methods, a histogram is “obtained by splitting the range of the data into equal-sized bins (called classes). Then for each bin, the number of points from the dataset that fall into each bin are counted” (NIST/SEMATECH n.d.). For the histograms discussed in this article, the wartime fatality data are split into bins using the dates, in years, of the conflicts. By making a bin wider, and therefore, covering a longer period of time, more wars will be included in that bin, increasing the number of wartime fatalities counted. Similarly, for narrow bins covering only a short interval of time, fewer wars will be included in that bin, decreasing the number of fatalities. Therefore, the use of nonuniform bins can introduce artificial structures and trends in wartime fatality data. An illustrative example of how nonuniform bins can create artificial structures and trends in presented in the online supplementary material.
Even with uniform bins, the choice of bin size can alter how the histogram is viewed and interpreted. Determining a bin size that works best for a histogram strongly depends on the number of data points and the distribution of data over the range being studied. When looking at sparse data, large bin widths can help to avoid high statistical fluctuations and to reveal large-scale patterns in the data not easily noticed with small binning. However, for the wartime fatality data, the statistical uncertainties are minuscule compared with the systematic uncertainties, discussed later in the Uncertainties in Wartime Fatality and Population Data section.
Additionally, a careful choice of bin size can mitigate potential issues with normalization. For example, at first glance, the G.I. Joe chart appears to show that 2% of people alive between the years of 1600 and 1700 died from war. However, this is not actually what is shown. What is shown is the sum of all the wartime fatalities for an entire century, divided by a snapshot of world population at the midpoint of the century. However, the total number of people who lived during the 17th century was significantly larger than the population at any point during the century. For very small intervals of time, the world population and the total number of people who lived during that interval converge. However, as the interval of time grows, the total number of people who lived during an interval and the population at any one time diverge. Therefore, by using smaller intervals, the discrepancy between the population and the total number of people who lived during that interval decreases.
The format of the wartime fatality data from World Military and Social Expenditures and the Conflict Catalog set a lower bound on bin size to one year. However, yearly binning does rely on the assumption that war deaths are evenly distributed over the entire period of a conflict. While this assumption will lead to inaccuracies within wars, the long-term structure will be more representative of the actual percentage of a population killed by war.
A New Analysis of Wartime Fatalities
In this section, we present an analysis of wartime fatalities from 1600 to modern times that, contrary to the G.I. Joe chart, its descendants, and the NPR histogram, is reproducible, statistically rigorous, and easy to interpret.
Wartime Fatality Databases
For our analysis, we want to determine whether there is a significant decline in wartime fatalities after the advent of nuclear weapons. To make this determination, we need a data source for wartime fatalities spanning a long period of time before and after 1945. While there are many sources of war fatality data for specific conflicts, countries, or periods of time, there are few comprehensive wartime fatality databases that include conflicts from around the globe over a long historical period that extends to relatively modern times. In our research, we identified four databases that best fit these criteria. A comparison of the fatalities from these databases is shown with single-year bins in .
Fig. 6 Comparison of the wartime fatality databases.
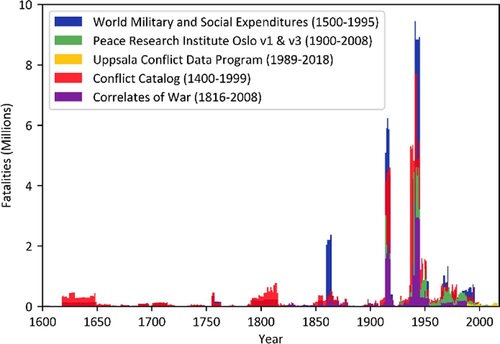
In addition to these four databases, we looked into the wartime fatality data from the Uppsala Conflict Data Program (UCDP) (Allansson, Melander, and Themnér Citation2017), shown in yellow. This database provides wartime fatality data from 1989 to the present day, so it does not fit our criteria. However, we included this database in our study in hope that it could be combined with another database to extend our analysis to the present.
As shown in , there are large discrepancies between the databases. To understand the source of these discrepancies, one needs to understand how these databases are formed and how the number of war-related deaths is determined. How the databases are developed is discussed in detail in the supplementary material.
Although the large discrepancies in the number of wartime fatalities among the databases can be explained by understanding how the databases are developed, our investigation did not clearly indicate which database is most accurate. For this analysis we will use the Conflict Catalog and World Military and Social Expenditures 1991 war-related death data extended to 1995 using the sixteenth edition of the report. We chose to compare these two databases because they include deaths globally over a larger time span and because of their prior use in the producing the G.I. Joe and NPR figures. Additionally, we do not combine these databases with others to increase the time range, as doing so would introduce additional flaws and inconsistencies into the results, as discussed in the online supplementary material.
World Population
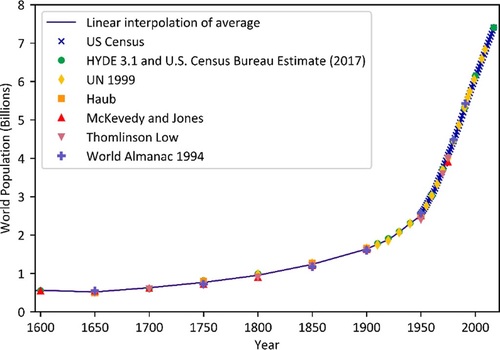
There are many sources of world population estimates, and fortunately the differences among them are relatively small. shows the world population from 1600 to 2016 from various sources including those used in the G.I. Joe and NPR figures. Both The World Almanac 1994 and HYDE 3.1 world population data are in good agreement with the other sources, especially after the year 1900. For our new analysis, we used a linear interpolation (shown as a purple line) of the full dataset shown in . For years where more than one source provided a world population value, we used the average between the sources in the interpolation.
Fig. 7 Comparison of the world population estimates from 1600 to 2016.
Uncertainties in Wartime Fatality and Population Data
While uncertainties in wartime fatalities and population data are difficult to quantify with the available data, we know they are large and temporally and geographically dependent. None of the wartime fatality databases or world population data studied for this article provide uncertainties, and while we cannot quantify uncertainties ourselves without the original fatality and population data sources and methodologies, we can discuss a few of the possible sources.
Determining the number of fatalities resulting from a war requires combining multiple data sources with diverse methodologies. Statisticians and historians who study fatalities use a variety of methodologies to determine the number of fatalities, as discussed in the supplementary material. Thus, while variations between databases in can be largely attributed to coding and verification differences, variations are also a result of the uncertainties inherent to the methodologies used to determine fatality statistics. The uncertainties related to each of these methodologies vary significantly and can be difficult to determine.
Integral to this analysis is the understanding of how uncertainties vary between time periods and conflict locations. Historical estimates of wartime fatalities depend on record keeping from the era and geographical location of the conflict. As we go farther back in time, we expect that relative uncertainties will grow, especially in parts of the world where older conflicts are likely missing from the databases. Evidence of this in the databases can be found in the low number of conflicts outside of Europe, North America, and Asia before 1800.
Similarly, even considering only the modern era, record keeping practices are not infallible and likely differ by location. Record keeping by one or more of the belligerent parties might be lacking during a conflict, especially when records concern marginalized communities that might be the target of violence. In addition to issues with record keeping, some data sources and reporting organizations might have reason to falsify the numbers. Governments, humanitarian societies, and newspapers might inflate the number of fatalities to garner sympathy or to attempt to gain international support and aid. Similarly, governments might deflate the numbers to avoid criticisms related to noncombatant fatalities, to avoid intervention or civil unrest, or to appear more resilient to adversaries.
Adding to these complications are deaths not resulting directly from battle wounds. Extending the definition of wartime fatalities to include deaths resulting from degraded sanitation, famine, and destroyed or over utilized medical resources as a result of war forces the statistician to understand prewar conditions and to successfully extrapolate those conditions to estimate the number of fatalities that would have occurred if the war had not taken place.
While the world population data sources do have extraordinarily high agreement over the past four centuries, this is not necessarily a reflection of low uncertainties in individual estimates. The uncertainties from world population estimates likely vary with time period and geography. Also, the linear interpolation, especially between world population values before 1900, where the data points are less frequent, adds to the uncertainty more than in recent periods where only short time differences are interpolated.
Results
shows our results of annual wartime fatalities as a percentage of world population from 1600 to the late 1990’s. We created using the combined War and War-Related Death tables from the fourteenth and sixteenth editions of World Military and Social Expenditures and using the Conflict Catalog. For wars that spanned multiple years, we assumed fatalities were evenly distributed over the duration of the war. Conflicts with over one million deaths in total are labeled.
Fig. 8 Wartime fatalities as a percentage of world population.
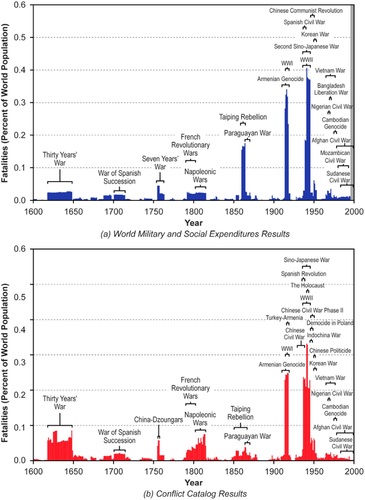
To produce these figures, yearly fatality estimates were normalized by the annual estimate of world population as determined using a linear interpolation of a variety of population sources. We used yearly binning to minimize the difference between population and the number of people who lived during an interval. Additionally, yearly binning reveals details in wartime fatality trends that are missed with larger binning and allows one to recognize individual wars and quiescent periods.
reveals that although we are in an era marked by relatively low levels of wartime fatality percentages, especially compared with the first half of the 20th century, the fatality percentages in the nuclear era are not unprecedented. They are similar, and even slightly higher in some cases, to those during extended periods of time before World War I. This is in contrast to the G.I. Joe chart and NPR figure, which erroneously appear to show that the nuclear era has significantly fewer wartime fatalities (normalized by world population) than all other periods since 1600.
In the online supplementary material, we also present wartime fatalities as a percent of world population using the Correlates of War (Sarkees and Wayman Citation2010) and the Peach Research Institute Oslo (Lacina and Gleditsch Citation2005) databases.
Summary and Conclusions
An evolving series of histograms showing wartime fatalities as a percentage of world population over four centuries has been used by prominent nuclear strategists and senior defense officials for nuclear weapons advocacy. These histograms erroneously appear to support the argument that the advent of nuclear weapons correlates with a significant decline in wartime fatalities.
In this article, we assess the G.I. Joe chart, which we believe to be the original version of these histograms. We attempt to recreate the G.I. Joe chart from the cited data sources and find that it is irreproducible and that reasonable variations in the methodology used to produce the histogram do not resolve this problem. Furthermore, we find the irregular interval selection to be misleading because it creates an artificial trend in the histogram indicating a significant decline in wartime fatalities since the advent of nuclear weapons. When the irregular bin sizes are accounted for and other analytic flaws are addressed, we find the number of wartime fatalities as a percentage of world population since 1945 to be consistent with those of many other periods of time before the advent of nuclear weapons.
Additionally, we assess a recently published version of this histogram, which appeared in the 2018 NPR. While the NPR figure appears to be a fresh analysis looking at the percentage of the world population that perished due to warfare from 1600 to the present day, it repeats the primary errors found in the original G.I. Joe analysis. We find that the NPR figure is also irreproducible using the methodology and data sources provided by the OSD Historical Office and that the irregular bins used in the figure result in the same artificial trend seen in the G.I. Joe chart.
We have conducted a new analysis of wartime fatalities over time that eliminates the irregular bin structure and other primary flaws of the previous analyses discussed in this article. Our analysis reveals that the percentage of wartime fatalities after World War II is consistent with wartime fatalities in many historical periods, refuting the analytic finding that we are living in an era of unprecedentedly low wartime fatalities. The uncertainties in our analysis are large but are difficult to quantify from the available data. They stem from large uncertainties in the number of war-related deaths, which vary significantly over time and geographical location. Additionally, there are large discrepancies among wartime fatality databases stemming from how they define war, which deaths qualify as war-related deaths, and the level of verification required for each death.
Finally, it is important to understand the limitations of this type of statistical analysis in determining a causal relationship between the advent of nuclear weapons and any change in the number of wartime fatalities. Such an analysis can show a correlation between the two, but a complex multidisciplinary analysis would be required to establish a causal connection. Understanding the potential for nuclear weapons to deter great powers from waging conventional wars and to limit the loss of life in such wars is a worthy pursuit that deserves thorough consideration. However, decisions vital to international security must be based on rigorous and traceable analysis.
Supplemental Material
Download PDF (556.9 KB)Supplementary Material
The supplementary material provides detailed information on our attempts to recreate the G.I. Joe chart and Nuclear Posture Review (NPR) figures; interpretation of histograms with nonuniform bins; issues with normalization by population; and a detailed comparison of wartime fatality databases.
References
- Allansson, M., Melander, E., and Themnér, L. (2017), “Organized Violence, 1989–2016,” Journal of Peace Research, 54, 574–587. DOI: 10.1177/0022343317718773.
- Brecke, P. (1999), “Violent Conflicts 1400 A.D. to the Present in Different Regions of the World,” in Paper Presented at the Peace Science Society 1999 Meeting, Ann Arbor, MI, October 1999.
- Editors of Encyclopaedia Britannica. (2019), “Taiping Rebellion,” Encyclopaedia Britannica. Available at https://www.britannica.com/event/Taiping-Rebellion.
- Famighetti, R., ed. (1993), The World Almanac and Book of Facts 1994, Mahwah, NJ: World Almanac.
- Garamone, J. (2017), “Stratcom Commander Makes Case for Modernizing Nuclear Triad,” DoD News, Defense Media Activity, March 31.
- Goldewijk, K. K., Beusen, A., van Drecht, G., and de Vos, M. (2010), “The HYDE 3.1 Spatially Explicit Database of Human-Induced Land-Use Change Over the Past 12,000 Years,” Global Ecology and Biogeography, 20, 73–86. DOI: 10.1111/j.1466-8238.2010.00587.x.
- Joseph, R., and Lehman, R., project directors. (1998), U.S. Nuclear Policy in the 21st Century: A Fresh Look at National Stategy and Requirements, Final Report, Washington, DC: Center for Counterproliferation Research, National Defense University; and Livermore, CA: Center for Global Security Research, Lawrence Livermore National Laboratory.
- Lacina, B., and Gleditsch, N. P. (2005), “Monitoring Trends in Global Combat: A New Dataset of Battle Deaths,” European Journal of Population/Revue Européenne de Démographie, 21, 145–166. DOI: 10.1007/s10680-005-6851-6.
- Mauldin, B. (1944), Stars and Stripes (Mediterranean edition), June 21.
- Mies, R. (2006), “US Nuclear Threat Can Enhance Stability,” APS News, 15 (6), Back Page. Available at https://www.aps.org/publications/apsnews/200606/backpage.cfm.
- Mies, R. (2012), “Strategic Deterrence in the 21st Century,” Undersea Warfare, 48, 12–19.
- Mies, R. (2013), “Strategic Deterrence in the 21st Century,” National Security Science, 42–51.
- Murdock, C. A. (2008), The Department of Defense and the Nuclear Mission in the 21st Century: A Beyond Goldwater-Nichols Phase 4 Report, Washington, DC: Center for Strategic and International Studies.
- National Institute of Standards and Technology (NIST)/SEMATECH. (n.d.), “NIST/SEMATECH e-Handbook of Statistical Methods.” Available at http://www.itl.nist.gov/div898/handbook/.
- Office of the Secretary of Defense (OSD). (2018), Nuclear Posture Review, Washington, DC: US Department of Defense.
- Osborne Daponte, B. (1993), “A Case Study in Estimating Casualties From War and Its Aftermath: The 1991 Persian Gulf War,” The PSR Quarterly, 3, 57–66.
- Payne, K. B., and Schlesinger, J. (2014), “Minimum Deterrence: Examining the Evidence,” Comparative Strategy, 33, 2–103. DOI: 10.1080/01495933.2014.868274.
- Sarkees, M. R., and Wayman, F. (2010), Resort to War: 1816–2007, Washington, DC: CQ Press.
- Scouras, J. (2019), “Nuclear War as a Global Catastrophic Risk,” Journal of Benefit-Cost Analysis, 10, 274–295. DOI: 10.1017/bca.2019.16.
- Sivard, R. L. (1974), World Military and Social Expenditures, Washington, DC: World Priorities.
- Sivard, R. L. (1976), World Military and Social Expenditures, Washington, DC: World Priorities.
- Sivard, R. L. (1977), World Military and Social Expenditures, Washington, DC: World Priorities.
- Sivard, R. L. (1978), World Military and Social Expenditures, Washington, DC: World Priorities.
- Sivard, R. L. (1979), World Military and Social Expenditures, Washington, DC: World Priorities.
- Sivard, R. L. (1980), World Military and Social Expenditures, Washington, DC: World Priorities.
- Sivard, R. L. (1981), World Military and Social Expenditures, Washington, DC: World Priorities.
- Sivard, R. L. (1982), World Military and Social Expenditures, Washington, DC: World Priorities.
- Sivard, R. L. (1983), World Military and Social Expenditures, Washington, DC: World Priorities.
- Sivard, R. L. (1985), World Military and Social Expenditures, Washington, DC: World Priorities.
- Sivard, R. L. (1986), World Military and Social Expenditures, Washington, DC: World Priorities.
- Sivard, R. L. (1987–1988), World Military and Social Expenditures, Washington, DC: World Priorities.
- Sivard, R. L. (1989), World Military and Social Expenditures, Washington, DC: World Priorities.
- Sivard, R. L. (1991), World Military and Social Expenditures, Washington, DC: World Priorities.
- Sivard, R. L. (1993), World Military and Social Expenditures, Washington, DC: World Priorities.
- Sivard, R. L. (1996), World Military and Social Expenditures, Washington, DC: World Priorities.
- US Air Force. (2014), “Is ‘Zero’ Really a Great Idea?,” Air Force Magazine, 97 (1).