
 ?Mathematical formulae have been encoded as MathML and are displayed in this HTML version using MathJax in order to improve their display. Uncheck the box to turn MathJax off. This feature requires Javascript. Click on a formula to zoom.
Abstract
Using the COVID-19 Trends and Impact Survey, we estimate the average effect of COVID-19 vaccinations on self-reported feelings of depression and anxiety, isolation, and worries about health among vaccine-accepting respondents in February 2021, and find 3.7, 3.3, and 4.3 percentage point reductions in the probability of each outcome, respectively, with particularly large reductions among respondents aged 18 and 24 years old. We show that interventions targeting social isolation account for 39.1% of the total effect of COVID-19 vaccinations on depression, while interventions targeting worries about health account for 8.3%. This suggests that social isolation is a stronger mediator of the effect of COVID-19 vaccinations on depression than worries about health. We caution that these causal interpretations rely on strong assumptions. Supplementary materials for this article are available online.
Keywords:
1 Introduction
The COVID-19 pandemic and the associated social isolation, economic hardship associated with job loss, and social uncertainty led to an increase in psychological distress (Pfefferbaum and North Citation2020). For example, Breslau et al. (Citation2021) showed that the same number of people experienced serious psychological distress in May 2021 as the entire year prior to the pandemic. Santomauro et al. (Citation2021) estimated that the pandemic caused a 27.6% increase in cases of major depressive disorder and a 25.6% increase in cases of anxiety disorders globally. Younger adults have consistently been found to be among the most adversely subgroups (Santomauro et al. Citation2021; Sojli et al. Citation2021). Secondary consequences of these mental health impacts, such as suicide and drug overdoses, are also of concern (see, e.g., Glober et al. Citation2020; Kawohl and Nordt Citation2020).
If the COVID-19 pandemic worsened mental health, then perhaps receiving a COVID-19 vaccination improved it. This might happen, for example, by decreasing worries about health or social isolation. We investigate this hypothesis by estimating the effects of COVID-19 vaccinations on depression and anxiety, feelings of social isolation, and worries about health in February 2021. Our analysis is based on the COVID-19 Trends and Impacts Survey (CTIS) (Salomon et al. Citation2021), a cross-sectional survey designed by the Delphi group at Carnegie Mellon University and administered in collaboration with Facebook. We quantify the average effect of COVID-19 vaccinations on these outcomes among a subset of vaccine-accepting Facebook users during February 2021. By vaccine-accepting we mean CTIS respondents who indicated that they either would receive a COVID-19 vaccine if offered one that day, or who indicated that they had already received a COVID-19 vaccine. By depression and anxiety we mean self-reported feelings, not a clinical diagnosis. A key assumption for the causal interpretation of this analysis is that conditional on vaccine-acceptance and observed covariates, vaccinated and unvaccinated respondents differed on average only in vaccination status.
We also examine effect heterogeneity and mediation. For our heterogeneity analysis, we consider both pre-specified and data-driven subgroups, using an approach similar to Athey and Imbens (Citation2016). For our mediation analysis, we consider a model where COVID-19 vaccinations affect depression and anxiety through feelings of social isolation, worries about health, and a direct effect capturing all other channels. We allow the causal ordering of the mediators to be unknown; however, we assume that they are determined prior to the outcome, and we assume no post-treatment confounding of these mediators. Using the interventional effect decomposition proposed by Vansteelandt and Daniel (Citation2017), we estimate the proportion of the total effect on depression via each mediator. While interventional indirect effects do not necessarily reflect mechanisms without stronger assumptions (Miles Citation2022), this is the first study we are aware of that attempts to estimate the effects of COVID-19 vaccinations on depression via intermediate pathways.
Section 2 presents a brief review of the related literature and our contributions. Section 3 describes our data and provides summary statistics. Section 4 outlines our identification, estimation, and inferential strategy. Section 5 presents our results. Section 6 considers the sensitivity of our results to our causal assumptions and their robustness to analytic choices, and Section 7 provides discussion and conclusion. Additional materials are available in the Appendices.
2 Related Literature
Two concurrent studies examined the effect of COVID-19 vaccinations on mental health: Perez-Arce et al. (Citation2021) and Agrawal et al. (Citation2021). Perez-Arce et al. (Citation2021) use longitudinal data from the Understanding America Survey and fixed-effects models to estimate that vaccines caused a 4% reduction of the probability of being at least mildly depressed and a 15% reduction in the probability of being severely depressed. When testing for effect heterogeneity, they were unable to rule out that the effects were the same across sex, race, and education level. Agrawal et al. (Citation2021) use repeated cross-sectional survey data from Census Pulse. Using heterogeneity in state-level eligibility requirements as an instrumental variable, they use two-stage least squares to estimate that COVID-19 vaccinations reduced anxiety and depression symptoms by nearly 30%. They find larger effect sizes among individuals with lower education levels, who rent their housing, who are unable to telework, and who live with children.
Our identification strategy instead hinges on an assumption that sample selection and COVID-19 vaccination are independent of potential outcomes given vaccine-acceptance and observed covariates. This assumption precludes confounding at the population-level and biases induced by conditioning on our sample. We also exploit auxiliary data to identify potential high impact subgroups hence mitigating the risk of false discoveries. Finally, we estimate interventional indirect effects to better understand the mechanisms through which COVID-19 vaccinations affect depression and anxiety. By contrast, the previous studies only identify average effects or local average effects, do not use sample-splitting for their heterogeneity analyses, and do not address mediation beyond speculation. A key contribution of our paper is therefore our mediation analysis. This analysis hinges on the idea that worries about health and social isolation are the two primary pathways through which vaccinations would change depression and anxiety. These are commonly cited as two major ways that the pandemic has adversely impacted mental health (Robb et al. Citation2020; Gonçalves et al. Citation2020; Corbett et al. Citation2020).
3 Data
Our primary dataset is the COVID-19 Trends and Impact Survey (CTIS), created by the Delphi group at Carnegie Mellon University in collaboration with Facebook. From April 2020 through June 2022, Facebook offered the CTIS using a stratified random sample (strata defined by geographic region) of approximately 100 million US residents from the Facebook Active User Base who use one of the supported languages: English, Spanish, French, Brazilian Portuguese, Vietnamese, and simplified Chinese. A link to participate in the survey was displayed at the top of users’ News Feed. Users received this offer at most once per month depending on their geographic location. The goal was to obtain approximately one million monthly responses. The CTIS evolved over time, but all waves of the survey instrument include questions about COVID symptoms, health behaviors, mental health, and demographics. A complete list of the questions over time is available online. Salomon et al. (Citation2021) provides more details about the survey.
We analyze the period from February 1–28, 2021.Footnote1 We choose this timeframe to increase the plausibility of our identifying assumptions, which we discuss further in Section 4.4. Our primary outcome (Y) is whether a respondent reported feeling depressed or anxious “most” or “all” of the time in the previous five days. We hereafter refer to this variable as “depressed.” Our treatment variable (A), is an indicator of whether the respondent ever received a COVID-19 vaccine.Footnote2 Importantly, the CTIS does not tell us when a respondent was vaccinated. We also consider responses to how often a respondent felt isolated from others in the previous five days (M1), and how worried respondents reported feeling about themselves or an immediate family member becoming seriously ill from COVID-19 (M2), each containing four levels.Footnote3 We hereafter refer to these variables as “isolated” and “worries about health,” respectively. We also create the variable M as the sixteen level joint variable . Finally, we dichotomize M1 and M2 when analyzing them as outcomes. Specifically, we create indicators for the responses “most” or “all” of the time for isolation, and “very worried” for worries about health. Whenever referring to our outcomes analyses, for simplicity we refer to any outcome as Y.
We consider several covariates recorded in the CTIS pertaining to demographic, household, employment, and health status. For demographics we consider each respondent’s age category, race, ethnicity, gender, and highest education attained. For household variables, we construct indicators of whether a respondent lives alone; lives with a child attending school in-person full-time, part-time, or not in school; or lives with an elderly (over 65) individual. For employment, we record whether each respondent worked for pay in the previous 30 days, and whether their work was at home or outside. Among respondents who work, we record the respondent’s occupation type, including healthcare, education, service-industry workers, protective services, and any other employment section. Finally, we record information regarding each respondent’s health and health behaviors, including whether they have previously been tested for and/or diagnosed with COVID-19, how many “high-risk” health conditions they have ever been diagnosed with, (0, 1, 2, or three or more), and whether they received a flu shot since April 2020 (included as a proxy for health behaviors). We also record whether the respondent took the survey in English or Spanish. For all of the CTIS survey-measured covariates, we recode missingness as a separate category to account for item nonresponse. Lastly, we augment the dataset with indicators of each respondent’s state and week of response. The state indicators can control for fixed state-level policies during the study period that may be associated with both vaccine access and depression, including eligibility requirements, while the week indicators control for time trends associated with both treatment and outcomes.
We also join several county-level variables using each respondents’ FIPS code. Using data from the 2019 American Community Survey, we add the county-level population, population density, percent living in poverty, percent uninsured, and Gini index. Using the National Center for Health Statistics Urban-Rural classification scheme, we classify the type of county each respondent lives in (Large Central Metro, Large Fringe Metro, Medium Metro, Small Metro, Micropolitan, and Non-core regions). These variables help control for differential COVID-19 vaccine access. We also include the total number of deaths per capita from COVID-19 in each county the final two weeks in January, and divide this variable into sextiles (data obtained from Johns Hopkins University). Finally, we include Biden’s county vote share at the county-level (Biden minus Trump vote totals divided by total votes). We denote all demographic and county-level covariates as X.
Our initial dataset from February includes 1,232,398 responses. We exclude 2,530 respondents whose Facebook user language was not English or Spanish, 3,690 responses from Alaska—Alaska did not report 2020 voting results at the county-level—and 39,526 responses that did not provide FIPS code information—preventing us from merging county-level covariates. We then subset our data to only include respondents who say that they “probably” or “definitely” would get the COVID-19 vaccine if offered to them that day or who reported already being vaccinated (V = 1). This left 881,315 responses, excluding 229,894 vaccine-hesitant respondents and 75,443 respondents who did not indicate whether or not they intended to receive a COVID-19 vaccine. Finally, 758,594 respondents on our primary sample, or 86.1%, provided answers to all questions pertaining to vaccination and all three outcomes (R = 1). This defines our analytic sample. Additional details are available in Appendix 1, supplementary materials.
3.1 Summary Statistics
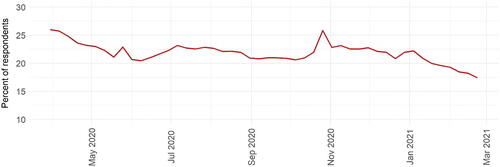
displays the weekly prevalence of depression among all CTIS respondents. The plot displays a spike in May 2020 following the police murder of George Floyd and the associated protests, another spike in early November 2020 during the presidential election, and generally decreasing depression afterwards. One exception occurred during the week of January 6th, when Donald Trump instigated an insurrection on the U.S. Capitol following his loss in the 2020 election.
Fig. 1 Trends in depression and anxiety, April 2020–February 2021.
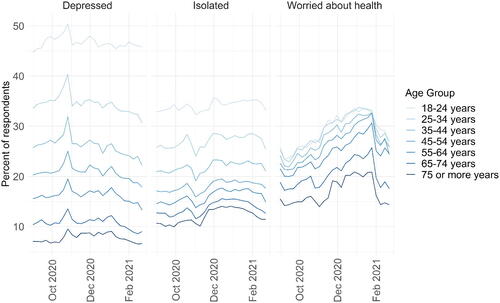
The prevalence of depression varies substantially by age group. The left-hand panel of shows the weekly prevalence from October 2020 through February 2021, with rates increasing monotonically across seven age groups. This may depict a real negative correlation between depression and age; however, an alternative interpretation could be that younger individuals have a different vocabulary around mental health than older individuals and respond to these questions differently. While possible, displays similar patterns for isolation and worries about health. Perhaps paradoxically, the percentage of respondents who report being very worried about their health is lowest among the older respondents and generally highest among 18–34 year old respondents.Footnote4
Fig. 2 Mental health trends, October 2020–February 2021.
Each outcome declined in prevalence throughout February 2021, with particularly large declines in worries about health. This may reflect seasonal trends and the fact that the number of new COVID-19 infections was falling substantially.Footnote5 However, this timeframe also coincided with substantial numbers of people receiving their COVID-19 vaccinations. illustrates number of individuals and the percentage vaccinated within each age category among all CTIS respondents in February 2021.Footnote6
Table 1 Percent CTIS respondents vaccinated by age group, February 1st–28th, 2021.
Our study examines whether COVID-19 vaccinations in part account for these improving outcomes during February 2021. We begin by examining the differences in the prevalence of each outcome in vaccinated versus unvaccinated respondents that month, taking these averages within separate subgroups. displays these results.
Fig. 3 Associations between mental health outcomes and vaccination, February 2021.
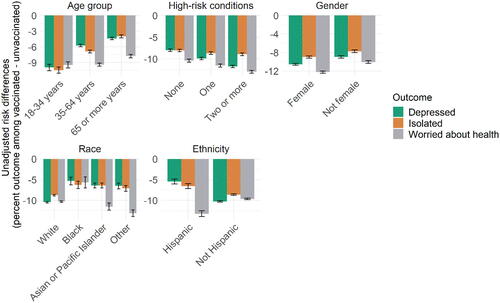
Given the high base-rates of depression and isolation among the youngest respondents, perhaps not surprisingly we observe the largest declines in the prevalence of each outcome among younger respondents relative to older ones. We also see larger declines in rates of depression and isolation among White relative to Black respondents, and non-Hispanic relative to Hispanic respondents. When examining worries about health by each demographic category, the declines appear lower among the oldest age groups, higher among people with three or more high-risk conditions, and higher among Hispanic versus non-Hispanic respondents. Broadly speaking, patterns in depression and isolation appear more similar to each other than to patterns in worries about health.
Of course, COVID-19 vaccinations were not randomly assigned, and we cannot make causal claims from these associations. For example, individuals who were most at-risk and who had the means were most likely to receive the vaccination. If these same individuals were also more likely to be depressed or anxious without the vaccine, then these associations would overstate the absolute magnitude of any treatment effects. We therefore adjust these estimates to control for the demographic, household, employment, health, and county-characteristics described previously, as well as state and week indicators, and outline the assumptions necessary for these adjusted associations to reflect causal quantities. Additional summary statistics are available in Appendix 1, supplementary materials.
4 Methods
4.1 Preliminaries
Recall that A indicates prior receipt of COVID-19 vaccination, M1 isolation, M2 worries about health, and Y depression. X indicates the covariate vector described in Section 3, and V
indicates vaccine-acceptance. We define S as an indicator of responding to the survey, and as indicators of observing
, respectively. We observe n independent samples from a pool of active Facebook users residing in the United States of the random variable
. We define two important functions of this distribution. First, we let
. This is an indicator of whether we observe all outcomes, mediators, and treatment assignment information (hereafter “complete-cases”) for a respondent. Second, define Z = RSV. In other words, Z is an indicator of inclusion in our analytic sample.
4.2 Estimands
We next define causal estimands with respect to our outcomes and mediation analyses using potential outcomes notation. Before defining these quantities, we make the following assumptions. First, we invoke the SUTVA. This implies that there is only one version of treatment and rules out interference between individuals: specifically, each individual’s potential outcomes only depend on their own vaccination status. Second, we assume no carryover effects. This implies that an individual’s potential outcome having been vaccinated one week prior to responding to the CTIS is identical to their potential outcome were they vaccinated one month prior. Finally, we assume no anticipatory effects, implying that future vaccination status does not affect one’s potential outcomes at the time an individual responded to the CTIS.
Under these assumptions, we define the potential outcomes for each individual as : that is, an individual’s outcome when setting their vaccination status Ai to level ai. This quantity does not depend on anyone else’s vaccination status (SUTVA), their past vaccination status (no carryover effects), nor their future vaccination status (no anticipatory effects). Finally, we define the function
, representing the expected potential outcome under treatment Ai = a for an individual given their covariates, vaccine-acceptance, and being in our analytic sample.
4.2.1 Outcomes
We use Y to denote any outcome considered in this section to ease notation, recalling that M1 and M2 are dichotomized for this analysis. Assume that there are N adults living in the United States. A natural estimand is the average treatment effect:
(1)
(1)
This reflects the mean difference in the prevalence of each outcome if everyone were vaccinated contrasted against the case where no one was vaccinated, averaging over the empirical covariate distribution of adults residing in the United States.
This causal quantity is difficult to target for at least four reasons. First, the U.S. adult population consists of two types of individuals: the vaccine-hesitant and the vaccine-accepting. The vaccine-hesitant constitute a group of “never-takers,” a group that would never choose be vaccinated (at least during this timeframe). We cannot estimate the treatment effect among this subgroup without strong modeling assumptions. Second, the sample is taken over the population of Facebook users who reside in the United States. This population differs from the U.S. adult population, the arguably more interesting population. Third, the average over the population of Facebook users is also difficult to credibly estimate, as survey response rates in February 2021 were approximately one percent. Unless we assume that survey nonresponse was completely random, we cannot estimate this quantity without further assuming, for example, that the selection process was based on pretreatment characteristics and then modeling this process. Finally, among the survey respondents, we only observe the vaccination status and outcomes among those who respond to these items. Similar to survey nonresponse, generalizing the causal effects to include these individuals requires additional assumptions and modeling.
We make several analytic choices to address these challenges. First, we condition our analysis among the vaccine-accepting population. Second, our primary estimands are conditional on our analytic sample. Specifically, we define our target estimand as:Footnote7
(2)
(2)
(3)
(3)
This estimand is the average expected difference in the prevalence of the outcomes given the empirical covariate distribution of the vaccine-accepting complete-cases in our analytic sample. We abbreviate this empirical average using moving forward. We also examine all effects on both the risk-ratio scale (
) and averaged within distinct subgroups defined by the covariates. In Appendix 2, supplementary materials we consider estimands that do not deterministically set vaccination status, but rather shift each individual’s probability of vaccination (Kennedy Citation2019).
4.2.2 Interventional Effects
We next decompose the effect of vaccinations on depression into four separate channels: a direct effect, an indirect effect through social isolation, an indirect effect through worries about health, and an indirect effect reflecting the dependence of social isolation and worries about health on each other, following (Vansteelandt and Daniel Citation2017):
As explained by Vansteelandt and Daniel (Citation2017), the interventional direct effect represents the contrast in mean potential outcomes when everyone is vaccinated versus no one is vaccinated, while drawing the mediators for each individual randomly from the joint distribution of the mediators conditional on A = 0 given their covariates X. By contrast the interventional indirect effect of M1
represents the average contrast between subject-specific draws from the counterfactual distribution of feelings of social isolation at
versus A = 1 given their covariates, while drawing worries about health from the counterfactual distribution under A = 0, given their covariates and fixing vaccination status at level
. The interventional indirect effect through M2
is defined analogously. The covariant effect
is the difference between the total effect and all three of these effects. This effect captures the effect of the dependence of the mediators on each other, and would be equal to zero, for example, if the mediators were conditionally independent. Finally, a similar decomposition holds switching 0 for 1 in each estimand and reversing the signs. We consider both decompositions in our analysis.
Vansteelandt and Daniel (Citation2017) describes as capturing the pathways
and
, with
defined analogously. This implies that
captures the effect of vaccinations on depression via directly changing social isolation which then affects depression; and via directly changing worries about health, which then affects social isolation which affects depression. By contrast,
would capture the effect of vaccinations on depression via direct changes in worries about health which affects depression, and via changes in social isolation which affect worries about health which affect depression. We refer to Vansteelandt and Daniel (Citation2017) for more details on this decomposition and the interpretation of these estimands.Footnote8
4.2.3 Other Estimands
In Appendix 2, supplementary materials we describe three other estimands: the effect of the observed distribution of vaccination, the effect of incremental interventions on the propensity score, and the effect of the pandemic on mental health. The first two estimands may correspond to more realistic interventions, requiring weaker identifying assumptions than those noted below. The third estimand may be of interest if we wish to use our effect estimates to learn about the impact of the COVID-19 pandemic on mental health. We show in Appendix 3, supplementary materials that under some assumptions, we may interpret simple functions of our average effect estimates on either the risk-differences or risk-ratio scale as a lower bound on this quantity using our existing estimates of the effect of COVID-19 vaccinations on mental health.
4.3 Identification
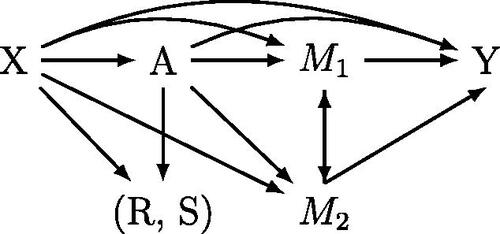
illustrates the causal structure assumed to hold among vaccine-accepting individuals, and clarifies assumptions about the causal ordering of the variables. Two particular features are worth noting: first, we assume no reverse causation between depression and the mediators. Second, we allow the mediators to depend on each other and require no assumptions about their causal ordering. also encodes the assumed relationships between the variables necessary to identify our causal estimands in terms of our observed data. We instead motivate these conditions using potential outcomes, and assume that for all values of :Footnote9
Fig. 4 Assumed causal structure.
Assumption 1
(No unmeasured confounding).
(4)
(4)
Assumption 2
(Y-M ignorability).
(5)
(5)
Specifically, no unmeasured confounding states that among the vaccine-accepting population, vaccinations are independent of the potential mediators and outcomes conditional on covariates. Y-M ignorability states that the mediators are jointly independent of potential outcomes conditional on covariates and vaccination status. Finally, we assume random sample selection: this states that survey response and complete-case indicators are independent of the potential outcomes given the covariates, vaccination status, and vaccine-acceptance.
Assumption 3
(Random sample selection).
(6)
(6)
We additionally assume that the survey responses fully capture all population relationships (“no measurement error”), that all vaccine-accepting individuals in our sample have a probability of vaccination bounded away from zero and one, and that the joint mediator probabilities are all bounded away from zero (“positivity”). We formalize all identifying assumptions in Appendix 3, supplementary materials and show that they imply that our causal parameters are identified in terms of the observed data. For example, . We largely defer discussing possible violations of these assumptions to Section 6.
4.4 Analytic Timeframe
We choose to limit our causal analysis to February 2021 to strengthen the credibility of our identifying assumptions. The challenge is that we only observe cross-sectional data, and the causal assumptions required for our analysis simplify a more complicated longitudinal process. Our identifying assumptions arguably become less tenable over time. As one example, consider a key unobserved variable: time since vaccination. Assuming no carryover effects implies that this variable is not required either to define or identify our causal estimands. Absent this assumption, time since vaccination would act as an unmeasured confounder inducing a bias for our outcomes analysis that plausibly increases with time from the first administered COVID-19 vaccines (we discuss this point further in Appendix 3, supplementary materials). Our mediation analysis similarly becomes less tenable over time: for example, vaccinations may improve economic conditions over time, which in turn may act as a post-treatment confounder with respect to feelings of social isolation or worries about health. We therefore limit our analysis to February, relatively soon after the start of COVID-19 vaccination administrations.
4.5 Estimation and Inference
We use influence-function based estimators throughout (Kennedy Citation2019; Benkeser and Ran Citation2021), requiring estimation of several nuisance functions. For example, for the interventional effects, we estimate the outcome model, the propensity score model, and the joint mediator probabilities. For our primary results we use logistic regression and multinomial logistic regression. We allow for separate models for each treatment level for our outcomes analysis, and each treatment-mediator level for our mediation analysis. Similarly, to estimate mediator probabilities we allow separate models within each treatment level. Our propensity score model includes only main effects for each covariate. These estimators are multiply robust in the sense that the consistency of the estimates do not require that all models are correctly specified, but rather that some subset are (Benkeser and Ran Citation2021). We generate 95% confidence intervals and conduct hypothesis tests using the empirical variance of our estimated influence function values and standard normal quantiles. These intervals and tests are valid if all of our models are correctly specified. To alleviate concerns about model misspecification, we also estimate all nuisance functions using XGBoost and sample-splitting. Assuming the consistency of the influence-function estimates and that that the nuisance functions are estimated at rates in the L2 norm, these estimates are asymptotically normal and root-n consistent with a simple expression for the variance (Benkeser and Ran Citation2021). Appendix 4, supplementary materials provides further details.
We also use a data-driven approach to identify subgroups with large or small treatment effects. Specifically, we estimate the influence function values using auxiliary data from March 1–14, 2021 using XGBoost. We regress these pseudo-outcomes on a subset of the demographic covariates using depth-four regression trees. After generating the trees, we use a “human-in-the-loop” approach to determine whether the candidate subgroups are interpretable and substantively interesting. We then conduct estimation and inference using on these candidate hypotheses using the February data.Footnote10 All t-tests referenced below set and only control the Type I error rate for each test marginally.
5 Results
5.1 Outcome Analysis
displays our primary results. We estimate comparable effect sizes for each outcome, including decreases of 3.7 (4.0, 3.5), 3.3 (3.5, 3.0), and 4.3 (4.6, 4.0) in the prevalence of depression, isolation, and worries about health, respectively. These effects translate to 19%, 16%, and 15% decreases in the prevalence of depression, social isolation and worries about health, respectively.Footnote11 displays our results when using XGBoost to estimate the nuisance functions. These estimates are quite similar to the GLM estimates.
Table 2 Effect estimates, GLM models (95% CI).
Table 3 Effect estimates, XGBoost models (95% CI).
5.2 Subgroup Heterogeneity: Pre-specified Groups
displays the estimated effects across pre-specified subgroups. Consistent with the unadjusted estimates, among those who reported their age, vaccinations have the largest magnitude effect sizes among respondents between 18 and 34 years old for all outcomes. For example, we estimate that vaccinations changed the probability of depression by –5.9 (–6.8, –5.0) percentage points among respondents aged 18–34, while only –2.5 (–2.8, –2.2) percentage points among respondents aged 65 and older. We also find larger magnitude point estimates for females relative to males and non-binary respondents for depression. Specifically, we estimate the effect of vaccinations on depression as being –4.0 (–4.3, –3.7) percentage points among female identifying respondents and –3.1 (–3.5, –2.7) among male and non-binary respondents. Lastly, we see larger magnitude effect estimates among respondents for worries about health among respondents with two or more high-risk health conditions (–4.8 (–5.3, –4.3)) relative to those with none (–3.7 (–4.2, –3.2)).Footnote12
Fig. 5 Outcomes analysis, February 2021.
The XGBoost estimates are very similar. These results and results on the risk-ratio scale are available in Appendix 5.2, supplementary materials.
5.2.1 Data-Driven Subgroup Heterogeneity
We identify three possibly heterogeneous subgroups using the March data with respect to depression: respondents aged 18–24, non-Hispanic respondents aged 25 and older, and Hispanic respondents aged 25 and older. These categories exclude non-respondents who to age, or to ethnicity among those 25 or older. displays the effect sizes and confidence intervals estimated on the February data.Footnote13 Consistent with our hypotheses, we estimate effects of –12.2 (–13.7, –10.7) among respondents aged 18–24, –3.6 (–3.8, –3.3) among non-Hispanic respondents aged 25 or older, and –1.9 (–2.6, –1.2) among Hispanic respondents aged 25 or older. The youngest respondents also appear to have larger magnitude treatment effects for isolation and worries about health.Footnote14
Fig. 6 Data-driven subgroup estimates.
We examine additional subgroups within these three primary groups. Among respondents aged 18–24, we estimate larger magnitude effect sizes among those who live with an elderly individual (–21.6 (–26.5, –16.8); N 2,542) versus those who do not (–10.9 (–12.7, –9.2); N = 20,347). We estimate effects for depression and isolation that are statistically indistinguishable from zero among Hispanic respondents whose primary Facebook user language is Spanish (N = 23,018). By contrast, all estimated effect sizes are statistically significant and negative for those whose Facebook user language is English (N = 57,236).Footnote15 We test for differences with respect to gender and race among respondents aged 18–24, and with respect to age among Hispanic respondents aged 25 or older. We find statistically significant differences with respect to race among the youngest respondents for isolation and worries about health: the effect sizes appear smaller in magnitude for non-White versus White respondents. However, our remaining hypotheses do not yield any statistically significant and substantively meaningful differences on the risk-differences scale.
Finally, we identify candidate heterogeneous subgroups using isolation and worries about health as the outcomes. Beyond the previously noted heterogeneity with respect to age, we are largely unable to confirm additional sources of heterogeneity. One exception is with respect to gender among non-White respondents aged 25 or older: we estimate that female identifying respondents had larger magnitude effects with respect to social isolation (–3.2 (–4.0, –2.5)) than non-female identifying respondents (–1.5 (–2.4, –0.7)). Additional results may be found in Appendix 5.2, supplementary materials.
Our results reveal that being aged 18–24 is a key source of effect heterogeneity, especially with respect to depression and social isolation. Moreover, living with an elderly individual appears to have a strong interaction effect among this same group. These patterns also hold on the risk-ratio scale (see Appendix 5.2, supplementary materials). Additional research would be valuable to further investigate hypotheses with respect to other demographic characteristics, including interactions between age, race, gender, and ethnicity, though our results suggest that age would likely remain the factor most strongly associated with effect heterogeneity.
5.3 Mediation Analysis
displays results from our mediation analysis. The left-hand panels displays results on the risk-differences scale while the right hand displays each estimate as a proportion of the total effect. We estimate that shifting the distribution of social isolation from what it would have been if everyone were unvaccinated to a world where everyone were vaccinated would reduce depression by 1.5 (1.6, 1.4) percentage points, while shifting the distribution of worries about health similarly reduces depression by approximately 0.3 (0.3, 0.3) percentage points. These effects would account for 39.1% and 8.3% of the total effect of vaccinations on depression, respectively. We estimate the covariant effect to be close to zero. also displays the total indirect effect by both pathways, simply the sum of these three effects. We reject the null hypothesis that the mediated effects through isolation are equal to the mediated effects through health (p < 0.001). The effects are comparable when changing the reference category in the estimands (see Appendix 5.3, supplementary materials).
Fig. 7 Mediation analysis: primary estimates.
We also find evidence of a direct effect of vaccination on depression that accounts for over half of the total effect. We interpret this as reflecting a general sense of relief that vaccination provides, perhaps related to a belief in a return to normalcy.
displays estimates of the proportion mediated across pre-specified subgroups.Footnote16 The patterns are consistent, with social isolation appearing to account for a larger proportion of the mediated effect relative to worries about health across all groups. Perhaps not surprisingly, worries about health appear to account for a slightly greater percentage of the total effect among people with two or more high-risk health conditions compared to those with none (though we do not formally test the statistical significance of these differences). The XGBoost results are similar. Additional results are available in Appendix 5.3, supplementary materials.
Fig. 8 Mediation heterogeneity: proportion mediated by subgroup.
6 Sensitivity, Robustness, and Limitations
We consider the sensitivity of our analyses to our causal assumptions, their robustness to alternative analytic choices, and our ability to generalize our effect estimates. We highlight the limitations of our analysis throughout, and provide heuristic arguments about how violations of our causal assumptions may bias our estimates. We conclude that our outcomes analysis is fairly robust, and that most possible violations likely bias our estimates toward rather away from zero. We also argue that generalizing the effect magnitudes of our estimates beyond our sample is not unreasonable. Finally, we discuss the limitations of our mediation analysis; however, we do not conduct formal sensitivity analyses.
6.1 Unobserved Confounding and Selection Bias
6.1.1 Sensitivity Analysis
Our outcomes analysis assumes no unmeasured confounding and random sample selection. Together these assumptions imply that the potential outcomes are independent of treatment assignment given covariates and vaccine-acceptance on our analytic sample. This implication may be violated if either assumption fails. We can relax these assumptions to instead obtain bounds on our target estimand via a variation of a sensitivity analysis proposed by Luedtke, Diaz, and van der Laan (Citation2015). Let . We then assume there exists a τ satisfying (7).
(7)
(7)
For example, consider the left-hand side of (7) and let a = 1 and . The bound specifies that within each covariate stratum, the counterfactual probability of depression among unvaccinated survey respondents when vaccinated is not greater than
times the observed probability of depression among the vaccinated survey respondents. In Appendix 6, supplementary materials, we show that (7) implies a bound on the treatment effect using only functions of the observed data and τ. We then use influence-function based estimators to estimate bounds across a range of values of τ until we find values that could explain away our estimated effects.
We find that values of τ greater than or equal to 0.18, 0.15, and 0.14 would explain away our effect estimates for depression, isolation, and worries about health, respectively. In other words, the upper bound estimates would be statistically indistinguishable from zero if the ratios in (7) fell outside of the (approximate) ranges of [0.83, 1.20], [0.86, 1.16], or [0.87, 1.15] for each respective outcome.Footnote17 As a point of comparison, assume that no unmeasured confounding on the complete-cases held when controlling for the full covariate set, but that we controlled for none of them. This would yield values of τ of approximately 0.34, 0.27, and 0.26 for each respective outcome.Footnote18 Our average effect estimates are therefore robust to confounding variables that are approximately 53 to 55% (e.g., 0.18/0.34 for depression) as associative with the outcomes as the entire observed covariate set, suggesting that our results are at least somewhat robust to these assumptions.
This analysis is quite conservative: for example, the bounds consider cases where the biases work in opposite directions with respect to μ1 and μ0. However, the biases may work in the same direction. For example, if for all values of x, then then our estimates of the causal risk-differences would remain unbiased, despite biased estimates of the prevalence of each potential outcome in our sample.
6.1.2 Heuristic Reasoning: No Unmeasured Confounding
We can also reason about the sign of the bias induced by violations of no unmeasured confounding at the population level. Two specific confounders we may worry about are vaccine-access and motivation to be vaccinated. We attempt to control for vaccine-access using a variety of county-level characteristics, the respondents’ geographical location, employment status, and financial stress. However, these covariates may not sufficiently capture differential access across respondents. Similarly, vaccine-acceptance acts as a rough proxy for motivation. Yet even among vaccine-accepting respondents, some likely have higher motivation to be vaccinated than others. We reason that failing to control for these variables likely induces biases that work in opposite directions, resulting in an overall bias with no clear sign.
For example, if within every covariate stratum, the probability of being vaccinated is lower for respondents with worse access, and the probability of being depressed, isolated, or worried about health is higher for these same respondents, our estimates will be negatively biased. On the other hand, if motivated respondents are more likely to be vaccinated, and more likely to be depressed, isolated, or worried about their health generally, our estimates will be positively biased. Our data is consistent with these hypotheses: when running our analyses without controlling for financial stress, employment status, or occupation, our point estimates move further away from zero (see also Section 6.4). On the other hand, when including the vaccine-hesitant in our analytic sample, our estimates move closer to zero (see Table 33 in Appendix 7, supplementary materials). The total bias induced by these unmeasured confounders therefore has no clear sign.
6.2 Generalizability
Assuming that our estimates among this sample of CTIS respondents are valid, or more weakly that the magnitude of the effect estimates is correct, we may wish to infer similar magnitude effects among all U.S. adults. Skepticism is warranted for several reasons. First, CTIS respondents differ from the general US population across several characteristics. For example, Daly, Jones, and Robinson (Citation2021) found that the CTIS survey over represents White individuals, those with higher education, and those who have received COVID-19 vaccinations (see also Bradley et al. Citation2021). Second, our estimates may be subject to selection-bias: even if we knew the true sample estimand, if sample selection were based on the potential or realized outcomes, these effects may not generalize to a population of non-CTIS respondents with identical covariates. Finally, our estimates make no claims about the vaccine-hesitant, which is a substantial portion of the U.S. population (King et al. 2020).
While caution is certainly warranted, we nevertheless argue that these concerns should not entirely prohibit generalizations from our study. First, assume that our conditional effect estimates are valid. Despite our sample’s non-representative covariate distribution, we do not find evidence of substantial sources of effect heterogeneity beyond age. Averages over other mixes of vaccine-accepting populations are therefore plausibly similar. Second, sample selection may in truth be a function of the observed or potential outcomes. However, this does not imply our estimates are invalid: our sample may not be representative of the prevalence of the potential outcomes, but may still be representative of the risk-differences. Third, if we wished to generalize across a population that includes a vaccine-hesitant subset, we can simply assume that there is no treatment effect on average in this subgroup. As long as the vaccine-hesitant comprise a minority of the target population, similar magnitude effect sizes may therefore hold.Footnote19
Such generalization may still strike some as implausible. We may instead wish to consider the more limited goal of generalizing our estimates beyond the complete-cases to the entire vaccine-accepting CTIS sample. We also run this analysis and find that our estimated effect sizes are similar to our primary analysis (see Appendix 7, supplementary materials).
6.3 Interference, Carryover, and Anticipatory Effects
Our analysis makes three restrictions on the dependence of the potential outcomes across individuals and over time: SUTVA, no carryover effects, and no anticipatory effects. While violations of these assumptions are possible, we believe that such violations likely bias our effect estimates toward zero.
First consider violations of SUTVA. If the effect of receiving a COVID-19 vaccination depends on the vaccination status of other individuals in the population, then we must redefine our causal estimand. First, assume that these dependencies are limited to communities of individuals, which we index from . For simplicity, assume that each community has a fixed number of individuals p, and that
. We can then define the following terms: let
represent a random vector of vaccination statuses for all individuals in a community c, omitting the index ci, and let
be the average number of vaccinated individuals in the random vector
. Finally, let
be a vector of
ones and
be a vector of
zeros (omitting the cith index), so that, for example,
.
Consider the following estimand:
(8)
(8)
This formalizes the difference in rates of depression in a world where everyone is vaccinated versus a world where no one is vaccinated, allowing each individual’s potential outcomes to depend on everyone else’s vaccination status within their community. We can then consider how well have we estimated ϑ. Consider the model:
(9)
(9)
EquationEquation (9)(9)
(9) implies that
. This estimand captures both a direct effect of vaccinations, captured by
, and an indirect effect captured by
. Assume that for all x,
– that is, that both the direct and indirect effects of vaccination are negative within all covariate strata. To make these assumptions concrete, consider depression as the outcome. These assumption would be reasonable if (1) vaccinations induce people to socialize, and socializing decreases depression, and (2) socializing increases with the number of vaccinated individuals within communities.
However, our estimates are not based on (9), but instead on the model:
(10)
(10)
Our estimators therefore target the biased quantity . The omitted variable bias formula implies that this estimand is positively biased with respect to ϑ.Footnote20 Whether ϑ is the correct target of inference, or whether these assumptions are realistic is debatable. Nevertheless, this logic provide justification for believing that SUTVA violations would bias our effect estimates toward, rather than away, from zero.Footnote21
We also assume no carryover effects, precluding the potential outcomes from depending on the time since receipt of vaccination. Were this violated, time since vaccination would essentially be a confounder that is positively associated with the observed treatment assignment indicator. Assuming that the effects of COVID-19 vaccinations on mental health monotonically diminish over time on average within each covariate stratum, violations of no carryover effects would bias our estimates toward zero. Finally, we assume no effects in anticipation of receiving the vaccine. If anticipatory effects were to improve mental health on average in our sample, violations would again bias our effect estimates toward zero. In short, violations of SUTVA, no carryover effects, and no anticipatory effects most plausibly bias our effect estimates toward zero.
6.4 Bad Controls
So-called “bad controls” may also bias our effect estimates (Angrist and Pischke Citation2009). We argue that these biases again plausibly move our estimates toward zero.
Specifically, we control for occupation, employment status, and worries about finances. These variables are associated with vaccine-access, and—as noted above—failing to control for such variables likely induces a negative bias in our effect estimates. However, COVID-19 vaccinations may also affect these variables, meaning that they act as a mediator on the causal pathway from , and are therefore “bad controls.” We argue that such effects were weak in February 2021: acquiring or switching job can take considerable time, and everyone in our sample was vaccinated for at most three months. Additionally, any bias induced by over-controlling is likely positive. For example, COVID-19 vaccinations likely boosted economic activity in aggregate and increased employment. This would then likely reduce financial stress and the associated mental health burdens. Controlling for variables along this causal pathway therefore likely results in positive bias.
We examine these hypotheses in our data by rerunning our analyses without controlling for worries about finances, occupation, or employment status. Our point estimates move further away from zero (see Table 34 in Appendix 7, supplementary materials). This is consistent with either over-controlling moving our point estimates closer to zero, or a negative bias induced by failing to control for these variables. Because we prefer our estimates to be biased toward zero we therefore control for these variables.
6.5 Measurement Error
Measurement error may also bias our estimates. For example, our data is self-reported, and may be subject to reporting bias. Relatedly, we assume no unmeasured confounding assumption conditional on X, which includes both observed covariate values and categories for missing data. The unobserved values of these covariates may act as unmeasured confounders. We are unable to fully address these issues. However, as one robustness check we run our analysis while excluding respondents who provide implausible or unreasonable answers. For example, several respondents indicate that they live with a negative number of other individuals. Following Bilinski et al. (Citation2021), we consider a variety of implausible answers to our questions and omit these responses when running our analysis, removing 15,762 complete-cases. All results are consistent with our primary analyses and are available in Appendix 7, supplementary materials.
6.6 Mediation Analysis
The validity of our mediation analysis requires strong assumptions. For example, our model precludes a possible pathway through which COVID-19 vaccinations might affect depression: through household finances (Wilson Citation2020; Berkowitz and Basu Citation2021). Our analysis instead assumes that vaccinations do not affect depression by changing finances. This assumption may not strictly hold: at an individual level, receipt of a COVID-19 vaccination might induce the previously unemployed to seek employment, which might then change one’s finances. At an aggregate level, mass distribution of COVID-19 vaccinations may have boosted economic activity, which may affect any individual’s employment status and therefore finances. As noted in Section 4.4, this is one reason we limit our analysis to February, a timeframe when such effects are plausibly negligible.
Our analysis also requires that there exist no other post-treatment effects of vaccination that confound the mediator-outcome relationship. For example, we interpret the direct effect as reflecting the general feelings associated with a return to normalcy. Our analysis requires that this feeling does not cause social isolation or worries about health. However, causal arrows may exist from social isolation or worries about health to this variable. In this case both the direct and indirect pathways capture effects from this variable.Footnote22 These conditions and interpretations hold for any other hypothesized pathway between COVID-19 vaccines and depression.
Finally, the interventional effects are not robust to reverse causation with respect to Y. We must therefore interpret these results cautiously. While we do not conduct a sensitivity analysis with respect any of these assumptions, we compute all of the robustness checks noted previously and find comparable results.
7 Discussion
We provide evidence that COVID-19 vaccinations reduced feelings of depression and anxiety, social isolation, and worries about health among vaccine-accepting CTIS respondents in February 2021. Our results imply that the prevalence of each outcome would have been reduced by 3.7, 3.3, and 4.3 percentage points, respectively, in a world where everyone was vaccinated against COVID-19 contrasted against a world where no one was vaccinated during February 2021. These estimates translate to 19%, 16%, and 15% reductions in the prevalence of each respective outcome. We also examine effects by both pre-specified and data-driven subgroups. We observe substantial heterogeneity with respect to age, with younger age groups having larger magnitude effect sizes. Our estimates on the risk-ratio scale suggest that some of this heterogeneity may be driven by differences in base rates of each outcome by age group. However, on both the risk-differences and risk-ratio scales, we find that the total effects on each outcome are strongest among respondents aged 18–24 relative to older respondents, with particularly large effects on depression and isolation among those living with an elderly individual. We also observe that those with multiple high-risk health conditions appear to have slightly larger point estimates with respect to worries about health. Our average effect estimates are moderately robust to violations to our causal assumptions and analytic choices, and we argue that many violations would tend to bias our effect estimates toward zero on the risk-differences scale. Finally, while our estimates pertain only to our sample of CTIS respondents, we argue that inferring similar magnitude effect sizes beyond our sample may not be unreasonable.
We conclude by positing a model where vaccinations affect depression through social isolation and worries about health. We then decompose the total effect into a direct effect and indirect effects via interventions on the distribution of social isolation and worries about health while holding vaccination status fixed. We find that the interventional indirect effect via social isolation is larger in absolute magnitude than the interventional indirect effect via worries about health. We find evidence of a direct effect that accounts for approximately half of the total effect on depression, which we interpret as reflecting a pathway via a perceived return to normalcy (see also Agrawal et al. Citation2021). These patterns are broadly consistent across our pre-specified subgroups.
Our study has several implications. First, we find especially large effect sizes among respondents aged 18–24. These results complement findings that the pandemic had particularly negative effects on younger individuals (Santomauro et al. Citation2021; Sojli et al. Citation2021), and suggest that COVID-19 vaccinations may have undone some of these effects, at least temporarily. Second, our results suggest that effects on social isolation play a larger mediating role than effects on worries about health in explaining the effect of COVID-19 vaccinations on depression. Finally, our results complement and support the findings from other studies documenting and understanding this unintended beneficial outcome of COVID-19 vaccinations with respect to mental health (Perez-Arce et al. Citation2021; Agrawal et al. Citation2021). For policy-makers seeking to alleviate the mental health burden of the pandemic, our results suggest targeting interventions that reduce feelings of social isolation, particularly among younger individuals.
We conclude with three notes of caution. First, our results rely on strong causal assumptions. Second, our primary statistical target of inference is the treatment effect on a subset of vaccine-accepting CTIS-respondents, and not the U.S. population more broadly. Finally, the CTIS measure of depression and anxiety does not assess clinical criteria for mental disorders. Our measure, like those used in other studies, likely captures a broad range of psychological distress and demoralization than would be considered a clinically significant disorder, and our findings may reflect improvements in mental health status in a non-clinical range of severity (Murphy Citation1986; Tecuta et al. Citation2015). For instance, symptoms of demoralization, such as helplessness, may be more responsive to the introduction of a vaccine than symptoms of major depression, such as anhedonia (Wellen Citation2010). While the results indicate improvements in mental health status, these results should not be interpreted as indicating that COVID-19 vaccinations had an impact on clinical disorders comparable to the impact of psychotherapy or antidepressant medication. Regardless, future work should continue to study mental health during the pandemic to seek to better understand the extent of the challenges people are facing and to design policies that can help alleviate suffering, particularly among society’s most vulnerable populations.
Supplementary Materials
Appendices: this supplement consists of appendices containing additional summary statistics; details about the causal estimands, identifying assumptions, and estimation strategy; additional results; details on the sensitivity analyses; and robustness checks.
Supplemental Material
Download Zip (691.7 KB)Acknowledgments
The authors gratefully acknowledge invaluable advice from discussions with Vinni Bhatia, Nate Breg, David Choi, Riccardo Fogliato, Joel Greenhouse, Edward Kennedy, Samantha Patel, Alex Reinhart, and Robin Mejia.
Notes
1 This period encompasses both CTIS waves 7 and 8. Wave 8 was deployed on February 8, 2021, and incorporated changes to some of the questions we use as covariates. These include the addition of categories to the chronic health conditions and occupation questions, and changing a question on the previous receipt of flu vaccine to be defined from July 2020 instead of June 2020.
2 We recode the response “I don’t know” to be grouped with people who indicated they did not already receive a COVID-19 vaccine.
3 The CTIS questions specifically are “In the past five days, how often have you felt isolated from others?” and “How worried are you that you or someone in your immediate family might become seriously ill from COVID-19 (coronavirus disease)?”
4 Similar patterns were observed in other surveys: for example, an Economist/YouGov poll showed similar age patterns with respect to worries about contracting COVID-19. Clair et al. (Citation2021) also found higher levels of social isolation among younger individuals.
6 As has been observed elsewhere, the CTIS over-represents vaccinated individuals compared to the U.S. population (Salomon et al. Citation2021). This does not necessarily threaten the internal validity of our analysis (see Section 4.3), though may threaten our ability to generalize our results.
7 This expression slightly simplifies of our true targeted estimand. As we explain in Section 3, we also remove those with missing FIPS code information and those who live in Alaska.
8 We caution that recent results from Miles (Citation2022) casts doubt on mechanistic interpretations of interventional effects.
9 The conditions in the DAG are necessary, but not sufficient for our identification result (see Appendix 3, supplementary materials). For example, the DAG implies that , while we instead invoke Assumption 3. Identification under alternative conditions is possible.
10 This is similar to the “honest” tree-based estimation approach proposed by Athey and Imbens (Citation2016), and is an example of a DR-learner, discussed in Kennedy (Citation2020)
11 As noted in Appendix 3, supplementary materials, we may interpret these results as bounding the effect of the pandemic on depression. For example, under some assumptions we can say that the pandemic increased depression by at least 3.7 percentage points on average, and that the percentage of depressed respondents was at least 24% higher on average (100*()) than it would have been absent the pandemic among respondents in our analytic sample.
12 Our estimates are somewhat large in magnitude among respondents who do not provide demographic information. For example, among those who did not respond about their age, we estimate a –5.8 (–7.2, –4.3) percentage point reduction in depression and a –7.3 (–8.9, –5.6) reduction in worries about health. Because nonresponse is highly correlated across questions, we observe similar magnitude estimates for other nonresponse categories, though the point estimates for isolation tend to be comparable to other groups.
13 We present estimates using our XGBoost models: our GLM estimates do not include interactions between the covariates, and are therefore unlikely to correctly capture this heterogeneity.
14 We display significance levels associated with the pairwise t-tests in Appendix 5.2, supplementary materials.
15 The differences in the estimated effects are both statistically significant at the level.
16 We excluded Asian and Pacific Islander and Other racial categories as the estimates are very imprecise.
17 The results using the XGBoost models are virtually identical.
18 These values reflect cases where the observed covariates are assumed to deconfound the relationship on the observed sample. This does not account for scenarios where bias is induced by selection on the observed or potential outcomes.
19 As a more formal analysis, in Appendix 6, supplementary materials we extend the previous sensitivity analysis to evaluate how our effects might generalize across a population with the same covariate distribution as our sample but include entirely cases where RS = 0. This analysis suggests that our ability to generalize our estimates may be weak; however, it is also very conservative.
20 To see this, consider the model:
(11)
Within each covariate stratum the bias of our target quantity relative to our target is equal to . The sample average of this bias across all covariate strata is greater than zero:
for all x by assumption, and
by the definition of
. As long as vaccinations aren’t perfectly correlated within every community, there exists some
in our sample where
, implying positive bias.
If vaccinations were independently assigned, , and
would correctly capture the direct effects of vaccination on the outcomes (but not the total direct and indirect effects). The sign of the bias of the direct effect is unclear and depends on
.
21 Agrawal et al. (Citation2021) attempt to estimate spillover effects by examining whether increases in community vaccination rates improve depression and anxiety symptoms among the unvaccinated population. They are unable to find evidence that this is the case, providing some empirical evidence that we may need not worry about SUTVA violations affecting our estimates.
22 Perez-Arce et al. (Citation2021) speculate that in addition to worries about health and social isolation, “different work opportunities” is a possible pathway through which COVID-19 vaccines may affect depression. While this pathway is related to household finances, worries about household finances could remain the same while one’s employment status may plausibly differ. More broadly our analysis rules out any pathways via employment changes. Limiting our analysis to February again mitigates potential bias if we think people are unlikely to change their employment within a short-time frame after being vaccinated.
References
- Agrawal, V., Cantor, J. H., Sood, N., and Whaley, C. M. (2021), “The Impact of the Covid-19 Vaccine Distribution on Mental Health Outcomes,” Technical Report, National Bureau of Economic Research.
- Angrist, J. D., and Pischke, J.-S. (2009), Mostly Harmless Econometrics: An Empiricist’s Companion, Princeton: Princeton University Press.
- Athey, S., and Imbens, G. (2016), “Recursive Partitioning for Heterogeneous Causal Effects,” Proceedings of the National Academy of Sciences, 113, 7353–7360. DOI: 10.1073/pnas.1510489113.
- Benkeser, D., and Ran, J. (2021), “Nonparametric Inference for Interventional Effects with Multiple Mediators,” Journal of Causal Inference, 9, 172–189. DOI: 10.1515/jci-2020-0018.
- Berkowitz, S. A., and Basu, S. (2021), “Unemployment Insurance, Health-Related Social Needs, Health Care Access, and Mental Health during the Covid-19 Pandemic,” JAMA Internal Medicine, 181, 699–702. DOI: 10.1001/jamainternmed.2020.7048.
- Bilinski, A., Emanuel, E., Salomon, J. A., and Venkataramani, A. (2021), “Better Late than Never: Trends in Covid-19 Infection Rates, Risk Perceptions, and Behavioral Responses in the USA,” Journal of General Internal Medicine, 36, 1825–1828. DOI: 10.1007/s11606-021-06633-8.
- Bradley, V. C., Kuriwaki, S., Isakov, M., Sejdinovic, D., Meng, X.-L., and Flaxman, S. (2021), “Unrepresentative Big Surveys Significantly Overestimated US Vaccine Uptake,” Nature, 600, 695–700. DOI: 10.1038/s41586-021-04198-4.
- Breslau, J., Finucane, M. L., Locker, A. R., Baird, M. D., Roth, E. A., and Collins, R. L. (2021), “A Longitudinal Study of Psychological Distress in the United States before and during the Covid-19 Pandemic,” Preventive Medicine, 143, 106362. DOI: 10.1016/j.ypmed.2020.106362.
- Clair, R., Gordon, M., Kroon, M., and Reilly, C. (2021), “The Effects of Social Isolation on Well-Being and Life Satisfaction during Pandemic,” Humanities and Social Sciences Communications, 8, 28. DOI: 10.1057/s41599-021-00710-3.
- Corbett, G. A., Milne, S. J., Hehir, M. P., Lindow, S. W., and O’connell, M. P. (2020), “Health Anxiety and Behavioural Changes of Pregnant Women during the Covid-19 Pandemic,” European Journal of Obstetrics, Gynecology, and Reproductive Biology, 249, 96–97. DOI: 10.1016/j.ejogrb.2020.04.022.
- Daly, M., Jones, A., and Robinson, E. (2021), “Public Trust and Willingness to Vaccinate against Covid-19 in the US from October 14, 2020, to March 29, 2021,” JAMA, 25, 2397–2399. DOI: 10.1001/jama.2021.8246.
- Glober, N., Mohler, G., Huynh, P., Arkins, T., O’Donnell, D., Carter, J., and Ray, B. (2020), “Impact of Covid-19 Pandemic on Drug Overdoses in Indianapolis,” Journal of Urban Health, 97, 802–807. DOI: 10.1007/s11524-020-00484-0.
- Gonçalves, P. A., Zuanazzi, A. C., Salvador, A. P., Jaloto, A., Pianowski, G., and de Carvalho F. L. (2020), “Preliminary Findings on the Associations between Mental Health Indicators and Social Isolation during the Covid-19 Pandemic,” Archives of Psychiatry and Psychotherapy, 22, 10–19. DOI: 10.12740/APP/122576.
- Kawohl, W., and Nordt, C. (2020), “Covid-19, Unemployment, and Suicide,” The Lancet Psychiatry, 7, 389–390. DOI: 10.1016/S2215-0366(20)30141-3.
- Kennedy, E. H. (2019), “Nonparametric Causal Effects based on Incremental Propensity Score Interventions,” Journal of the American Statistical Association, 114, 645–656. DOI: 10.1080/01621459.2017.1422737.
- Kennedy, E. H. (2020), “Towards Optimal Doubly Robust Estimation of Heterogeneous Causal Effects,” arXiv preprint arXiv:2004.14497.
- King, W. C., Rubinstein, M., Reinhart, A., and Mejia, R. (2021), “Covid-19 Vaccine Hesitancy January-May 2021 among 18–64 Year old us Adults by Employment and Occupation,” Preventive Medicine Reports, 24, 101569. DOI: 10.1016/j.pmedr.2021.101569.
- Luedtke, A. R., Diaz, I., and van der Laan, M. J. (2015), “The Statistics of Sensitivity Analyses,” Working Paper 341, U.C. Berkeley Division of Biostatistics Working Paper Series (October 2015). https://biostats.bepress.com/ucbbiostat/paper341
- Miles, C. H. (2022), “On the Causal Interpretation of Randomized Interventional Indirect Effects,” arXiv preprint arXiv:2203.00245.
- Murphy, J. M. (1986), “Diagnosis, Screening, and ‘Demoralization’: Epidemiologic Implications,” Psychiatric Developments, 4, 101–133.
- Perez-Arce, F., Angrisani, M., Bennett, D., Darling, J., Kapteyn, A., and Thomas, K. (2021), “Covid-19 Vaccines and Mental Distress,” PloS One, 16, e0256406. DOI: 10.1371/journal.pone.0256406.
- Pfefferbaum, B., and North, C. S. (2020), “Mental Health and the Covid-19 Pandemic,” New England Journal of Medicine, 383, 510–512. DOI: 10.1056/NEJMp2008017.
- Robb, C. E., de Jager, C. A., Ahmadi-Abhari, S., Giannakopoulou, P., Udeh-Momoh, C., McKeand, J., Price, G., Car, J., Majeed, A., Ward, H., et al. (2020), “Associations of Social Isolation with Anxiety and Depression During the Early Covid-19 Pandemic: A Survey of Older Adults in London, UK,” Frontiers in Psychiatry, 11, 591120. DOI: 10.3389/fpsyt.2020.591120.
- Salomon, J. A., Reinhart, A., Bilinski, A., Chua, E. J., La Motte-Kerr, W., Rönn, M. M., Reitsma, M. B., Morris, K. A., LaRocca, S., Farag, T. H., et al. (2021), “The US Covid-19 Trends and Impact Survey: Continuous Real-Time Measurement of Covid-19 Symptoms, Risks, Protective Behaviors, Testing, and Vaccination,” Proceedings of the National Academy of Sciences, 118, e2111454118. DOI: 10.1073/pnas.2111454118.
- Santomauro, D. F., Mantilla Herrera, A. M., Shadid, J., Zheng, P., Ashbaugh, C., Pigott, D. M., Abbafati, C., Adolph, C., Amlag, J. O., Aravkin, A. Y., et al. (2021), “Global Prevalence and Burden of Depressive and Anxiety Disorders in 204 Countries and Territories in 2020 Due to the Covid-19 Pandemic,” The Lancet, 398, 1700–1712. DOI: 10.1016/S0140-6736(21)02143-7.
- Sojli, E., Tham, W. W., Bryant, R., and McAleer, M. (2021), “Covid-19 Restrictions and Age-Specific Mental Health—us Probability-based Panel Evidence,” Translational Psychiatry, 11, 1–7. DOI: 10.1038/s41398-021-01537-x.
- Tecuta, L., Tomba, E., Grandi, S., and Fava, G. A. (2015), “Demoralization: A Systematic Review on its Clinical Characterization,” Psychological Medicine, 45, 673–691. DOI: 10.1017/S0033291714001597.
- Vansteelandt, S., and Daniel, R. M. (2017), “Interventional Effects for Mediation Analysis with Multiple Mediators,” Epidemiology (Cambridge, Mass.), 28, 258–265. DOI: 10.1097/EDE.0000000000000596.
- Wellen, M. (2010), “Differentiation between Demoralization, Grief, and Anhedonic Depression,” Current Psychiatry Reports, 12, 229–233. DOI: 10.1007/s11920-010-0106-x.
- Wilson, J. M., Lee, J., Fitzgerald, H. N., Oosterhoff, B., Sevi, B., and Shook, N. J. (2020), “Job Insecurity and Financial Concern during the Covid-19 Pandemic are Associated with Worse Mental Health,” Journal of Occupational and Environmental Medicine, 62, 686–691. DOI: 10.1097/JOM.0000000000001962.