
 ?Mathematical formulae have been encoded as MathML and are displayed in this HTML version using MathJax in order to improve their display. Uncheck the box to turn MathJax off. This feature requires Javascript. Click on a formula to zoom.
Abstract
According to the 2020 US Census more than 60% of the US population lives in towns with fewer than 50,000 residents, yet this is not in proportion with the research and public data surrounding policing, which focus on large and dense urban areas. One reason for this disparity is that studying small-town police departments presents unique obstacles. We present some of the challenges that we have encountered in studying small-town police activity such as data availability, quality, and identifiability, and our solutions to these challenges using computational tools. Finally, we give our recommendations in getting involved in this space based on our efforts to-date.
Disclaimer
As a service to authors and researchers we are providing this version of an accepted manuscript (AM). Copyediting, typesetting, and review of the resulting proofs will be undertaken on this manuscript before final publication of the Version of Record (VoR). During production and pre-press, errors may be discovered which could affect the content, and all legal disclaimers that apply to the journal relate to these versions also.1 Introduction
According to the 2020 census, roughly 60% of the US population lives in towns with fewer than 50,000 people [43], yet the overwhelming majority of data and scholarship related to policing is focused on large cities. While crime and police violence in urban area receives most of the attention from scholars and mainstream media, the need for research on small-town policing has never been greater. Not only has the rate of fatal police shootings steadily increased in rural areas over the last decade, but according to an analysis of the FBI Uniform Crime Reports of 2013, the rate of fatal police shootings per criminal homicide increases sharply as town size decreases [32]. The history of policing in the United States is wrought with abuses of power, and recent events have acutely highlighted the need for oversight and transparency in policing. Since the high-profile murder of George Floyd in 2020, there have been widespread calls for police reform, but lack of data has been a considerable bottleneck in translating these calls to action into concrete policies and recommendations [29].
With the goal of enabling citizens to hold their governments accountable, the federal Freedom of Information Act (FOIA) codifies the rights of the general public to access data on their governance, including policing. While access to such data is legally guaranteed, significant challenges exist in acquiring and using it. In small and under-resourced towns, infrastructure and personnel constraints make data collection even more difficult which places additional burdens on researchers, activists, and policymakers who want to understand the shape of policing in their town. Official FOIA requests must be made and often require persistence and legal expertise to be successful. Once the data are obtained, further technical skills may be needed to process, understand, and draw meaningful insights from them. For these reasons transparency in policing is often limited to the data requested and aggregated by highly-resourced groups.
With few exceptions, detailed policing data are not required to be collected and reported by police departments. However, motivated to rectify racial disparities in traffic stops, California, Rhode Island, and Illinois have enacted laws to gather and analyze traffic stop data. Each of these states produces a summary report and shares data tables publicly, however, the utility of the data are limited. Data are summarized and aggregated by department, demographics, and stop conditions. In many cases, this does not allow detailed study across multiple factors which may be of particular importance in policing, for example, analyzing race of stopped drivers by officer. Detailed, incident-level data are more rare, but are available in some states. Data are organized and downloadable for traffic stops in Connecticut from 2013-present [11]. In New Jersey, use of force data for 2012-2016 can be explored in Force Report [9], a user-friendly dashboard. Raw data, however, are behind a cost-prohibitive paywall [10]. Even in these cases where data collection is legally mandated, distribution and access at the granular level is not guaranteed.
Starting in 1996, the National Crime Victimization Survey has included a supplement called the “Police-Public Contact Survey” [38]. This survey includes a nationally representative sample and can be helpful in learning about the nature of police interactions with the public. However, the data collection for this initiative does not include detailed event-level information and also includes little information about the geographic location of the individual responding to the survey. The survey has distinguished between places of the following sizes, which could be useful to analyze in future work: (1) Under 100,000/Not in a place, (2) 100,000-499,999, (3) 500,000-999,999, and (4) 1 million or more.
There are also several large-scale data collection efforts on policing across the United States. These include initiatives such as the Police Data Initiative [25], Mapping Police Violence [8], Fatal Encounters [6], Stanford Open Policing Project [30], FiveThirtyEight’s Police Misconduct Settlement database [42], the Police Scorecard [34], the Chicago-based Citizens Police Data Project [19] and others. These data collection efforts take advantage of readily-available data and comparisons of the availability, completeness of information on police activity, and topics in these data initiatives are given in Table 1.
These initiatives provide a degree of transparency to the public about how communities are being policed. Access to these data sets allow the public to understand patterns, to describe policing behavior in detail, and to advocate for change. However, most of these initiatives focus on large cities. Figure 1 highlights the distribution of the population sizes of census-designated places (dashed blue) compared to the distribution of population sizes of cities/towns where detailed information is available within the collections highlighted above (solid orange). Out of the comprehensive, incident-level data sets in national and inter-regional data collection initiatives listed in Table 1, only 10.4% of the data cover cities under 50,000 people. From this figure, we see that the distribution of the population of census-designated places in the United States tends to be far lower than the population of places that are fully represented in some of the largest policing data collection initiatives. This highlights the need to collect data and better understand policing in small towns that are more representative of the US population. Small towns sometimes collect similar data (time, location, individuals involved, description, charges, etc.) but the resulting information is often not made publicly available, especially not at the incident level. This creates a barrier for community members and for researchers seeking to better understand how small towns are being policed.
As an effect of this data limitation, much of the research on policing and criminology also focuses on the study of large cities. We conducted a systematic literature review of the last several years of papers in two top policing journals. This included 145 papers from the Journal of Quantitative Criminology from 2017-2021 and 336 papers from the journal Policing and Society from 2016-2021. From the Journal of Quantitative Criminology, 67 cities/towns were named in these analyses and only three of these cities had populations of less than 100,000 people (Wilmington, DE; New Castle, DE; Somerville, MA) and 12 cities with population less than 500,000 people. From Policing and Society, of the 89 cities/towns identified, 18 had populations of less than 100,000 people, 34 with less than 500,000 people. Several papers redacted location names due to privacy issues. We believe that increased availability of public data and discussion on how to collect data from small towns will lead to increased research and therefore knowledge about how small towns are being policed.
Recent work on small-town policing has illustrated the importance of studying small towns but also the lack of available data to statistically analyze policing dynamics. For example, there have been studies on the use of social media by small-town police departments to understand what information is being released to the public [4] as well as studies on the fear of crime in a survey of a small town [5]. Call for service and officer-completed surveys have been used to study response to mental-health related calls in rural areas [47]. Interview data have been used to analyze the disorder and conflict in a college town [46]. Other qualitative studies have also been pursued with small-town police departments (cf. [1, 28]). Notably, most of the above studies rely on interview data rather than publicly available, event-level data, such as call for service data, to analyze policing dynamics in small towns.
In this work, we present challenges and potential approaches to collection and analysis of different aspects of these small-town policing data sets. However, while the material that we present here was motivated by our study of small-town policing, the challenges in data collection and analysis are by no means limited to small towns. Rather, much of what we discuss is a function of technology and resource/personnel constraints. Outdated Computer Aided Dispatch (CAD) systems are not designed to interface with modern data and computing protocols, resulting in difficult and hard to parse data formats [40]. The cost to replace an outdated Computer Aided Dispatch (CAD) system including the necessary hardware and software updates, system implementations, and personnel training can require a upfront costs in the millions, and this is not to mention the ongoing maintenance and support costs [39]. Moreover, the ongoing maintenance of CAD servers and web interfaces requires dedicated personnel, and yet in a most recent estimate from the U.S. Department of Justice, 90% of police departments support fewer than 50 full-time employees [18].
We hope that what we have learned through our work with the Small-Town Policing Accountability (SToPA) Lab will be useful to researchers, community members, and others looking to better understand how their communities are being policed. We present a pair of case studies: one small town in New England and one large town in the Southeast. Each of these is accompanied by its own set of processing and analysis challenges and opportunities. In Section? ?, we introduce and contextualize the case studies. In Section 3, we describe the analysis pipeline for the data sets in these two towns. We include details such as data collection from a police department, preprocessing from messy formats, and insights into statistical analysis of cleaned data sets. Lastly, we discuss our findings and recommendations for researchers and community stakeholders in Section? ?.
2 Case Studies
Although the broad focus of our work is small-town policing, in what follows we share two case studies: one small town and one large town. In doing so we hope to highlight some of the specific differences between the two and outline some of the challenges a scholar is likely to encounter when dealings with municipalities similar to these. The two locations are dissimilar not only in their size but also their socioeconomic and demographic makeup; some key features are shown in Table 2. One attribute that the locations share is the presence of one or more colleges or universities that have a significant impact on the region in terms of employment, emerging industry and political leaning. These towns are not necessarily representative of all towns their size, the goal is simply to point out what it can mean to work with data stemming from two very different data management systems: one outdated, and one more modern yet with its own challenges.
The data sets were collected and driven by a variety of motivations by local activists and community organizers. A common concern is investigating and bringing patterns of police misconduct into the spotlight. Another important motivation is to investigate disproportionately high policing of Black communities. We discuss the details of each data collection process in the sections that follow.
2.1 A Small New England College Town
Williamstown, Massachusetts is home to a private liberal arts college and is the smaller and less diverse of the towns in this study. In the recent past, the Williamstown Police Department became the target of scrutiny and media attention surrounding several instances and accusations of anti-Semitism, sexual harassment, racism, and other instances of misconduct [36, 37, 20, 21]. Discussions with community activists led to specific questions about the policing of historically marginalized communities, specific department-wide practices, and the behavior of specific officers with documented patterns of misconduct.
The data for Williamstown covers police responses in 2019 and 2020. The acquisition of this data set required several months of communication and legal action, including a formal FOIA records request and escalation to the state attorney general. Ultimately, access to the data was granted after a change in departmental leadership. Though legally entitled to digitized data, due to the limited resources of this department, the records come in the form of printed call logs; there were 2,372 and 1,472 pages of records for 2019 and 2020, respectively. The data covers the majority of Williamstown PD’s 2019-2020 interactions with the public, including publicly-initiated incidents like 9-1-1 phone calls, police-initiated incidents like traffic stops, and routine officer activity like building checks. According to the 2020 Williamstown Annual Town Report [44], a total of 15,973 and 10,921 calls occurred in 2019 and 2020, of which 12,298 and 7,509 are represented in the data. Absent from the data are intermittent missing calls, identified by skipped call numbers, records from a number of days in June 2019, and all calls past October 24, 2020. Logs may include details about officer actions, including the reason for initiation, type of incident, location, response time, officer names, call outcome, and free-form narratives, among others.
2.2 A Southern Town with a Booming Tech Industry
Durham, North Carolina is part of the Research Triangle Region and is home to research universities with an economy driven by research facilities in the biomedical and pharmaceutical sciences [12]. Durham is the larger of the case study towns in both population and area. Although Durham is decidedly large, our analysis and workflow here has helped us to develop tools that could be repurposed in the analysis of small towns.
The data were originally gathered as part of a summer research project for the Duke “Data+” program during which students put together an initial framework for mining and processing this data. Broadly, the motivating question was to investigate potential disparities in policing with respect to race.
The data for Durham consist of reports gathered from the open data Durham P.D. Police to Citizen Portal [13]. The open-access portal can be used to search for arrest/incident reports for up to 30 days at a time, and download reports individually. With the help of SToPA’s Durham affiliates, this process was automated via a browser driver using RSelenium [16], allowing for batched downloads. Presently, the lab has processed all entries reported in 2019. These consist of incident reports and arrest reports. A sample of each type of report with all identifying information redacted is shown in Figures 3 and 4. The complete 2019 data consists of 18,129 reports, of which 11,026 are incidents and 6,720 are arrests. Both the incident and arrest reports contain structured (address, dates, and other case ID values) and unstructured (incident descriptions and narrative) data fields.
3 Methods for Small-Town Policing Research
Though data collection is often an arduous step in the research process, the challenges are particularly acute in small towns. Some larger cities offer easy-to-access structured tables downloadable via an API (Application Programming Interface, which in general terms allows one to directly interfacing with a database). In small towns, availability is likely more limited. These case studies highlight the disparity in effort and expertise needed to collect and process small-town policing data. We describe the processes used in these instances, which we hope will serve as a guide for future work in similar locales.
3.1 Data Acquisition
The first step in this work is to gather the necessary data, which is a multi-step process outlined in Figure 5. When we set out to get data, it is important to understand the local laws around data entitlement which vary from state to state. Each state’s website should contain the relevant details including the state-specific definition of public records and what exactly is included under that umbrella. Some non-profits like the National Freedom of Information Coalition compile these details across multiple states all in one place [24], but a state’s governmental website is usually a reasonable place to start.
Once it is confirmed that the desired data are eligible for a public records request, there are multiple pathways. Often the path of least resistance is through public data portals such as the one maintained by the Durham Police Department [13]. Data from these portals can be accessed by manually downloading the data of interest, or by building automated web crawlers and scrapers such as the one described in Section 2.2. More complicated pathways involve human-managed processes such as online forms, emails, or other written communication. Small towns often lack the infrastructure to maintain data portals, so the human-managed pathway is the more common approach. In our experience, this method often requires multiple iterations of discussions and negotiating with local and regional government authorities before the proper data are in hand.
Depending on how the dataset is obtained, it will arrive in a variety of formats. The data might be digitally rendered PDF tables (as is the case with the Durham PD data), or printouts from a digital records system (as with the Williamstown, PD). It could even be copied, printed, or scanned versions of hand-written documents. Depending on the type and quality of data the task of turning this raw data into analyzable tabular data can vary in difficulty. In the following section we will describe some possible tools for carrying out this step.
3.2 Data Processing
One of the significant challenges of this work is parsing and preparation of multimodal data. We outline some of the specific challenges that arise in this pipeline.
3.2.1 Text Extraction
In the cases of a digitally generated PDF (e.g. a PDF form that was filled out using a computer program) there are numerous libraries that can be used to extract text. For the Durham PD data, text was easily extracted from PDF reports using the Python library PDF Plumber [33]. For manually generated PDF files it is necessary to use a more powerful optical character recognition library such as Tesseract [27]. Optical character recognition (OCR) is the process of converting handwritten or printed text (like what is shown in Figure 2) into encoded and machine-readable text. This process typically involves a series of pre-processing steps (e.g. clipping excess margins, scanning boundaries, and ink banding), followed by several passes of a pre-trained engine (in our case, Tesseract) to identify text. In the Williamstown PD data, first the PDF page is clipped to remove excess margins and scanning boundaries such as the thin black line seen on the far left of Figure 2. Then, text items are spatially identified on a PDF page within a bounding box as in Figure 6 using the Tesseract OCR engine.
3.2.2 Text Identification and Correction
Once the text has been extracted and placed within a bounding box, the next step is to identify the extracted text with the features of the original data. Extraction relies on spatial methods, typically via either identifying regions on the page where features typically appear, or relying on the known co-occurrence of certain features. For example, in records such as the one shown in Figure 6, the case number (redacted) is always the upper and right-most integer, and the weekday abbreviation of the arrest always falls immediately to the right of the time of arrest. A drawback to these methods is that they require some knowledge of original PDF page layouts, as well as consistent formatting across records. For digitally filled PDF forms this isn’t typically a major issue, but it becomes quite complex for manually generated PDFs (i.e., hand-scanned printed pages).
However, even in the situation where the data come from digitally created forms, the so-called reading order of a PDF file, i.e., the order of instructions to render the document exist within the PDF, can be significantly different than it appears to a human. Simply put, the order seen by the human is not how the data are stored. This means that even well-meaning attempts by police departments to digitize their data practices can be equally unhelpful to “low-tech” approaches; even a digitally generated PDF with form fields typically still requires scanning via OCR technology. We strongly recommend future efforts from law enforcement organizations towards data transparency include input from a data practitioner toward best practices.
After setting a baseline best guess for text using spatial methods, the next step is to confirm text against libraries of known values. For example, in a small town, it is typically easy to find a list of known officers to check against extracted words. This is particularly useful for manually generated PDFs, where a name like “LT. BROWN” might be returned as one of the following:
This sort of discrepancy can be overcome using Levenshtein distance and fuzzy matching, implemented for example, in the Python package fuzzywuzzy [31]. The Levenshtein distance is a metric used to measure the distance between two strings. It is computed as the minimum number of character edits (i.e. insertions, deletions, substitutions) that need to be carried out to transform one string into the other. So for example,(1)
(1) since “B” needs to be substituted for “8” and “O” needs to be substituted for “0”. From here, fuzzy matching can allow unknown words to be replaced by words from a known dictionary when the Levenshtein distance is sufficiently small. For example, in the case where “BROWN” is returned, this value is compared against an officer name X drawn from a list of known officers. Fuzzywuzzy’s partial_ratio function
where
is the set of all length n substrings of X, and Levenshtein
is the Levenshtein distance. From here it is possible to simply choose the officer whose name is the best fit.
3.2.3 Data Validation
An important final step in this process is to validate the data. If one is using an OCR engine like Tesseract, a good place to begin is with the page-level confidence scores returned at the text extraction step. Tesseract, and its Python based wrapper Pytesseract, predict words as a two-pass process: first it passes through the page and matches identified word-blobs with words in a known dictionary, these words are then passed to an adaptive classifier as prototypes and classification continues in this manner down the page, the second pass goes through the full page a second time with the fully trained adaptive classifier. The confidence of a word-level prediction is then the product of the normalized outline length of the word-blob and the the normalized distance between the word-blob and the prototype [35]. In this way, the page-level confidence can be taken as the mean of all word-level confidence scores on a page. Another option is to validate the generated data against some known ground truths. For example, checking that numerical log numbers are in sequential order, verifying that the parsed datetimes when calls are received chronologically precedes the parsed datetimes when calls are dispatched, en route, and cleared. Finally, if time permits, the data can also be directly validated by a human comparing random samples.
3.3 Exploratory Data Analysis
With processed and validated data in hand, the next step is analyzing the data. In what follows we present some methods that we consider to have broad utility. At this stage of the analysis, there are typically more questions than answers. Hence, we lay out frameworks for analysis that researchers might use in their own towns.
3.3.1 Natural Language Processing
In policing call logs that include large amounts of free-form narrative data, see for example Figure 7, it can be advantageous to identify themes in the narratives so that each theme may be understood separately. Depending on the data at hand, thematic organization may already be included to some degree. For example, the Williamstown data includes call-type labels for each call log, such as “building check,” “public service,” or “motor vehicle stop.” These themes can be fairly broad, however, with “public service” containing narratives which range from helping a child assemble their bicycle to escorting a citizen home after they received threats of violence. Annotating each log with a more precise category label would facilitate further detailed analysis. For towns as small as Williamstown, it might be possible to perform these annotations by hand: with only 19,975 logs, hand annotation would be possible given sufficient volunteer power. However, finding and training annotators, even volunteers, requires significant time and funding and could pose a barrier to entry. As an alternative, an automated process for grouping logs could decrease activation energy and create a pathway for analysis in small towns for which hand-annotation is prohibitive. An automated process might also find relationships humans might not immediately recognize.
Topic modeling is a promising candidate for such an automated process. Topic models partition a collection of documents into groups based on latent statistical word and phrase patterns. Intuitively, given a human-defined topic, say “vehicles,” we associate certain words with that topic (e.g. “SUV,” “plate,” “driver,”). Documents written by humans can be intuitively thought of as a mixture of topics: we might think of a call log requesting occasional well-being checks during a power outage due to a medical issue as a mixture of topics like “well-being checks”, “utilities”, and “health”. A topic model can identify possible “topics” based on which words occur together in documents (given a sufficiently large body of documents with sufficiently robust vocabulary). Unlike a human who can represent topics as an abstract category with an explicit name, a topic model represents topics without an explicit label, typically as a set of words that frequently co-occur or as a clustering of documents that use similar vocabularies. A topic model may cluster words into word clusters, documents into document clusters, or both. Documents which consist of a similar mixture of human-recognizable topics are expected to be clustered together by a topic model. A topic model with ability to finely distinguish between many topics could, in theory, divide the broader call-type label “motor vehicle stop” into more precise topics, such as stops for speeding, stops for DUIs, or stops for broken taillights. This machine-assisted topic detection could significantly reduce the amount of time researchers spend reading complicated documents and could detect topics humans reasonably cannot in extremely large document collections. In the remainder of this section we will walk through several examples of topic modeling carried out with the Williamstown data.
To reduce noise and improve topic cohesion in the topic modeling process, the following preprocessing steps were implemented: non-alphanumeric characters were removed; words of length 2 or less were removed; the text was tokenized (i.e. separated into individual words); and words were lemmatized (i.e. multiple forms of the same word reduced to one form) using the Natural Language Toolkit [3]. Lemmatizing allows words like “fires” and “fired” to be combined together with their basic grammatical stem “fire.” Then, words that only appeared in one document were removed, and documents were converted from lists to sets of words (i.e. duplicate words in the same document were removed). About one-third (6,481) of the 19,975 Williamstown police logs were removed during preprocessing, leaving 13,494, the lengths of which are summarized in Figure 8. Most of the removed logs had empty narratives in the primary data sets, consisted of a single character, or consisted only of the words “narrative” and “done”. A few contained typographical or OCR errors that were removed due to a low number of occurrences (e.g. “cheeked” instead of “checked”). Of the remaining logs, 30% were of length 1 word, and an additional 18% were of length 2. Extremely short narratives of length 0, 1, or 2, which are predominant in the data set, offer little or no information about what occurred in a police officer’s action. The efficacy of topic modeling is limited by the policing practice of writing extremely short narratives, if any at all. This feature of police record-keeping makes it difficult for any reader, machine or human, to understand what occurred in a police action.
Even disregarding extremely short logs, the short average length of call log narratives could present an obstacle: popular models which use statistical approaches to determine word co-occurrence patterns are limited by data sparsity. Short text topic modeling algorithms designed specifically for short text documents have emerged to address this issue. For a review, taxonomy, and qualitative analysis of such short text topic models see [23] and references therein.
We modeled the topics in the Williamstown Police logs using a hierarchical stochastic block model (hSBM) [14, 17] and the Gibbs Sampling algorithm for the Dirichlet Multinomial Mixture model (GSDMM) [48]. The hSBM represents a state-of-the-art topic model that avoids many of the pitfalls of other popular models. For example, the popular Latent Dirichlet Allocation (LDA) model is limited by its tendency to overfit and its inability to capture complex, heterogeneous structure that does not follow assumed statistical distributions (see e.g. [14] and references therein). An hSBM represents a document collection as a bipartite network of documents and words so that the problem of inferring topics becomes a problem of inferring communities in a network. Community detection methods from network analysis, which have few assumptions about the structure of the underlying data, are then used to identify word clusters (topics) and document clusters. On the other hand, in order to model topics in short text documents, GSDMM makes the assumption that each document is associated with only one topic. After random initial assignment of documents to clusters, document clusters are generated by iteratively reassigning each document to the cluster with the most similar vocabulary to that document. An excellent explanation of the mechanics of GSDMM can be found in [48]. The hSBM was considered because of its status as a state-of-the-art model, while GSDMM was considered because of the potential of its short-text specific approach.
For the Williamstown police logs, the hSBM and GSDMM document clusters exhibited a great deal of overlap. For example, there were a large number of logs written for simple building or vehicle checks. The narrative for this category of police action usually consisted of the word “checked,” or perhaps “checked/secured” or “checked area.” Both models identified a cluster of several thousand logs of this type, with significant overlap between the hSBM cluster and the GSDMM cluster (see Table 3).
Additional common themes were identified by both topic models in the police logs, as summarized in Table 3. These include misdials, telemarketers, and test calls (a single cluster) and obstruction of roadways. The category on obstruction of roadways was robust enough that similar logs were clustered together even if they did not share many vocabulary words. For example, the narratives that follow in Table 4 share no words at all after preprocessing, yet were correctly clustered together by both models. These words have a high rate of co-occurrence in the high dimensional vocabulary space, but also seem to share some common themes related to adverse weather incidents.
These results on topic modeling for call logs have provided interesting preliminary information on how the Williamstown community is being policed, beyond information that is easily gleaned from the provided categorization of calls by the PD. This work could be expanded to other small towns and cities in the analysis of log descriptions or other text fields, such as the description of use of force incidents.
Moving forward, one should be aware of several issues that may arise when using topic modeling on any text data, and especially short text data. If a topic model worked exactly as intended, each document cluster would represent a particular latent topic or distribution of latent topics. Because of data quality issues and random noise, however, at least two inaccuracies can occur: a latent topic can be distributed among several clusters in a nonsensical way, and a cluster may group together multiple unrelated topics. In practice, both of these issues occur simultaneously to differing degrees.
Since clustering is an unsupervised method, the connection between resulting clusters and topics of interest isn’t always one-to-one. For example, in the GSDMM model, there were two distinct document clusters we characterized as logs related to “wild animals” including bears, raccoons, possums, deer, etc. (the GSDMM model also identified a separate topic for logs related to domestic animals like dogs and cats). It is worth noting that the hSBM model successfully grouped these two sets of documents together into one larger cluster. On the other hand, hSBM failed to group some clusters that the GSDMM grouped successfully, such as “disabled motor vehicles,” a group which was instead distributed among several document clusters related to motor vehicles.
Across all clusters, frequent overlap between topics (e.g. two overlapping topics about vehicles and traffic) made topics difficult to interpret. For example, the GSDMM “wild animals” cluster referenced above, while largely coherent, also contained a number of unrelated logs that had to do with needles and syringes. In addition, logs that did not contain enough information to be identified with a latent topic seemed to be randomly distributed into other existing clusters. For example, narratives consisting of only the words “daughter home” were grouped together with “suspicious behavior” and “trespassing” in the GSDMM model, and with “public records requests” in the hSBM model. The fact that clusters contained some degree of narratives irrelevant to the main theme (we term “noise”), decreased the overall cohesion of each cluster. We have also observed such noise could have been coherently grouped in a new cluster, if it were to be introduced. It is worth noting that in some topic models, the number of resulting clusters is specified as a hyperparameter. However, an advantage of hSBM and GSDMM is that the exact number of clusters does not need to be specified beforehand, though other hyperparameters may implicitly affect the number of clusters discovered. Therefore, any resulting clustering is a result of the choice of algorithm or the nature of the corpus of text; not because there were too few clusters specified to reflect all latent themes. Producing high quality clusters in the domain of limited-length narratives in the context of police logs is of ongoing interest to us.
The fact that both models succeeded and failed in similar ways suggests that data quality is the most impactful source of inaccuracies in clustering, and it would be worthwhile to try to understand and address precisely the data attributes that limit the effectiveness of each topic model. For example, human labeling, and removal of extremely short logs, could prevent those short logs with little contextual meaning from being sorted randomly into clusters. A more sophisticated lemmatization step–one capable of distinguishing different denotations of a word, such as “parked” car compared to green space “park”–would improve identification of word co-occurrence. Finally, improving the OCR and parsing segments of the data pipeline would decrease miscategorization in the detected narratives and therefore decrease noise in the final topic clusters. Approaches such as these would improve data quality and thereby cluster cohesion.
3.3.2 Spatial Analysis
Spatial information can be useful to understand the distribution of policing events, such as arrests or use of force incidents, especially when compared to socioeconomic and/or demographic characteristics of communities. For example, community members and activists may be interested in determining if some neighborhoods are being highly policed or subject to high rates of violent force by police. The level of detail in spatial information that is made public varies by town due to factors such as data collection processes and privacy processes in data release. For example, Williamstown releases primarily the name of the road where a given event occurred. Releasing a single street name for an incident provides little useful spatial information. This is particularly problematic for rural areas, because roads can be quite long, which makes statistical inference via spatial aggregation difficult. Williamstown in particular releases some events with “spatial codes,” which give more precise spatial information such as the name of a specific location (a numbered address, or building name), but only 29% of events in logs have these spatial codes. The meaning of these spatial codes is also not obvious (ex: WIA_123) and a table mapping codes to locations required a follow-up request from the police department.
Another nuance of spatial analysis is privatization methods. It is a relatively common practice for cities to spatially privatize the data before making information available; most commonly by jittering GPS coordinates, adjusting addresses, or by redacting some information from the address of an incident. As an example which we have studied, the police department in Minneapolis, Minnesota appears to spatially privatize the latitude/longitudes that are released to the public by moving all events to the center of a given block. We illustrate this in Figure 9 where there are many locations of police use of force incidents that are all coded at the same block centroids. Although information on the privatization process was not found to be publicly available, this practice is evident when plotting the police use of force data from Open Minneapolis [26]. Although this is a relatively mild example of spatial privatization in police data, people studying policing data should be cognizant that spatial privatization steps that are not declared may obscure accountability efforts.
Rather than releasing privatized or partially redacted spatial data, it is more common for police departments to release data on a more aggregated level, such as the police beat or district of an event. In some cases, the exact location of an original arrest/event is still obtainable. For example, in Durham we have complete address information in the arrest records that can be geocoded to obtain exact latitude/longitude coordinates. This makes precise geocoded information readily available, removing many of the complications of spatial statistical analysis.
We note that even when it seems there are exact addresses available, data processing can reveal further issues. For example, we found the Durham data set coded many incidents as taking place at the police headquarters. Datasets from cities or towns may have a similar “default” location near the center of the municipality or county. These locations may not be of interest, given that coding an event to be located at the policing headquarters may not accurately describe the policing dynamics of a city (for example, where police officers are patrolling).
Generally in the spatial analysis of event information, there are two common modeling frameworks: areal and point process. We present a very simple summary of these two approaches to illustrate the challenges in spatial analysis of incomplete or anonymized spatial information that is often released in small-town policing data.(2a)
(2a)
(2b)
(2b)
Equation 2a represents an “areal” approach which relies on aggregate analysis on spatial levels such as counties, census tracts, or census block groups (which we call areal units) as a function of abstract location, s. The count of events per areal unit (or a rate per population), Y(s), is related to the spatial covariates, X(s), (e.g. census socioeconomic/demographic information) and the error distribution, e, which typically has spatial structure or dependency. Equation 2b illustrates the general framework of point process modeling, in this case via a nonhomogeneous Poisson process. The spatial “intensity,” , indicates generally how likely events are to happen at a given location, s. This depends again on some spatial information, X(s), at that location, which is oftentimes census information in census tracts or block groups. In both models, we are interested in inferring regression coefficients, β, as well as other parameters that may be incorporated in more complex versions of these models, such as log Gaussian Cox processes or clustering models.
There are many statistical challenges presented through spatially uncertain geographic point locations. For example, when only street segments are released, analysts may consider population-weighted placement of events along the streets to analyze events spatially, or it may be necessary to avoid spatial analysis of events altogether. When blocks are released (e.g. ‘12XX Main Street’), similarly one may consider only analyzing the data based on areal units (such as block groups through Equation 2a) rather than point process (event-level) analysis. Additionally, an assumption of spatial point process models is that at most one point of the process is observed at each location, which means that there is a fundamental problem when spatial anonymization is pursued where points are placed in the same (anonymized) location, such as the center of a block as in the city of Minneapolis. Minimally, these points must be spatially jittered in some way to try to approximate the original locations, but areal-level analysis may be more appropriate in some cases.
In the rare case that the exact address is released, the analyst must convert the address to a latitude/longitude point for use in statistical analysis in a process called geocoding. The process of geocoding introduces positional errors, where points are not always placed correctly at their true location. This is particularly problematic in rural settings where positional error can be quite large (and therefore is a topic of concern for small towns) [22]. If exact latitude/longitude coordinate values are released by the police department, the analyst should be aware of potential anonymization applied to the data set by the police department that is not disclosed to the user. If the coordinates are exact, which is rare, or if geocoded exact addresses are used, the analyst must be conscious of the need to protect the privacy of the original location. These addresses may represent sensitive information, such as home addresses of the people involved in policing events. Spatial privacy methods may be considered to protect the original location (for example, when visualizing the dataset); however, privacy considerations must be balanced with the goal of preserving the statistical utility of the original data set. When spatial information has been modified in some way before analysis, one must be very cautious of interpretation of estimates of regression coefficients, β, when using spatial models to analyze the relationship between community characteristics and policing outcomes, as they are subject to change if the statistical utility has been compromised.
In summary, statistical analysis of the spatial features of small-town policing datasets is often difficult. Largely, these difficulties arise from lack of data availability: spatial information is either completely missing or is redacted in some way. It is important to be careful in the analysis of these redacted locations and to not treat them as if they were the original data locations. However, even anonymized location information can help communities learn about the policing dynamics in relation to other spatial information, such as socioeconomic characteristics of communities.
4 Discussion
For small-town communities seeking insights into the way that their municipalities are policed, this work is intended to provide a launching point for discussions of local law enforcement. Whether the goal is to reinforce trust that members of the community already hold, to regain confidence in a department where trust has been lost, or to help enable conversations aimed at more progressive change, transparency and accountability are vital.
One of the primary challenges in studying small-town policing is the availability of high quality data. As we have seen in our work, larger and more resourced towns such as Durham are able to make data available online in a format that can be downloaded and parsed. Smaller towns like Williamstown may not currently have the necessary infrastructure to make this possible. In many cases, the barriers presented here–repeated records requests, low quality data, the necessity of a technically challenging digitization pipeline, and uncertain quality of the resulting data–can prove insurmountable to individuals working alone at the local level. Our hope is to help lower the barrier to entry by working alongside these individuals and creating well-documented and easy-to-replicate tools and processes in our public repository https://qsideinstitute.github.io/SToPA/. We conclude by describing some future directions for this work and recommendations for law enforcement, policymakers, academics, and citizen activists.
4.1 Future Directions
In [29], the case is made for enhanced data collection and availability for the public good, particularly around understanding the scope of police use of force. In any context, if data were able to be utilized and analysed by the public, this would allow for partnerships between academics and community organizations interested in quantifying and visualizing how their communities are being policed. One example comes from Minneapolis, Minnesota where a co-author is collaborating with a nonprofit in the community, Confluence Studio. Their work is motivated towards increasing visibility and accountability around the policing of the 9th Ward in Minneapolis. This includes efforts like mapping and the analysis of who is being policed when and where in the neighborhood. This information is not meant to be interpreted alone – the community is able to add this analysis to their own lived experience in order to advocate for potential change in policy. This kind of work is made possible, at least in part, by the fact that Minneapolis publicly releases policing data (although these come with their own set of challenges, some of which we describe in Section 3.3.2). The release of data to the public and the ability to get that data into a format that can be analyzed can be important components to increasing transparency and communication in communities about policing.
A sufficiently large quantity of high-quality data also provides the opportunity to perform analysis using more robust statistical methods such as clustering, classification, and regression to address more subtle aspects of bias in how law enforcement may interact with the public. For example, it is possible to model response times between 911 calls and officer arrival on the scene in a manner similar to analysis done on fire department turnout times [2]. Alternatively, one could model wait times between calls initiated and calls cleared, using frameworks similar to those that have been used to analyze hospital emergency department wait times [7]. One might also be interested in modeling the relationship between community characteristics and policing outcomes in those neighborhoods to understand potential biases or patterns in policing behavior.
Often the questions we most want to ask about bias, such as the effect of race on policing incidents and outcomes, cannot be directly modeled because race data are not recorded. Absent drastic improvements in data collection practices, this missingness of data brings up the need for development of tools that allow for the estimation of individual or group level statistics from aggregate data, such as with ecological inference and Bayesian simulation. For example, an important question to ask is whether different communities are being policed in different ways (i.e. is there racial or socioeconomic polarization in the rates of policing). Recently, [15] attempts to answer this type of question using Bayesian modeling to estimate posterior probabilities of racial polarization using Markov Chain Monte Carlo (MCMC) sampling. Methods such as this allow researchers to achieve reasonable estimates for demographic distribution among log subjects when that information is not directly available in the data.
The Small Town Policing Accountability (SToPA) Lab is in the process of developing a toolkit to make this work more feasible. At the time of this writing, we plan for the toolkit to have 6 steps: (1) Getting Started (building a team and creating an ethical data practices plan), (2) Get data, (3) Extract, transform, and load data, (4) Map data and pull census data, (5) Analyze data, and (6) Use the analysis to make change. Many of the analytical tasks described in this paper will be integrated into the toolkit.
4.2 Recommendations
Easily-accessible data, which we hope to democratize with this work, is only one pathway to promoting accountability. Community members, law enforcement, policy makers, and academics in diverse fields have more tools at their disposal which can be used in parallel with data. For example, local law enforcement agencies can take steps to regain the confidence of the communities they serve. The Strengthening Police and Community Partnerships process [41] can assist in facilitating community-led discussions. Policy makers can create legislation that standardizes data collection, enforces the manner of dissemination (as in California, Rhode Island, Connecticut and Illinois), and provides funding for improvements to supporting technology.
Researchers can ensure the relevance and impact of their work by working directly with local constituents and interdisciplinary experts. In the work described in this paper, collaboration with local activists in the Williamstown area lent insight into context behind the data, such as historical racial tensions in specific neighborhoods, that could have been invisible to outsiders otherwise. Lived experiences of local community stakeholders represent situated knowledge that should be valued as with statistical findings. Additionally, it is important that we bring expertise from researchers in the sociology of policing to understand the patterns and norms in policing across the United States. This would enable us to call attention to the many common but undocumented practices in policing. Researchers in urban policy and planning can lend insight into the ways that cities and places shape behavior and the way that human behaviors shape their environments. Experts in law enforcement and the criminal justice system also carry knowledge that could be helpful in interpreting our work and placing more targeted data requests.
4.3 Conclusion
Though the focus of this work has been in small and under-resourced towns, even comparatively well-resourced municipalities may face similar challenges. Where data are made available, sometimes the scale or format may not immediately lend itself to analysis.
The techniques discussed in this paper could also be applicable to processing other kinds of datasets in small towns through urban settings. It is easy to imagine that these same tools may be useful to anyone facing similar data challenges. For example, these methods may be useful to process and analyze datasets on environmental monitoring, public safety more broadly, business licensing/regulatory data, and others. The open-source nature of the tools proposed here enable a broader diversity of users, particularly those outside this research area, to understand policing in their own jurisdictions and further contribute to this work.
Table 1 Comparison of national police data collection initiatives, including number of cities represented in the initiative, the median population of those cities, the mean number of data sets per city (for example, cities could include both use of force and calls for service), and description of the topics, level of detail of represented, and time coverage.
Table 2 Key Features of Case Study Municipalities. Demographic data are as reported by the U.S. Census Bureau 2021 Population Estimates Program [45].
Table 3 Common Topics detected by models with associated cluster sizes (in number of logs).
Table 4 Narratives that share no words in common but were correctly placed in the same cluster by both models.
Figure 1 Comparison of the distribution of towns and distribution of comprehensive data for various population sizes. Share of places (dashed blue) shows the relative share of census-designated places of a given size. Share of detailed data (solid orange) shows the share of full-coverage, incident-level data from the data initiatives in for the same population sizes. As some cities are represented in multiple data sources, e.g. New York City having both arrest and police misconduct data, each unique data set within the data initiatives is represented as one observation.
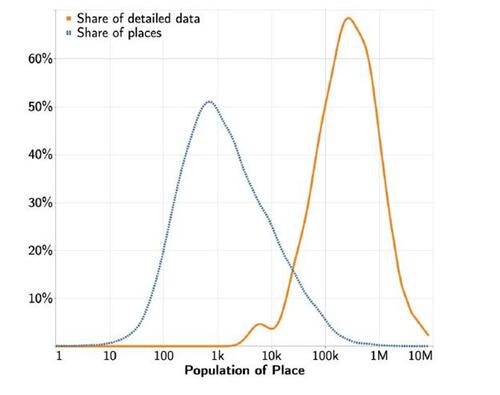
Figure 2 Partial sample Williamstown PD call log entry
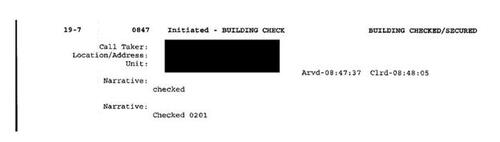
Figure 3 Partial sample incident report.
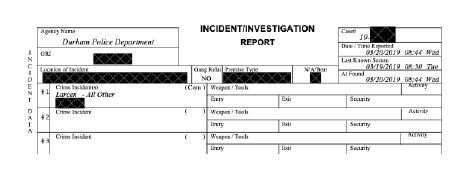
Figure 4 Partial sample arrest report.
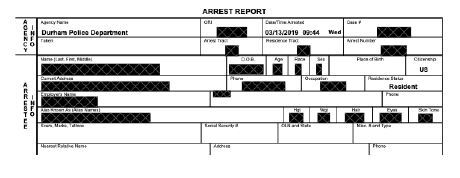
Figure 5 Data Gathering Workflow
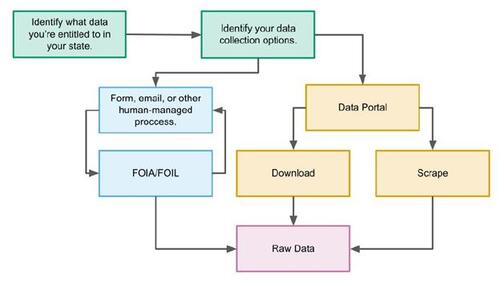
Figure 6 Top: A header from a typical arrest report. This is an example of a computer generated PDF. Bottom: Text extraction from an arrest report after the hatched grey regions of the document are cropped out. Words identified in the documented are shown with red bounding boxes.
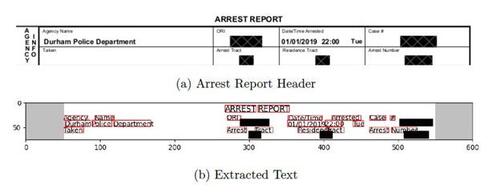
Figure 7 Sample narrative text from Williamstown PD call logs
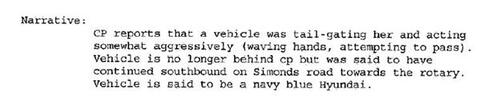
Figure 8 About one-third of the Williamstown police logs were removed during preprocessing, and 48% of the additional logs had fewer than 3 words.
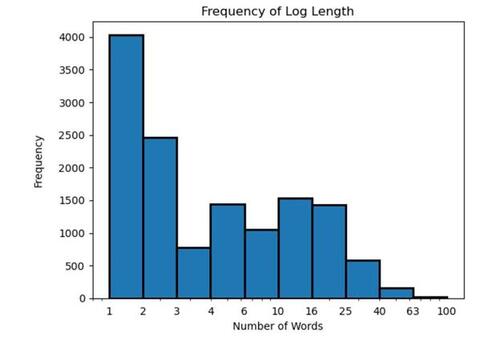
Figure 9 Minneapolis Police Department Use of Force Data from the ‘Open Minneapolis’ Initiative for an area of southern Minneapolis [26].
![Figure 9 Minneapolis Police Department Use of Force Data from the ‘Open Minneapolis’ Initiative for an area of southern Minneapolis [26].](/cms/asset/ae83bfa2-3331-41c7-8bf2-80e68cf1ca6c/uspp_a_2379270_f0009.jpg)
References
- Joshua L Adams. “I Almost Quit”: Exploring the Prevalence of the Ferguson Effect in Two Small Sized Law Enforcement Agencies in Rural Southcentral Virginia. The Qualitative Report, 24(7):1747–1764, 2019.
- Madison Arnsbarger, Joshua Goldstein, Claire Kelling, Gizem Korkmaz, and Sallie Keller. Modeling response time to structure fires. The American Statistician, 75(1):92–100, 2021.
- Steven Bird, Edward Loper, and Ewan Klein. Natural language processing with Python. O’Reilly Media Inc., 2009.
- Francis D Boateng and Joselyne Chenane. Policing and social media: A mixed-method investigation of social media use by a small-town police department. International Journal of Police Science & Management, 22(3):263–273, 2020.
- Michelle A Bolger and P Colin Bolger. Predicting fear of crime: Results from a community survey of a small city. American Journal of Criminal Justice, 44(2):334–351, 2019.
- D Brian Burghart. Fatal encounters. https://fatalencounters.org/, 2023. Last Accessed 2023-02-27.
- Bill Cai and Iris Shimizu. Negative binomials regression model in analysis of wait time at hospital emergency department. In Proceedings. American Statistical Association. Annual Meeting. NIH Public Access, 2014.
- Campaign Zero. Mapping Police Violence. https://mappingpoliceviolence.org, 2023. Last Accessed 2023-02-27.
- Carla Astudillo, Craig McCarthy, Blake Nelson, Erin Petenko, Disha Raychaudhuri, S P Sullivan, Stephen Stirling, and Yan Wu. New Jersey Force Report. https://force.nj.com/, 2018. Last Accessed 2024-01-07.
- Carla Astudillo, Craig McCarthy, Blake Nelson, Erin Petenko, Disha Raychaudhuri, S P Sullivan, Stephen Stirling, and Yan Wu. Police Use of Force Reports (New Jersey). https://www.propublica.org/datastore/dataset/police-use-of-force-new-jersey, 2018. Last Accessed 2024-01-07.
- Connecticut Racial Profiling Prohibition Project. Connecticut Traffic Stop Data. http://trafficstops.ctdata.org/, 2022. Last Accessed 2024-01-07.
- Durham Economic Development. Community Data. https://www.durhamchambered.org/community-data, 2023. Last Accessed 2023-05-19.
- Durham Police Department. Durham Police to Citizen Portal. https://durhampdnc.policetocitizen.com/eventsearch, 2023. Last Accessed 2023-01-02.
- Martin Gerlach, Tiago P. Peixoto, and Eduardo G. Altmann. A network approach to topic models. Science Advances, 4(7):eaaq1360, 2018.
- Anna Haensch, Daanika Gordon, Karin Knudson, and Justina Cheng. A multi-method data science pipeline for analyzing police service. The American Statistician, 0(ja):1–18, 2024.
- John Harrison. RSelenium: R Bindings for ‘Selenium WebDriver’, 2022. R package version 1.7.9.
- Charles C Hyland, Yuanming Tao, Lamiae Azizi, Martin Gerlach, Tiago P Peixoto, and Eduardo G Altmann. Multilayer networks for text analysis with multiple data types. EPJ Data Science, 10(1):33, Jun 2021.
- Shelley S Hyland and Elizabeth Davis. Local police departments, 2016: Personnel. Las Vegas: United States Department of Justice Office of Justice Programs Bureau of Justice Statistics, 2019.
- Invisible Institute. Citizen Police Data Project. https://invisible.institute/police-data, 2023. Last Accessed 2023-02-27.
- Josh Landes. Williamstown police department admits to illegally searching critics’ records. WAMC Northeast Public Radio, Mar 2021. https://www.wamc.org/new-england-news/2021-03-12/williamstown-police-department-admits-to-illegally-searching-critics-records.
- Josh Landes. Independent investigations of Williamstown Police Department detail systemic failures at “at many levels,” confirm sexual misconduct, racism claims. WAMC Northeast Public Radio, Jan 2022. https://www.wamc.org/news/2022-01-28/independent-investigations-of-williamstown-police-department-detail-systemic-failures-at-at-many-levels- confirm-sexual-misconduct-racism-claims.
- Shengde Liang, Bradley P Carlin, and Alan E Gelfand. Analysis of Minnesota colon and rectum cancer point patterns with spatial and nonspatial covariate information. The Annals of Applied Statistics, 3(3):943, 2008.
- Belal Abdullah Hezam Murshed, Suresha Mallappa, Jemal Abawajy, Mufeed Ahmed Naji Saif, Hasib Daowd Esmail Al-ariki, and Hudhaifa Mohamme Abdulwahab. Short text topic modelling approaches in the context of big data: taxonomy, survey, and analysis. Artificial Intelligence Review, 56:5133–5260, 2023.
- National Freedom of Information Coalition. State Freedom of Information Laws. https://www.nfoic.org/state-freedom-of-information-laws/, 2023. Accessed 2023-02-09.
- National Policing Institute. Police Data Initiative. https://www.policedatainitiative.org/. Last Accessed 2023-02-27.
- City of Minneapolis. Open Minneapolis. https://opendata.minneapolismn.gov/datasets/cityoflakes::police-use-of-force/explore, 2023. Last Accessed 2023-12-12.
- Jeroen Ooms. tesseract: Open Source OCR Engine, 2022. https://docs.ropensci.org/tesseract/ (website) https://github.com/ropensci/tesseract (devel).
- Stephen S Owen, Tod W Burke, April L Few-Demo, and Jameson Natwick. Perceptions of the police by LGBT communities. American Journal of Criminal Justice, 43(3):668–693, 2018.
- Lynne Peeples. What the data say about police brutality and racial bias—and which reforms might work. Nature, 583:22–24, 2020.
- Emma Pierson, Camelia Simoiu, Jan Overgoor, Sam Corbett-Davies, Daniel Jenson, Amy Shoemaker, Vignesh Ramachandran, Phoebe Barghouty, Cheryl Phillips, Ravi Shroff, et al. A large-scale analysis of racial disparities in police stops across the United States. Nature Human Behaviour, 4(7):736–745, 2020.
- Seat Geek Inc. fuzzywuzzy: Fuzzy String Matching in Python, 2014.
- Lawrence W Sherman. Reducing fatal police shootings as system crashes: Research, theory, and practice. Annual Review of Criminology, 1:421–449, 2018.
- Jeremy Singer-Vine and The pdfplumber contributors. pdfplumber. https://github.com/jsvine/pdfplumber, 11 2022.
- Samuel Sinyangwe. Police Scorecard. https://policescorecard.org/, 2023. Last Accessed 2023-02-27.
- Ray Smith. An overview of the Tesseract OCR engine. In Ninth International Conference on Document Analysis and Recognition (ICDAR 2007), volume 2, pages 629–633. IEEE, 2007.
- Scott Stafford. Lawyers group, Pittsfield NAACP branch seek termination of Williamstown, Mass. police officer. The Bennington Banner, Aug 2021.
- Scott Stafford. Reports confirm hostile work environment at Williamstown Police Department, lay the blame on former chief and former sergeant. The Berkshire Eagle, Jan 2022.
- Susannah N Tapp and Elizabeth Davis. Contacts between police and the public, 2020. Bureau of Justice Statistics, Nov 2022.
- The City of San Diego Office of the Independent Budget Analyst Report. Computer aided dispatch system replacement funding. https://www.sandiego.gov/sites/default/files/13_08_130208.pdf, 2013. Last Accessed 2023-12-12.
- The National Highway Traffic Safety Administration (NHTSA) National 911 Program. Computer-Aided Dispatch Interoperability Strategies for Success . https://www.911.gov/projects/cad-assessment-project/, 2023. Last Accessed 2023-01-11.
- The United States Department of Justice. Strengthening police and community partnerships. https://www.justice.gov/crs/our-work/facilitation/strengthening-police-community-partnerships, Aug 2023. Last Accessed 2023-12-12.
- Amelia Thomson-DeVeaux, Laura Bronner, and Damini Sharma. Cities spend millions on police misconduct every year. Here’s why it’s so difficult to hold departments accountable., Feb 2021. https://fivethirtyeight.com/features/police-misconduct-costs-cities-millions-every-year- but-thats-where-the-accountability-ends/.
- Amel Toukabri and Lauren Medina. America: A Nation of Small Towns. https://www.census.gov/library/stories/2020/05/america-a-nation-of-small-towns.html, May 2020. Last Accessed 2023-12-12.
- Town of Williamstown Massachusetts. 2020 Annual Town Report. https://williamstownma.gov/wp-content/uploads/2021/05/ATR-FINAL-1.pdf, 2020. Accessed 2023-01-25.
- U.S. Census Bureau. Quickfacts: United States. https://www.census.gov/quickfacts/fact/table/US/PST045222, 2023. Accessed 2023-01-02.
- Rachael A Woldoff and Karen G Weiss. Studentification and disorder in a college town. City & Community, 17(1):259–275, 2018.
- Sue-Ming Yang, Charlotte Gill, L Caitlin Kanewske, and Paige S Thompson. Exploring police response to mental health calls in a nonurban area: A case study of Roanoke County, Virginia. Victims & Offenders, 13(8):1132–1152, 2018.
- Jianhua Yin and Jianyong Wang. A Dirichlet multinomial mixture model-based approach for short text clustering. In Proceedings of the 20th ACM SIGKDD International Conference on Knowledge Discovery and Data Mining, KDD ’14, page 233–242, New York, NY, USA, 2014. Association for Computing Machinery.