
Abstract
Management Strategy Evaluation (MSE) is a framework to explore the tradeoffs amongst fishing strategies and assess the consequences for achieving management goals provided sources of uncertainty by means of simulation models (referred to as operating models). Single-species stock assessment often implements simulations for MSE, but the operating models often omit the dynamics of key biological interactions. This could be a disadvantage for the evaluation of tradeoffs as species interactions could have an impact on the performance of harvesting strategies. Tools for conducting ecosystem-based fisheries management (EBFM), such as integrated ecosystem assessments, include executing MSEs with ecosystem models, many of which explicitly include biological interactions. Although the support for EBFM has grown over the years, the amount of information provided by MSEs based on ecosystem models appears to be limited. A clear summary of such efforts would provide beneficial information for future efforts for EBFM. Herein, an inventory of applications simulating MSEs with ecosystem models that explicitly include biological interactions was developed based on findings from a literature review. First, the methodologies and foci across all identified applications are analyzed. Next, summaries of each application are provided. Lastly, general observations are provided along with recommendations for future applications.
1. Introduction
It is imperative to promote the health and productivity of marine ecosystems as they provide resources and support to societies across the globe, as captured in the UN Sustainable development goal 14 “Life Below Water” (United Nations Citation2015). Fisheries management strategies are methods to define harvesting regulations based on the estimated condition of a resource, which is determined by data collection programs and stock assessments. Often, multiple candidate management strategies are in question to be put into operation, each of which is configured differently according to the values and objectives of managers and stakeholders. The success of candidate management strategies is not intuitive due to the complexity and stochasticity of marine ecosystems, and this is even more so with the unknown feature of marine systems in response to climate change. Management strategy evaluation (MSE), sometimes referred to as the management procedure framework, is a system for using simulations to evaluate the tradeoffs in performance among candidate management strategies (Smith Citation1994; Butterworth et al. Citation1997; Butterworth and Punt Citation1999, Citation2003; Smith et al. Citation1999; Sainsbury et al. Citation2000; Rademeyer et al. Citation2007; Holland Citation2010; Punt et al. Citation2016a). It is especially useful for exploring the impacts of uncertainty, the incomplete knowledge about a system and/or process (FAO Citation1996), on the resulting recommendations. Best practice guidelines for MSE, as described by Punt et al. (Citation2016a), include: (i) selection of objectives and performance metrics, (ii) selection of uncertainties, (iii) identification of candidate management strategies, (iv) simulation of the application of the management strategy, and (v) presentation of results and selection of a management strategy.
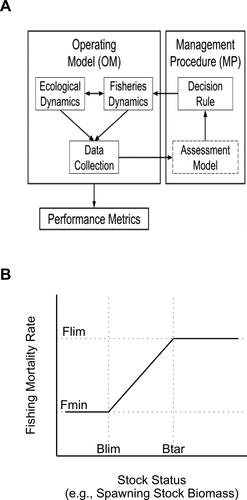
Simulating the application of the management procedure is a pivotal step for MSE as this obtains the results to present to decision-makers. Performance metrics are computed for the evaluation of candidate management procedures by means of simulating the connection between the resource and fisheries management (). Simulations for MSE consist of a routine for simulating the dynamics of the resource ecology and fisheries, called an operating model (OM), and a routine for simulating the process of determining management actions, called the management procedure (MP). At some point during the OM simulation the MP is activated, at which a subroutine, often called the monitoring model, collects data from the OM that represents information ascertained from monitoring efforts (i.e., fisheries-independent and/or fisheries-dependent data). This monitoring data is, then, processed by an assessment model (a.k.a., an estimation method) to estimate the status of the resource (e.g., estimated spawning stock biomass). Next, the estimated status of the resource is processed by a decision rule to determine a management action. Typically, the decision rule consists of a harvest control rule (HCR; )—a function relating the status of the resource (e.g., spawning stock biomass) to a level of fishing pressure (e.g., fishing mortality rate). Lastly, the resulting management action is implemented back into the OM before the simulation resumes. This feedback-loop between the OM and MP continues throughout the course of the simulation. When the simulation ends, performance metrics are computed for the evaluation of the candidate management procedure. When multiple candidate management procedures are in question, the simulation testing is conducted for each one individually.
Figure 1. General structure for the Management Strategy Evaluation (MSE) modeling process (A; image adapted from Punt et al. Citation2016a). An operating model (OM) simulates the ecological and fisheries dynamics. Data pertaining to the managed resource is collected (monitoring data) and passed to the management procedure (MP). This data could be sent to an assessment model (dashed box) to determine the stock status to provide to the decision rule, or directly to the decision rule. The decision rule determines the management regulation to impose on the fisheries dynamics within the OM. This feed-back process continues until it is turned off or the simulation ends. Example of a decision rule (B). The broken-stick harvest control rule, shown here, is a commonly used decision rule defined by the reference points: biomass limit (Blim), biomass target (Btar), minimum fishing mortality rate (Fmin), and limit fishing mortality rate (Flim).
A number of organizations routinely conduct MSE simulations to support single-species stock assessment, such as the International Whaling Commission (IWC Citation1993, Citation1994), the Commission for the Conservation of Antarctic Marine Living Resources (de la Mare Citation1996), and the International Council for the Exploration of the Seas (ICES Citation2019). Under a single-species context, the OM lacks explicit representation of the biological interactions relating to the stock (i.e., predator-prey interactions and competition). This can be a disadvantage as biological interactions can have meaningful influences on the productivity of a stock. To account for such influences, some have approximated the biological interactions. For instance, Punt et al. (Citation2001) ran MSE simulations to evaluate management strategies for species in the South East Fishery of Australia, and broadly represented biological interactions with an error term applied on the natural mortality within the population dynamics component of the OM. While such methods are advantageous to extend MSE simulations under a single-species context, using OMs that explicitly handle the biological interactions of the resource allows for more informed assessments of the direct and indirect effects between the resource, fishery and ecosystem (Mackinson et al. Citation2018). Because of this, conducting MSE simulations with more complex models is considered an essential practice for ecosystem-based fisheries management (EBFM) (Smith et al. Citation2007; Levin et al. Citation2008, Citation2009; Fogarty Citation2014).
Models that explicitly simulate biological interactions can range vastly in complexity, from simple multispecies models to end-to-end, biogeochemical models. Herein, these models are generally referred to as “ecosystem models.” While there has been significant effort over the years to develop ecosystem models for EBFM (Collie et al. Citation2016), the progress toward conducting MSE simulations with ecosystem models as OMs appears to be limited (Sainsbury et al. Citation2000; Schnute et al. Citation2007; Smith et al. Citation2007; Punt et al. Citation2016a). One challenge is model uncertainty. The more complex a model, the more model parameters and, thus, the greater the model uncertainty, especially when including species with limited available data. This has led to the concern regarding, as Plagányi et al. (Citation2007) put it, how “scientifically defensible and practically useful” the model results could be. Management strategy evaluation, however, is an advantageous process to address the impacts of uncertainty on recommendations resulting from simulations—including model uncertainty. This entails executing MSE simulations across several alternative OMs with different functional structures and/or parameterizations (Sainsbury et al. Citation2000). This is specifically useful for providing fisheries managers with strategic advice (Collie et al. Citation2016; Benson and Stephenson Citation2018). Nicely summarized by Link et al. (Citation2012), “Having ecosystem models embedded as operating models in a management strategy evaluation context frees them from the onus of extensive precision constraints, and instead enables them to be applied to more strategic uses of ecosystem models.” Another challenge is computational constraints, which can become an even greater issue when running various simulations for MSE (Sainsbury et al. Citation2000; Punt et al. Citation2016a). Fortunately, these constraints may soon be less of an obstacle with the assistance of computational tools like statistical emulators (Morzaria-Luna et al. Citation2018).
The progression of the ecosystem approach in marine management relies on using ecosystem models for the evaluation of fisheries management strategies (Smith et al. Citation2007; FAO Citation2008; Levin et al. Citation2009; Link Citation2010b), so it is likely that as challenges become less of an obstacle the number of applications running MSE simulations with ecosystem models would quickly increase (Punt et al. Citation2016a). To assist the progression of using ecosystem models for the evaluation of fisheries management strategies, the present paper aims to assemble and analyze the efforts made so far. While there are summaries of MSE approaches developed to incorporate ecosystem considerations (e.g., Plagányi Citation2016), a review of applications evaluating fisheries management scenarios through marine ecosystem models is lacking in the literature and would provide beneficial information for future MSE simulation applications. Herein, there are three main objectives: (1) making an inventory of applications conducting MSE simulations with OMs explicitly accounting for biological interactions; (2) analyzing the methods undertaken amongst identified applications; and (3) make recommendations for future applications. First, an overview of the methods used herein for conducting the literature review is provided, including (i) the criteria for the modeling frameworks, (ii) the criteria for the MSE simulation process, and (iii) the execution of the literature review. Next, an overview of the identified applications is provided with respect to the modeling frameworks used for the OMs, general foci of the applications, the structures of the MSE simulation frameworks, and the addressed uncertainties and errors. Then, the identified applications are summarized, individually. Lastly, general observations are provided along with recommendations for future applications. A list of the abbreviations used herein is provided in .
Table 1. Abbreviations used throughout this review.
2. Overview of the methods for conducting the literature review
2.1. Food web modeling frameworks
Food web modeling frameworks for the marine ecosystem are diverse in structure and complexity. To identify the modeling frameworks capable of explicitly representing biological interactions, the ecosystem model reviews presented by Plagányi (Citation2007), Espinoza-Tenorio et al. (Citation2012), and O’Farrell et al. (Citation2017) were considered. Current terminologies classify marine ecosystem models into six categories (O’Farrell et al. Citation2017):
conceptual and qualitative models,
extensions of single-species models,
dynamic multispecies models,
aggregated (or whole ecosystem) models,
biogeochemical-based end-to-end models,
coupled and hybrid model platforms.
Models that fall into categories (1) or (2) are not applicable for this review. Conceptual and qualitative models lack temporal simulation capabilities, making these models unsuitable for MSE, and extended single-species models by definition explicitly simulate one focal species, ignoring biological interactions. Thus, only modeling frameworks falling into categories (3)–(6) were considered for this review.
Dynamic multispecies models (category 3) simulate a limited number of species that are ecologically significant with respect to the focal species. Examples include the Globally applicable Area Disaggregated General Ecosystem Toolbox (Gadget) (Begley and Howell Citation2004) and Models of Intermediate Complexity for Ecosystem Assessment (MICE) (Plagányi et al. Citation2014). Aggregated (or whole ecosystem) models (category 4) attempt to study energy flows among ecosystem components by simulating a relatively large number of species that span across all trophic levels. Examples include Ecopath with Ecosim (EwE) (Pauly et al. Citation2000; Christensen and Walters Citation2004; Steenbeek et al. Citation2016) and Comprehensive Aquatic System Models (CASM) (DeAngelis et al. Citation1989; Bartell et al. Citation1999). Biogeochemical-based end-to-end models (category 5) simulate nutrients and planktonic organisms in addition to fish and other top predators—allowing both bottom-up and top-down interactions. Examples include Atlantis (Fulton et al. Citation2004a, Citation2004b; Audzijonyte et al. Citation2019) and the North Pacific Ecosystem Model for Understanding Regional Oceanography (NEMURO) (Kishi et al. Citation2011). Lastly, coupled and hybrid model platforms (category 6) combine different modeling platforms to allow the consideration of bottom-up and top-down interactions. Examples include the Object-oriented Simulator of Marine ecOSystems Exploration (OSMOSE) (Shin and Cury Citation2001) and InVitro (Gray et al. Citation2006).
2.2. MSE simulation process
The MSE simulation process has four main components (): (i) the monitoring model, (ii) the assessment model, (iii) the decision rule, and (iv) the implementation of the management decision. The monitoring model and the assessment model are not essential components for MSE simulations. For instance, Rademeyer et al. (Citation2007) defined MSE simulations with an explicit assessment model as “model-based,” and those lacking an explicit assessment model as “empirical” (a.k.a., “model-free,” “data-based”). The components that are often considered essential for simulating an MSE are the decision rule, for determining the level of management based on the status of the resource, and the implementation routing, for implementing the determined level of management into the OM simulations. Herein, this process is referred to as a “harvest feedback mechanism.” Current best practice guidelines for MSE encourage the inclusion of a harvest feedback mechanism into the simulation process in order to explicitly take into account management reacting to stock status (Punt et al. Citation2016a). Therefore, this review focused on MSE simulation applications that included a harvest feedback mechanism.
2.3. Literature review
A literature review was conducted to identify applications that (i) used an OM that explicitly represents biological interactions, and (ii) included a harvest feedback mechanism. The utilized search engines include ISI Web of ScienceTM, Google Scholar and Google. In addition to applications published through peer-reviewed journals, applications published through gray literature (e.g., technical reports) were also considered as these sources are often overlooked but can be influential (Cordes Citation2004). The search was supplemented through discussions with fisheries scientists and ecosystem modelers. Data processing and visualization were carried out through the statistical software R (R Core Team Citation2017) with the packages ggplot2 (Wickham Citation2016), rgdal (Bivand et al. Citation2019), raster (Hijmans Citation2019), scatterpie (Yu Citation2019), and fmsb (Nakazawa Citation2019). Geospatial data were provided by https://github.com/valentinitnelav/RandomScripts/blob/master/NaturalEarth.RData?raw=true.
3. Overview of identified applications carrying out the MSE simulation procedure through food web models
A total of 56 references that satisfied the specified criteria were identified. To support readability, documents with nearly identical OMs and similar research foci were grouped and are referred to herein as an application. A total of 40 applications were identified, which are overviewed in . Almost half of the applications (45%, n = 40) used aggregated models as OMs. Dynamic multispecies models were the second most common OM model-type used across the applications (32.5%), while biogeochemical-based end-to-end models and coupled and hybrid model platforms were the least common OM model-types used (15% and 7.5%, respectively). All of the identified applications applying aggregated models (n = 18) used EwE models, one of which included Ecospace. Most of the identified applications applying dynamic multispecies models (9 of 13) used general population dynamics models, and few used specific frameworks (two used Gadget, and two used MICE models). All six of the identified applications applying biogeochemical-based end-to-end models used Atlantis models. Two out of the three identified applications applying coupled and hybrid model platforms used OSMOSE models while one application used an InVitro model.
Table 2. Identified applications simulating MSEs through marine ecosystem models with a harvest feedback mechanism.
Aggregated models were more common across the identified applications due to a workshop report from Pitcher and Cochrane (Citation2002) that presents case studies exploring the policy optimization (open-loop simulations; OLSs) and evaluation (closed-loop simulations; CLSs) routines in EwE. Under these routines, users define management strategies with multi-criteria objective functions that specify weights between ecological stability value, social employment value, net economic value, and mandated rebuilding value. Under OLSs a temporal fishing pattern that would optimize the objective function is determined, while under CLSs a fishing pattern with specified errors is simulated while maintaining the target fishing rates in accordance with biomass trends (Pitcher and Cochrane Citation2002; Walters et al. Citation2002; Christensen and Walters Citation2004). For the purpose of this review, only case studies within this report that discussed CLSs (i.e., the MSE component of the routines) were included. In doing so, the applications presented in this single report give a weighted interpretation on the use of EwE as an OM for MSE simulations. For instance, if the case studies from this report were excluded from the identified applications, then dynamic multispecies models would be the most common OM model-type (42%, n = 31), followed by aggregated models (29%), biogeochemical-based models (19%), and hybrid model platforms (10%).
A general focal point was determined for all of the identified applications (). For analysis, focal points were categorized into one of five groups:
species, a single focal species;
functional group, a small group of similar species;
food web, a small predator-prey food web;
fisheries, one or more fisheries within a system; and
other, miscellaneous foci (e.g., exploring the utility of a model tool).
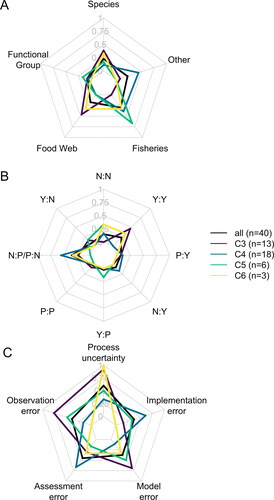
Details of the categorization are presented in (see Online Appendix). To dissect any trends, focal categories are displayed by OM model-type (). Applications using dynamic multispecies models tend to focus on specific food webs (46%, n = 13). Applications using aggregated models tend to focus on fisheries and other miscellaneous foci (39% and 44%, respectively, n = 18). This is observed even after the applications presented in the workshop report from Pitcher and Cochrane (Citation2002) were removed (33% and 33%, respectively, n = 9; , see Online Appendix). Most of the applications using biogeochemical-based models focused more on fisheries (four of the six), and the three applications using hybrid model platforms were evenly split between species, food web, and fisheries foci.
Figure 2. Breakdown of the percentages of the identified applications in relation to general focus (A), simulated MSE structure (B), and addressed uncertainty or error (C). Lines reflect percentages for all of the identified applications (black), all applications using dynamic multispecies models (C3; purple), all applications using aggregated (or whole ecosystem) models (C4; blue), all applications using biogeochemical-based end-to-end models (C5; green), and all applications using coupled and hybrid model platforms (C6; yellow). Simulated MSE structures were categorized into one of eight groups based on the handling of the monitoring model and the assessment model: the inclusion of an explicit model (Yes; Y), the exclusion of an explicit model (None; N), or the use of error to approximate a model (Proxy; P). N:N - no explicit monitoring or assessment models. Y:N - a monitoring model and no assessment model. N:P/P:N - an approximate monitoring model and no assessment model, or no monitoring model and an approximate assessment model. P:P - an approximate monitoring model and an approximate assessment model. Y:P - a monitoring model and an approximate assessment model. N:Y - no monitoring model and an assessment model. P:Y - an approximate monitoring model and an assessment model. Y:Y - a monitoring model and an assessment model.
Various structures of the MSE simulation framework were observed based on the handling of the monitoring model and the assessment model. To analyze this, the structure of the MSE simulation framework was categorized into one of eight groups based on the inclusion of an explicit model (Yes; Y), the exclusion of an explicit model (None; N), or the use of error to approximate a model (Proxy; P):
no explicit monitoring or assessment models (N:N);
a monitoring model with no assessment model (Y:N);
an approximate monitoring model with no assessment model, or no monitoring model with an approximate assessment model (N:P/P:N; these two structures are identical as both incorporate error to the model data before being processed by the decision rule);
an approximate monitoring model with an approximate assessment model (P:P);
a monitoring model with an approximate assessment model (Y:P);
no monitoring model but an assessment model (N:Y);
an approximate monitoring model with an assessment model (P:Y); or
a monitoring model and an assessment model (Y:Y).
Details of the categorization are presented in (see Online Appendix). To dissect any trends, MSE simulation structure is displayed by OM model-type (). Most of the applications using dynamic multispecies models structured the MSE simulation to include an explicit monitoring model and assessment model (46%, n = 13). Over half of the applications using aggregated models structured the MSE simulation without a monitoring model or an assessment model, but applied error to stock status prior to being processed by the decision rule (56%, n = 18). This is observed even after the applications presented in the workshop report from Pitcher and Cochrane (Citation2002) were removed (44%, n = 9; , see Online Appendix). Applications using biogeochemical-based models tend to either lack both a monitoring model and an assessment model (two of the six) or have both a monitoring model and an assessment model (two of the six). Lastly, applications using hybrid model platforms were evenly split between three different structures (). Such structural differences in the applications impact the uncertainties evaluated across the identified applications.
All of the selected documents addressed uncertainty or error in some way, many of which addressed multiple forms of uncertainty or error. To analyze this, each form of uncertainty and error were categorized into one of five groups based on how uncertainties and errors were discussed in the applications, and the categories discussed by Francis and Shotton (Citation1997):
process uncertainty, underlying stochasticity in ecological dynamics (e.g., recruitment variability);
observation error, errors in the process of sampling the population;
assessment error, errors in the process of assessing stock status;
model error, errors in the models used to describing dynamics—either functional form or parameterization; and
implementation error, error in the implementation of a management policy.
Details of the categorization are presented in (see Online Appendix). To dissect any trends, explored uncertainties and errors are displayed by OM model-type (). Process uncertainty and assessment error (categories i and iii) were most commonly addressed throughout all of the identified applications (60% and 45%, respectively, n = 40). Process uncertainty (category i) was commonly addressed across applications using dynamic multispecies models (92%, n = 13), followed by observation error and model error (77% and 69%, respectively). Assessment error and implementation error (categories iii and v) were commonly addressed across applications using aggregated models (67% and 61%, respectively, n = 18). This was true even if the applications presented in the workshop report by Pitcher and Cochrane (Citation2002) are removed (78% and 67%, respectively, n = 9; , see Online Appendix). Process uncertainty, observation error, and model error (categories i, ii, and iv, respectively) were most commonly addressed across the six applications using biogeochemical-based models (). All three of the applications using hybrid model platforms addressed at least process uncertainty.
The identified applications associate with a variety of regions all over the globe (). Most applications relate to waters around North America (30%; n = 40), Europe (20%), and Australia (18%), and few relate to waters around South America (10%), Antarctica (8%), Africa (5%), and Asia (5%). Two of the applications (5%, n = 40) do not relate to any one aquatic ecosystem but are rather multi-system comparisons (). Aggregating applications by associated continents, applications using either dynamic multispecies models or aggregated models comprise all of the continents to varying degrees (). Applications using aggregated models tend to be more common (), but this is influenced by the applications presented in the workshop report from Pitcher and Cochrane (Citation2002). When these applications are excluded then applications using multispecies models are more common, especially around Europe and North America (, see Online Appendix). Applications associated to regions around North America or Australia comprise all four modeling categories, which is understandable given that these areas also have more applications (). Continents with the most applications (i.e., North America, Australia, and Europe), however, are not as diverse in general focus (). For instance, almost half of the identified applications around North America generally focus on a single species (42%, n = 13). When the case studies from the Pitcher and Cochrane (Citation2002) workshop report are excluded, this percentage is even larger (50%, n = 10; , see Online Appendix).
Figure 3. Global distribution of the identified applications. Most applications focus on a single aquatic ecosystem (polygons), while other applications focus on multiple aquatic ecosystems for a multi-region comparison (points). Polygon shade indicates the number of identified documents that pertain to that region (see legend). Points indicate the individual regions included in the multi-region comparison applications: triangles (Pikitch et al. Citation2012), and circles (Kaplan et al. Citation2020).
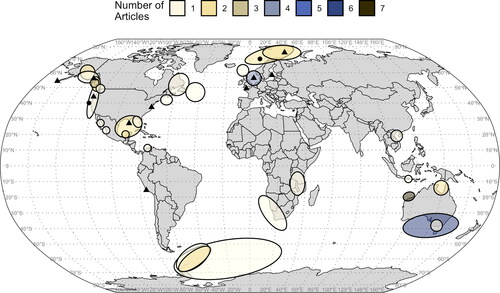
Figure 4. Global distribution of Operating Model (OM) category. The two multi-system comparison applications are not included in this figure. Pie charts represent the proportions of the four OM categories overlaid on the continents associated with the investigated water bodies (). Colors on the pie chart indicate the OM category: dynamic multispecies models (C3; purple), aggregated (or whole ecosystem) models (C4; blue), biogeochemical-based end-to-end models (C5; green), and coupled and hybrid model platforms (C6; yellow). Size of the pie chart indicates the total number of identified applications associated with that continent.
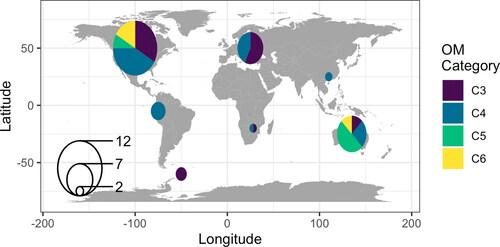
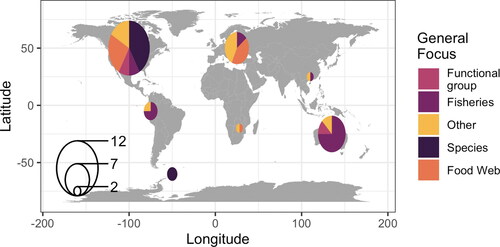
Figure 5. Global distribution of general foci. The two multi-system comparison applications are not included in this figure. Pie charts represent the proportions of the five general focus categories overlaid on the continents associated with the investigated water bodies (). Colors on the pie chart indicate the general focus category (see legend). Size of the pie chart indicates the total number of identified applications associated with that continent.
4. Summaries of identified applications
The identified applications are summarized below. The summaries provided here focus on the modeling of the MP, but some of the documents cover extensive research projects. To aid the reader, applications are organized by content and geographic region.
4.1. Africa
Two applications around Africa were identified: one of the waters off the Southwest coast (Punt and Butterworth Citation1995), and one of Lake Malawi (Nsiku Citation2002).
Punt and Butterworth (Citation1995) assessed the effects of the culling of Cape fur seals (A. pusillus pusillus) on catches and catch rates of the bottom-trawl Cape hake fishery off the Southwest African coast. The OM, presented by the authors, was a minimally realistic multispecies model with (i) an age-structured population dynamics model for hake—including both hake species (M. capensis and M. paradoxus), cannibalism, and interspecific predation, (ii) an age- and sex-specific deterministic population dynamics model for seals, and (iii) an age-specific model for a general group of other predatory fish. The MSE approach outlined by the Benguela Ecology Programme Workshop on Seal-Fishery Biological Interactions (Butterworth and Harwood Citation1991) was used. The simulated MSE framework included a monitoring model, which collected catch rate and biomass data from the OM, and an assessment model, which reflected the existing hake assessment model at the time. Simulated scenarios included variations in the OMs assumptions and parameterizations. Results showed that the potential effects of seal culls on the South African bottom-trawl Cape hake fishery were small but could be detrimental. This result was, however, sensitive to the prey-preference of fur seals for Cape hake.
Nsiku (Citation2002) aimed to identify ideal policies for the exploitation and conservation of fish stocks in Lake Malawi. The OM, presented by the authors, was an EwE model of Lake Malawi. The application was carried out with the policy optimization (OLSs) and evaluation (CLSs) routines in EwE (Pitcher and Cochrane Citation2002). Under these routines, management strategies are defined with multi-criteria objective functions that specify weights between ecological stability value, social employment value, net economic value, and mandated rebuilding value. Nsiku (Citation2002) considered five strategies (four maximizing each criterion individually and one maximizing all four criteria evenly) with various functional group vulnerability factors. First, the optimal fishing patterns were determined for each strategy by carrying out OLSs, then these optimal fishing patterns were evaluated by carrying out CLSs. Although the policy evaluation routine in EwE lacks explicit monitoring and assessment sub-models, it is possible to add error to information presented to the decision rule, however, it was not clear if/how the authors used error. Simulated management resulted in reduced performance, especially when considering economic and social performance indicators. Moreover, higher vulnerabilities had a tendency to reduce the performance of the strategies. Nsiku (Citation2002) concludes that strategies reducing effort from the current levels ultimately optimize both exploitation and conservation goals for Lake Malawi.
4.2. Antarctica
Three MSE applications around Antarctica were identified: two within statistical reporting area 48 of the Commission for the Conservation of Antarctic Marine Living Resources (CCAMLR) (Thomson et al. Citation2000; Hill and Cannon Citation2013), and one of the small-scale management units (SSMUs) of the Scotia Sea (Plagányi and Butterworth Citation2006b, Citation2007).
Thomson et al. (Citation2000) presented an approach to determine an advisable annual catch limit for Antarctic krill (E. superba) that considers the dietary needs of predators. The OM, presented by the authors, consisted of (i) the single-species age-specific krill yield model developed by CCAMLR, (ii) an age-structured population dynamics model of a predator population, which was based on Antarctic fur seals (A. gazella) for a case study, and (iii) a function quantifying the effect of krill fishing on the predator population size. The simulated MSE framework included a monitoring model, which included observation error, but lacked an assessment model. Biomass estimates of krill were provided to the decision rule to calculate the annual catch limit. Simulated scenarios included variations in the OMs parameterization and stochasticity. Although recommended krill fishing levels were computed, Thomson et al. (Citation2000) concludes that they would likely lead to greater depletion of the predator (i.e., seal) population as simulation tests showed these values to be biased upwards. As a result, the outputs from this method are much too imprecise for practical application (Butterworth and Punt Citation2003).
Hill and Cannon (Citation2013) explored whether a feedback approach could achieve the multiple objectives of EBFM of Antarctic krill fisheries. The authors used Model Predictive Control (i.e., a control method capable of refining itself in response to the current state of the system) to develop an HCR that achieves objectives for the harvested species (i.e., krill), the predators, and the fishery. The OM, presented by the authors, consisted of (i) a single-species, area-specific biomass dynamics model for harvested species, and (ii) an area-specific biomass dynamics model for predators that depended on the model for harvested species. Although the simulated evaluation framework did not explicitly model monitoring or assessment, error was incorporated to state variables in order to represent observation and assessment errors. For the decision rule, the optimal control law (i.e., sequence of area-specific catch limits) was computed using an optimization method called quadratic programming. Simulated scenarios included configurations with and without the Model Predictive Control procedure. Ultimately, Hill and Cannon (Citation2013) concludes that the feedback approach for management is both feasible and a more effective way, than fixed catch limits, to achieve multiple objectives.
Plagányi and Butterworth (Citation2006b, Citation2007) demonstrated an MSE for advising the subdivision of the Antarctic krill catch limits among the SSMUs of the Scotia Sea so that the possible impacts on land-breeding predators were considered. The OM, presented by the authors, was a spatial, age-structured, multispecies population dynamics model coded in AD Model Builder (Fournier et al. Citation2012). Plagányi et al. (Citation2007) expanded upon the OM used by Plagányi and Butterworth (Citation2006b), including the addition of more krill-predators. Plagányi and Butterworth (Citation2006b) focused on the krill-predators penguins and seals, while Plagányi et al. (Citation2007) expanded the OM to include whales and fish. The simulated MSE framework included a monitoring model that gathered data on krill and predators for each of the SSMUs but lacked an assessment model (illustrative MSE simulations that included an assessment model were mentioned but not discussed in detail). Simulated scenarios included variations in the fishing management scenarios, the OM, and the MSE simulation structure. Plagányi and Butterworth (Citation2006b, Citation2007) concludes that the inclusion of a harvest feedback mechanism resulted in improved performance of strategies within the SSMUs of the Scotia Sea. Specifically, the computation of precautionary krill catch limits resulted in the partial reversal of the downward abundance trends observed for predators within each management unit (Plagányi and Butterworth Citation2006b, Citation2007). Moreover, Plagányi et al. (Citation2007) points out that the implemented improvements to the OM reduced the risk of simulated management decisions responding to noise.
4.3. Asia
Two applications around Southeast Asia were identified: one of the Bali Strait (Buchary et al. Citation2002), and one of the Gulf of Tonkin (a.k.a., Beibu Gulf) (Chen et al. Citation2008). Both applications were carried out with the policy optimization (OLSs) and evaluation (CLSs) routines in EwE (Pitcher and Cochrane Citation2002). Under these routines, management strategies are defined with multi-criteria objective functions that specify weights between ecological stability value, social employment value, net economic value, and mandated rebuilding value. Both applications considered four strategies under various functional group vulnerability factors (three maximizing the ecological, economic, and social criteria individually and one maximizing these three criteria evenly). First, the optimal fishing patterns were determined for each strategy by carrying out OLSs, then these optimal fishing patterns were evaluated by carrying out CLSs.
Buchary et al. (Citation2002) aimed to explore multispecies management strategies of the Bali Strait within an ecosystem context. The OM, presented by the authors, was an EwE model of the Bali Strait. The simulated MSE framework lacked explicit monitoring and assessment sub-models, and it was not clear if/how the authors used error to incorporate uncertainty to data provided to the decision rule. Buchary et al. (Citation2002) did not make any policy recommendations as the study was an exercise to test the usefulness of the presented OM, which the authors conclude could have a useful role in fisheries management. Buchary et al. (Citation2002) argues that improvements to the OM are necessary, specifically the incorporation of the southern oscillation index as it appears to explain some of the variability in the Lemuru (S. lemuru) fishery—the ecosystems most dominant fishery.
Chen et al. (Citation2008) evaluated how the Gulf of Tonkin ecosystem may respond to different fisheries management scenarios. The OM was an EwE model of the Gulf of Tonkin (Chen et al. Citation2006). The simulated MSE framework lacked explicit monitoring and assessment sub-models, but Chen et al. (Citation2008) used error to incorporate uncertainty to data provided to the decision rule—the authors associated this to assessment error. Chen et al. (Citation2008) found that the socioeconomic-driven management strategy reduced ecosystem biodiversity, specifically depleting higher-trophic-level groups. Results from the ecology-driven management strategy and combination management strategy were generally consistent across vulnerability settings. Chen et al. (Citation2008) concludes that the combination management strategy would be optimal to balance conflicting fishery and conservation goals.
4.4. Australia
Eight applications around Australia were identified: two of the Northwest Shelf (Sainsbury Citation1991; Sainsbury et al. Citation1997; Fulton et al. Citation2006; Hatfield et al. Citation2006; Little et al. Citation2006; McDonald et al. Citation2006, Citation2008), one of the Gulf of Carpentaria (Bustamante et al. Citation2011; Dichmont et al. Citation2013), one of Port Phillip Bay (Fulton and Smith Citation2002), and four of the Southeast region (Fulton et al. Citation2007, Citation2014, Citation2016, Citation2019; Smith et al. Citation2015a; Dichmont et al. Citation2017).
4.4.1. The Northwest Shelf
Sainsbury (Citation1991) and Sainsbury et al. (Citation1997) illustrated MSEs on a tropical fishery off the Northwest coast of Australia. The OM, a multispecies model described in greater detail by Sainsbury (Citation1991), considered the four main fish-stocks, Lethrinus, Lutjanus, Nemipterus, and Saurida spp. Four structures of the OM were considered, two of which incorporated negative, intraspecific impacts between stocks. Moreover, two parameterizations were considered for each OM. The simulated MSE framework included a monitoring model that collected data during a “learning period,” and an assessment model. The application examined five monitoring models for collecting data during a learning period, and four long-term MPs for implementation after the learning period. The objective of Sainsbury (Citation1991) and Sainsbury et al. (Citation1997) was novel in that it aimed to identify the relative potential of different MPs, which involved closed areas and gear selections, to distinguish competing hypotheses and enhance future benefits (Butterworth and Punt Citation2003). Sainsbury (Citation1991) and Sainsbury et al. (Citation1997) concludes that the results suggest an MP including spatial and temporal management of the trawl fishery has scientific and economic merit for resolving key management uncertainties.
The next application was a product of the North West Shelf Joint Environmental Management Study (NWSJEMS) to demonstrate outcomes of management strategies and develop scenarios. It is described in detail in three companion reports by Little et al. (Citation2006), Fulton et al. (Citation2006), and Hatfield et al. (Citation2006), and illustrated as an example by McDonald et al. (Citation2006, Citation2008). The OM was an InVitro model of the Northwest Australian Shelf (Gray et al. Citation2006). This OM considered an area smaller than that considered by Sainsbury (Citation1991) and Sainsbury et al. (Citation1997), but simulated key marine biota and sectors (i.e., oil and gas, fisheries, conservation and coastal development). The simulated MSE framework included a monitoring model to compute indicators that were either passed to an assessment model to compute information to pass to the decision rules or passed directly to the decision rules. The assessment models were based on the assessment models described by the Western Australian Department of Fisheries (Gray et al. Citation2006). Decision rules were based on the objectives identified in discussions with stakeholders and management bodies of Western Australia. Simulated scenarios included various management strategies and OM specifications in order to assess effectiveness of management strategies, as well as uncertainty regarding the development (i.e., infrastructure, residential and industrial), productivity, and resilience of the system. Much was observed from the results (see Little et al. (Citation2006) for details), and one main observation was that the integrated management strategy balanced impacts across a range of sectoral activities.
4.4.2. The Gulf of Carpentaria
Bustamante et al. (Citation2011) and Dichmont et al. (Citation2013) explored the effectiveness of marine spatial management options for the Gulf of Carpentaria while considering the opposing fisheries and conservation objectives. The OM, described by the authors, merged a multiple-single-species population dynamics model of prawns harvested by the Northern Prawn Fishery (i.e., Dichmont et al. Citation2006, Citation2008) with an EwE with Ecospace model of the Gulf of Carpentaria (Bustamante et al. Citation2011). The MSE framework consisted of a single OM with two separate MPs: one for large-scale fleet dynamics (which informed the Northern Prawn Fishery model), and one for small-scale fleet dynamics (which informed the Gulf of Carpentaria ecosystem model). This review focused on the MSE framework around the ecosystem model (i.e., the small-scale fleet dynamics). The simulated MSE framework lacked a monitoring model but included an assessment model. The assessment model consisted of a trawling effects model (Ellis et al. Citation2008), which provided ecosystem indicators that were used to inform decisions regarding the opening of marine closures within the Gulf of Carpentaria. Simulated scenarios included variations in spatial closure scenarios that aimed to modify the spatial distribution of trawling impacts on benthos within the Gulf of Carpentaria while maintaining the fisheries stock and economics targets. Dichmont et al. (Citation2013) concludes that this exercise illustrates the possibility of linking existing tools together into effective MSE frameworks, and that a suite of management tools is necessary as no single management tool satisfies all objectives.
4.4.3. The Port Phillip Bay
Fulton and Smith (Citation2002) aimed to explore the impacts of different fisheries management strategies on the Port Phillip Bay ecosystem. The OM, described by the authors, was an EwE model of Port Phillip Bay. The application was carried out with the policy optimization (OLSs) and evaluation (CLSs) routines in EwE (Pitcher and Cochrane Citation2002). Under these routines, management strategies are defined with multi-criteria objective functions that specify weights between ecological stability value, social employment value, net economic value, and mandated rebuilding value. Fulton and Smith (Citation2002) considered eight strategies under different settings of functional group vulnerability. Six of the strategies were defined by multi-criteria objective functions (different weights on the ecological, economic, and social criteria), and two of the strategies were “sketched” using the simulation interface in Ecosim (users can sketch-out fishing rates by fleet/gear or functional group over time using Ecosim in “gaming” mode; Christensen and Walters Citation2004). First, OLSs were carried out to determine the optimal fishing patterns for the six strategies defined by objective functions, then these optimal fishing patterns were evaluated by carrying out CLSs. For the two “sketched” strategies, they were immediately evaluated with CLSs after being sketched (i.e., they were not optimized with OLSs). Although the policy evaluation routine in EwE lacks explicit monitoring and assessment sub-models, it is possible to add error to information presented to the decision rule, however, it was not clear if/how the authors used error. Fulton and Smith (Citation2002) concludes that careful consideration is required when selecting criteria to define management strategies, and that all groups must have some level of importance to achieve an ecologically robust system.
4.4.4. The Southeast region
The applications associated with the marine ecosystem off Southeast Australia all stem from a series of Atlantis models developed for the evaluation of management strategies of the Southeastern fisheries, specifically: the Australian Southern and Eastern Scalefish and Shark Fishery (SESSF), and the Small Pelagics Fishery (SPF).
Fulton et al. (Citation2014, Citation2007) carried out a series of simulations for MSE to reassess the management of the SESSF. The motivation stemmed from the project “Evaluation of alternative strategies for management of Commonwealth fisheries in south eastern Australia.” In the first stage of this project (Smith et al. Citation2004), an MSE analysis of SESSF management scenarios was carried out with a qualitative method. In the second stage of this project (Fulton et al. Citation2007), an ecosystem modeling approach was used to carry out a quantitative MSE analysis of SESSF management scenarios. Fulton et al. (Citation2007) first presented the OM, an Atlantis of the marine ecosystem off Southeast Australia. This model is referred to as “Atlantis-SE,” but it has also been called “Atlantis-AMS” (Fulton et al. Citation2019). Next, Fulton et al. (Citation2007) used Atlantis-SE to simulate SESSF management scenarios resulting from the first stage of the project, as well as additional scenarios arising from stakeholder meetings. Preliminary simulations carried out by Fulton et al. (Citation2007) included a monitoring model and assessment model, but this proved to be computationally unreasonable at the time. Thus, the simulated MSE framework used by Fulton et al. (Citation2007) lacked a monitoring model but approximated an assessment model with error. Fulton et al. (Citation2014) expanded upon Fulton et al. (Citation2007), testing updated scenarios developed and approved by a stakeholder steering committee. This included expanding the simulated MSE framework to include a monitoring model to collect fishery-dependent data for the MP (the assessment model was still approximated with error). The MP within Atlantis-SE was quite sophisticated in that it included several management controls, and the dynamic setting of quota and spatial management were most frequently used across scenarios (Fulton et al. Citation2007). Both applications found that no single strategy proved to optimally perform across the system, but those integrating a variety of measures performed the best (Fulton et al. Citation2007, Citation2014).
Fulton et al. (Citation2016) and Dichmont et al. (Citation2017) continued exploring the development of SESSF management strategies, but with respect to data availability (i.e., data-rich vs data-limited). The OM was a revised version of the Atlantis-SE model used by Fulton et al. (Citation2014), referred to as “Atlantis-RCC.” The key difference between Atlantis-SE and Atlantis-RCC is that Atlantis-RCC allows for variation in size-at-age within a cohort at each location (Fulton et al. Citation2016; Dichmont et al. Citation2017). The simulations included a monitoring model to collect fishery-dependent data for the MP. The sophistication of the monitoring model depended on the simulated management strategy. Strategies corresponding to data-rich situations received a variety of data from the monitoring model (e.g., catch length- and age-compositions), while strategies corresponding to data-limited situations received minimal data (e.g., catch). The simulations also included an assessment model, which was a Stock Synthesis model (Methot and Wetzel Citation2013). Although Fulton et al. (Citation2016) and Dichmont et al. (Citation2017) used similar OMs and simulated management scenarios for the same 14 species, the simulated management strategies for the SESSF varied. Simulated management strategies set the total allowable catch (TAC) for the SESSF based on (i) the recommended catch from the HCR, (ii) a meta-rule (an additional constraint to prevent the TAC from changing more than a specified percentage from year to year), and (iii) a risk equivalency buffer (a factor attempting to achieve risk equivalency between data-poor strategies and data-rich strategies). Fulton et al. (Citation2016) explored strategies based on three HCRs under two variations for determining the buffer. Dichmont et al. (Citation2017) explored strategies based on eight HCRs, the three explored by Fulton et al. (Citation2016) in addition to updated versions that had been applied in other Australian federally managed fisheries, under two variations for the meta-rule. While the simulated HCRs were able to shift the biomass of focal stocks to more ideal ranges (Fulton et al. Citation2016), scenarios dependent on more data from the OM resulted in improved management (Dichmont et al. Citation2017).
Fulton et al. (Citation2019) continued exploring SESSF management strategies to evaluate how the level of management (i.e., single-species to EBM) and management challenges (i.e., jurisdiction) impact ecosystem performance. Both Atlantis-SE (Fulton et al. Citation2014) and Atlantis-RCC (Fulton et al. Citation2016; Dichmont et al. Citation2017) were utilized for this study. At the time, multiple parameterizations of Atlantis-SE were available while just one parameterization of Atlantis-RCC was available. Simulations with the Atlantis-SE OMs were used to explore the implications of managing only one part of an ecosystem (i.e., differential management across jurisdictions), while simulations with Atlantis-RCC were used to explore the implications of managing the broader ecosystem (i.e., tiered harvest strategies applied to individual species or species-combinations). The simulated MSE framework differed according to the scenario but, generally, a monitoring model and assessment model were included. Simulated scenarios included variations in single-species, multispecies, and EBFM management scenarios for the SESSF, some of which were based on simulated scenarios from previous applications (Fulton et al. Citation2014, Citation2016; Dichmont et al. Citation2017). Some of the key take-aways found by Fulton et al. (Citation2019) include (i) ecosystem- and multispecies-based management scenarios outperform single-species management scenarios, and (ii) multispecies yield-oriented scenarios can result in higher total catches without a notable decline in overall system performance, albeit resulting in a system structure different to that obtained with other forms of EBFM.
Smith et al. (Citation2015a) aimed to use the ecosystem modeling approach to provide advice on the reference points and exploitation rates for the four main target species of the Commonwealth Small Pelagics Fishery (SPF). The OM was a revised version of Atlantis-SE used by Fulton et al. (Citation2007), called “Atlantis-SPF.” One of the key differences in Atlantis-SPF is the refining of the functional groups to improve the representation of prey and predator species associated with the SPF target species. The simulations included a monitoring model but lacked an assessment model. Simulated scenarios included variations in harvesting rules and survey structures. Results suggest that the target reference points for the four main target species of the SPF should be set at 50% of the unfished biomass while the limit references points set at 20% of the unfished biomass. Moreover, results suggest that the target exploitation rates for SPF target species should be species-specific (possibly stock-specific).
4.5. Europe
Seven applications around Europe were identified: one of the Faroe Islands (Zeller and Freire Citation2002); three within the Norwegian and Barents Seas (Hagen et al. Citation1998; Schweder et al. Citation1998, Citation2000; Howell and Bogstad Citation2010), and three of the North Sea (Mackinson Citation2002; Scientific, Technical and Economic Committee for Fisheries (STECF) Citation2015; Mackinson et al. Citation2018; Thorpe and De Oliveira Citation2019).
4.5.1. The Faroe Islands
Zeller and Freire (Citation2002) aimed to test the policy optimization (OLSs) and evaluation (CLSs) routines in EwE (Pitcher and Cochrane 2002). The OM, presented by the authors, was an EwE model of the Faroe Islands. Under these policy routines, management strategies are defined with multi-criteria objective functions that specify weights between ecological stability value, social employment value, net economic value, and mandated rebuilding value. Zeller and Freire (Citation2002) considered four strategies (three maximizing the ecological, economic, and social criteria individually and one maximizing these three criteria evenly). First, the optimal fishing patterns were determined for each strategy by carrying out OLSs, then these optimal fishing patterns were evaluated by carrying out CLSs. The simulated MSE framework (CLSs) lacked explicit monitoring and assessment sub-models, but Zeller and Freire (Citation2002) used error to incorporate uncertainty to data provided to the decision rule—the authors associated this to assessment error. Zeller and Freire (Citation2002) stresses that the exercise was preliminary and concludes that the OM was in need of further development, strategies in need of fine-tuning, and the policy routines in EwE may need further development (as the routines were test versions at the time).
4.5.2. The Norwegian and Barents Seas
Applications of the Barents Sea focused on the underlying food web between the main fisheries (for cod, Gadus morhua, capelin Mallotus villosus, and Norwegian Spring spawning herring, Clupea harengus) and whaling (minke whales, Balaenoptera acutorostrata) because of the strong interactions amongst the species.
Hagen et al. (Citation1998) aimed to evaluate fisheries management regimes in the Barents Sea. The OM, described by the authors, was a multispecies model consisting of (i) age- and length-distributed population dynamics models for cod, capelin, and herring, and (ii) a model for cod predation on capelin, herring, and young cod. Moreover, proxy variables were added to some aspects of the population dynamics models to account for process uncertainty. The simulated MSE framework included a monitoring model, which implements acoustic stock estimates for herring and capelin as well as tuning indices for cod, and assessment models. The assessment models for cod and herring were VPA-based, and the assessment model for capelin was based on CapTool (Bogstad et al. Citation1992). Simulated scenarios included probing scenarios, for exploring the impacts of varied natural mortality and fishing mortality, and uncertainty scenarios, for exploring variations in recruitment, factors related to the human dimension, and management strategies. This application allowed Hagen et al. (Citation1998) to weigh the tradeoffs between the three fisheries. For instance, the results suggested that a mixture of strategies with higher fishing mortality on cod and higher spawning stock target for capelin is ideal for both the capelin and cod fisheries as higher fishing pressure on cod releases capelin from predation pressure, but this comes with the risk that the cod stock could crash following a poor recruitment event.
Schweder et al. (Citation1998, Citation2000) illustrated how MSEs could provide information regarding the impacts regulated whaling may have on fisheries of the Northeast Atlantic. Butterworth and Punt (Citation2003) noted that the Schweder et al. (Citation1998) analysis was similar to that from Punt and Butterworth (Citation1995; see the Africa subsection). The OM, described by the authors, was a spatial multispecies model consisting of (i) an age- and length-specific model simulating the individual dynamics of cod, capelin, and herring (Hagen et al. Citation1998), (ii) the age- and sex-specific population dynamics model of minke whales specified by the Scientific Committee of the IWC for implementing trials of the Revised Management Procedure (RMP; IWC Citation1993, Citation1994), and (iii) a predation model linking the whale model to the fish model. The simulated MSE framework included a monitoring model, and assessment models. The assessment model for whales was based on the RMP method (IWC Citation1993), the assessment models for cod and herring were VPA-based, similar to Hagen et al. (Citation1998), and the assessment model for capelin was based on CapTool (Tjelmeland and Bogstad Citation1998). Simulated scenarios were a combination of parameterizations for whale productivity, cod recruitment, herring recruitment, the predation model, whale observer bias, fixed fishing mortality rates for cod and herring, and the RMP. Schweder et al. (Citation1998) concludes that a clear outcome for the study was that larger whale stocks lead to smaller long-term catches of cod and herring due to the increased predation pressure from whales. Thus, although unclear for herring, the cod fishery benefited from increased whaling. The impacts of model uncertainty were discussed by both publications. Schweder et al. (Citation2000) notes that identifying a “good and realistic model” of the studied system would be a large undertaking.
Howell and Bogstad (Citation2010) presented a tool for modeling key stocks, their interactions, and the assessment process in order to evaluate HCRs and predict potential impacts from environmental changes. The OM, an extension of the Lindstrøm et al. (Citation2009) model, consisted of an age-length structured, multispecies Gadget model that represented minke whales, cod, herring, and capelin, as well as krill and three “other food” groups. The simulated MSE framework included a monitoring model and assessment models for cod and capelin. The assessment models were consistent with the standard stock assessments done by ICES (Citation2009) and programmed using fisheries libraries in R (FLR package; Kell et al. Citation2007). Simulated scenarios included variations in the cod HCR, herring recruitment, and cod recruitment. Howell and Bogstad (Citation2010) found the current management rules to be robust to the explored scenarios, but they highlight that further development in incorporating greater biological realism into the OM and random variations would result in a tool suitable for full multispecies MSE.
4.5.3. The North Sea
Mackinson (Citation2002) aimed to test the policy optimization (OLSs) and evaluation (CLSs) routines in EwE (Pitcher and Cochrane Citation2002). The OM was an EwE model of the North Sea (Mackinson Citation2000). Under these policy routines, management strategies are defined with multi-criteria objective functions that specify weights between ecological stability value, social employment value, net economic value, and mandated rebuilding value. Mackinson (Citation2002) considered four strategies (three maximizing the ecological, economic, and social criteria individually and one maximizing these three criteria evenly). First, the optimal fishing patterns were determined for each strategy by carrying out OLSs. Then, CLSs were carried out for the optimal strategy, which was the strategy maximizing the individual criteria evenly, under different methods for estimating F, variations in assessment error, and variations in catchability. The simulated MSE framework (CLSs) lacked explicit monitoring and assessment sub-models, but Mackinson (Citation2002) used error to incorporate uncertainty to data provided to the decision rule—the author associated this to assessment error. Mackinson (Citation2002) concludes that the policy routines in EwE offer a significant contribution to the EwE software, and that users should refrain from providing advice based on criteria scores as they allow the ranking of policies and do not offer clear management direction.
To support impact assessments of EU proposals for a multiannual plan covering the demersal fisheries in the North Sea, quantitative evaluations were presented by the Expert Working Group of the STECF (STECF Citation2015) and Mackinson et al. (Citation2018). The STECF (Citation2015) considered structurally different OMs, including an EwE model of the North Sea. The STECF (Citation2015) used an earlier version of the EwE model (ICES Citation2011; Mackinson Citation2014), and Mackinson et al. (Citation2018) used a revised version of the EwE model (Stäbler et al. Citation2014, Citation2016; ICES Citation2016c). The simulated MSE framework (Mackinson et al. Citation2017) included: (i) creating 1000 versions of the base OM using sampling distributions of the inputs, and (ii) evaluating strategies with all OMs using the MSE plug-in within Ecosim (Steenbeek et al. Citation2016). Because the MSE plug-in did not have an explicit monitoring sub-model at that time, a monitoring model was approximated by applying observational error to the average biomass of each assessed group predicted by the OM over the previous twelve months in the simulation. Moreover, it was not practical to simulate complex assessments for multiple groups with the MSE plug-in yet, so stock assessments were modeled by computing a weighted average of the “survey biomass” (Walters Citation2004; Mackinson et al. Citation2018). Scenarios simulated by STECF (Citation2015) included variations of HCR structural form, low and high F reference points, and the use of “safeguards” (i.e., reduction of fishing pressure if the stock status dropped below a threshold-similar to the constant escapement HCR). Scenarios simulated by Mackinson et al. (Citation2018) were developed based on the key dimensions specified in the multiannual plan. Using EwE as an OM allowed the authors to assess how species interactions may hinder strategies from reaching biomass targets, and how predators of the targeted fish-species, which includes species of conservation interest, are noticeably impacted by changes in management. Moreover, Mackinson et al. (Citation2018) concludes that this work progressed the application of ecosystem-based MSEs closer to providing support to ICES integrated advice approach.
Thorpe and De Oliveira (Citation2019) evaluated possible reference levels of fishing community maximum sustainable yield (FCMSY) in terms of their levels of risk and reward across the marine community. The OM was an ensemble of size-based, multispecies population dynamics models of the North Sea fish community (Thorpe et al. Citation2017). The simulated MSE framework applied error to SSBs to approximate a monitoring model and lacked an assessment model. Decision rules updated fishing mortalities for 21 species-specific groups. Five sets of FCMSYs, each of which described fishing mortalities for the individual 21 groups, were considered: (i) single-species estimates (Thorpe et al. Citation2015), (ii) 21-stock stochastic Nash equilibrium (Thorpe et al. Citation2017), and (iii–v) top, middle, and bottom of the 2017 ICES “pretty good yield” ranges (Thorpe and De Oliveira Citation2019). Simulated scenarios included combinations of HCR functional form, candidate FCMSYs, and risk threshold. Moreover, Thorpe and De Oliveira (Citation2019) simulated some of the scenarios described by Mackinson et al. (Citation2018), but results were not discussed in detail as these scenarios made modest impacts. Thorpe et al. (Citation2017) discussed various findings, such as the highest yields resulting from FCMSY based on the 21-stock stochastic Nash equilibrium. One conclusion made by Thorpe et al. (Citation2017) is that the implementation of an HCR that reduces fishing as stock status deteriorates is more important than the precise thresholds.
4.6. North America
Twelve applications around North America were identified: one of the Prince William Sound (Okey Citation2002; Okey and Wright Citation2004), one of the Gulf of Alaska (A’mar et al. Citation2010), one of the Pacific North Coast Integrated Management Area (PNCIMA; Guo et al. Citation2019, Citation2020), two of northern British Columbia (Surma et al. Citation2018; Lam et al. Citation2019), one of the Strait of Georgia (Martell et al. Citation2002), one of the California Current (Punt et al. Citation2016b), one of the West Florida Shelf (Grüss et al. Citation2016b), one of the Gulf of Mexico (Masi et al. Citation2018), one of the Gulf of Maine (Deroba et al. Citation2019), one of the Flemish Cap (Pérez-Rodríguez et al. Citation2019), and one of the Newfoundland-Labrador shelf (Vasconcellos et al. Citation2002).
4.6.1. The Northeast Pacific Ocean
Okey (Citation2002) and Okey and Wright (Citation2004) explored the tradeoffs of management strategies for the Prince William Sound. Some focus was put into constructing a compromise fishing strategy that would increase the biomass of harbor seals (P. vitulina richardsi) as a legal mandate had called for the stabilization of the stock (Exxon Valdez Oil Spill Trustee Council Citation2002). The OM was an EwE model of the Prince William Sound (Okey and Pauly Citation1999a, Citation1999b). The application was carried out with the policy optimization (OLSs) and evaluation (CLSs) routines in EwE (Pitcher and Cochrane Citation2002). Under these routines, management strategies are defined with multi-criteria objective functions that specify weights between ecological stability value, social employment value, net economic value, and mandated rebuilding value. Okey (Citation2002) and Okey and Wright (Citation2004) considered five strategies (three maximizing the ecological, economic, and social criteria individually and two defining compromises across these three criteria). First, the optimal fishing patterns were determined for each strategy by carrying out OLSs, then these optimal fishing patterns were evaluated by carrying out CLSs. The simulated MSE framework (CLSs) lacked explicit monitoring and assessment sub-models, but Okey (Citation2002) and Okey and Wright (Citation2004) used error to incorporate uncertainty to data provided to the decision rule—the authors associated this to assessment error. Okey (Citation2002) and Okey and Wright (Citation2004) found that management was more successful when the objective functions favored ecological benefits, and less successful when the objective functions favored economic benefits. Okey (Citation2002) and Okey and Wright (Citation2004) concludes that a management strategy aimed toward the conservation of harbor seals was achievable.
A’mar et al. (Citation2010) examined the impacts of time-dependent predation on the performance of the current management strategy for the Gulf of Alaska walleye pollock (T. chalcogramma) fishery. The OM, described by the authors, was a multispecies population dynamics model consisting of (i) an age-structured model for Gulf of Alaska pollock, and (ii) age-aggregated production models for each of the three main predators: arrowtooth flounder (Atheresthes stomias), Pacific cod (G. macrocephalus), and Pacific halibut (Hippoglossus stenolepis). The Gulf of Alaska pollock model was similar to the original stock assessment model but with the addition of time-varying natural mortality. Annual natural mortality-at-age caused by the individual predators was computed based on one of three Hollings predator functional responses (Holling Citation1965; A’mar et al. Citation2010). The simulated MSE framework included a monitoring model and assessment model. The assessment model was consistent with the Gulf of Alaska pollock assessment (A’mar et al. Citation2010). The decision rule was one of two broken-stick HCRs: the Dorn rule for determining the target fishing mortality rate (Dorn et al. Citation2002), or an overfishing level defined in terms of fishing mortality (A’mar et al. Citation2010). Simulated scenarios included variations in the pollock HCR, predator functional responses, and the method for computing future levels of constant exploitation for each of the predators. A’mar et al. (Citation2010) found the current management strategy to be satisfying the main management objective (keeping pollock spawning stock biomass above the reference level) for all of the investigated scenarios of predator exploitation rates and predator functional relationships. A’mar et al. (Citation2010) notes that this occurred because higher levels of pollock biomass were not detected in the survey indices of abundance (A’mar et al. Citation2010).
Guo et al. (Citation2019, Citation2020) simulated MSEs to support EBFM of the PNCIMA off western Canada. Guo et al. (Citation2019) explored the development of ecosystem-based biological reference points (EBRPs) that account for multispecies interactions, fishery operations, and climate change. Guo et al. (Citation2020) evaluated alternative fisheries management strategies under environmental changes. For both studies, the OM was an OSMOSE model of PNCIMA (Fu et al. Citation2017). The simulated MSE framework lacked a monitoring model and assessment model. Guo et al. (Citation2019) placed decision rules on three of the exploited stocks of PNCIMA: Pacific herring (Clupea pallasii), Pacific cod (G. macrocephalus), and lingcod (O. elongatus). Simulated scenarios included variations in plankton productivity (low, medium, and high), fishery-type (single-species, multispecies), and HCR-type (none, broken-stick). Guo et al. (Citation2020) represented environmental changes on key species with various larval mortality forcing scenarios and somatic growth forcing scenarios. These scenarios were first implemented ignoring HCRs, then again with a set of precautionary HCRs. Guo et al. (Citation2019) found that management strategies with an HCR produced more stable catches and system biomass. Moreover, when HCR strategies were combined with high plankton biomass, the ecosystem could maintain stable ecosystem production and sustainable fisheries. Guo et al. (Citation2019) concludes that EBRPs compliment single-species assessments by including key ecological processes, thus supporting the incorporation of ecosystem considerations into advice. Guo et al. (Citation2020) found that the combination of environmental forcing and fishing impacted the PNCIMA ecosystem and fisheries, and they concluded that incorporating precautionary HCRs in fisheries management could help support the ecosystems health and fisheries.
Surma et al. (Citation2018) explored the ecosystem impacts of fishing strategies for Pacific herring (C. pallasii). The OM was an EwE model of the marine ecosystem around Haida Gwaii (Kumar et al. Citation2016). Herring HCRs were simulated via the MSE module in EwE (Christensen and Walters Citation2004; Mackinson et al. Citation2017), which lacked a monitoring model but contained an assessment model for estimating stock biomass. Stochastic assessment error was simulated within the MSE module by Monte Carlo resampling (100 runs) of the biomass estimates from assumed normal distributions. Simulated scenarios included variations in the functional form of the herring HCR, and the phytoplankton biomass time series. The latter allowed for investigations into the performance of HCRs under climate change/oceanographic regime shifts. The design of some of the simulated scenarios was influenced by the results from the Lenfest Forage Fish Task Force (Pikitch et al. Citation2012; see the Multi-system subsection). Surma et al. (Citation2018) concludes that Pacific herring are a key prey item in the Northeast Pacific food web, so stock depletion could have cascading effects on predator populations and food web structure, but some of the explored HCRs showed promise for supporting precautionary, EBFM of herring.
Lam et al. (Citation2019) introduced methodology for a Value- and Ecosystem-Based Management Approach (VEBMA) to fisheries, which aims to expose policy tradeoffs, resolve resource conflicts, and promote ethical governance (Lam et al. Citation2019). As a case study, Lam et al. (Citation2019) explored applying VEBMA to the Pacific herring (C. pallasii) fishery in British Columbia because of the many conflicts between local communities, indigenous tribes and fishing industries over the management of Pacific herring, as well as the significant ecological, socioeconomic, and cultural value of the species. To perform the ecosystem-based component of VEBMA, the authors simulated MSEs following the methodology presented by Surma et al. (Citation2018). The OM was an EwE model of the marine ecosystem around Haida Gwaii (Kumar et al. Citation2016). Herring HCRs were simulated via the MSE module in EwE (Christensen and Walters Citation2004; Mackinson et al. Citation2017), which lacked a monitoring model but contained an assessment model for estimating stock biomass. Stochastic assessment error was simulated within the MSE module by Monte Carlo resampling (100 runs) of the biomass estimates from assumed normal distributions. Some of the simulated scenarios were influenced by Surma et al. (Citation2018) and Pikitch et al. (Citation2012; see the Multi-system subsection), but Lam et al. (Citation2019) developed additional scenarios for exploring VEBMA. Lam et al. (Citation2019) found results that were similar to Surma et al. (Citation2018), e.g., fishing at levels less than maximum sustainably yield (MSY) did not disrupt the food web structure. The ecological and socioeconomic impacts and risks simulated by that application, as well as the stakeholder scenario-preferences, are synthesized in a deliberation and decision-support tool the authors called the VEBMA science-policy table (Lam et al. Citation2019).
Martell et al. (Citation2002) evaluated the consequences of fisheries management strategies of the Strait of Georgia. The OM, described by the authors, was an EwE model of the Strait of Georgia. The application was carried out with the policy optimization (OLSs) and evaluation (CLSs) routines in EwE (Pitcher and Cochrane Citation2002). Under these routines, management strategies are defined with multi-criteria objective functions that specify weights between ecological stability value, social employment value, net economic value, and mandated rebuilding value. Martell et al. (Citation2002) considered four strategies (three maximizing the ecological, economic, and social criteria individually and one maximizing these three criteria evenly). First, the optimal fishing patterns were determined for each strategy by carrying out OLSs, then these optimal fishing patterns were evaluated by carrying out CLSs. The policy evaluation routine in EwE lacked explicit monitoring and assessment sub-models, but Martell et al. (Citation2002) used error to incorporate uncertainty to data provided to the decision rule—the authors associated this to assessment error. Martell et al. (Citation2002) concludes that the results from this study were biased as the biomass within the OM was dominated by groups lacking long-term fisheries.
Punt et al. (Citation2016b) evaluated the implications of current US and Canadian HCRs for Pacific sardine (S. sajax) in terms of the management objectives for coastal pelagic species. The OM, which was presented by the authors, was a spatially structured MICE model of the California Current with areas in Mexico, US, and Canada. It consisted of (i) spatial age-structured population dynamics models for four prey groups: sardine, anchovy (Engraulis mordax), “other forage fish,” and “other prey,” (ii) age-structured population dynamics models for two predator groups: brown pelicans (P. occidentalis) and California sea lions (Z. californianus), and (iii) prey-predator relationship functions describing the influence prey biomass has on predator reproductive success and/or survival. Nation-specific fisheries were incorporated (Mexico, US, and Canada) as sardine fisheries management is not coordinated across national boundaries in practice. Sardine HCRs were defined for each of these fisheries, but the HCR for Mexico was based on a constant fishing mortality rate (Hill et al. Citation2015). For Canada and the US, Punt et al. (Citation2016b) structured the MSE such that the monitoring model was approximated by applying observational error to sardine biomass, and the assessment model was that of Hill et al. (Citation2015). Various simulated scenarios were considered to examine the implications of alternatives to the baseline model assumptions, and of eliminating various sources of uncertainty. One of the main findings of this work was that brown pelicans were particularly vulnerable to declines in sardine and anchovy. Punt et al. (Citation2016b) discussed this and how diet uncertainties, temporal foraging properties, and climate sensitivities may impact these vulnerabilities. The authors argued that the sensitivity analysis highlights the need for continuing monitoring of predator diets and reproductive success. Punt et al. (Citation2016b) concludes that the next steps to move this work forward is to develop alternative models of various levels of complexity, such as an Atlantis model.
4.6.2. The West Atlantic Ocean
Grüss et al. (Citation2016b) evaluated the performance of TAC strategies for red grouper (E. morio) within the West Florida Shelf provided episodic events of natural mortality (e.g., red tides). The OM was an OSMOSE model of the West Florida Shelf (Grüss et al. Citation2015, Citation2016a). Grüss et al. (Citation2016b) developed an MSE framework for OSMOSE. This framework lacked explicit monitoring and assessment sub-models but used error to incorporate uncertainty to data provided to the decision rule—which was associated with observation error. Grüss et al. (Citation2016b), however, assumed no observation or implementation error in all of the conducted simulations in order to facilitate the comparison of results. Grüss et al. (Citation2016b) developed a decision rule to prescribe to red grouper as no completed MSE framework within the Gulf of Mexico was available at the time. This was done following A’mar et al. (Citation2010) and Dorn et al. (Citation2002). A TAC was set based on an overfishing limit (determined by the decision rule) and a buffer between the overfishing limit and a TAC. The buffer was calculated from the probability of overfishing considered acceptable (P*) and the standard error of the log of the distribution of the overfishing limit. This method is referred to as the “P* approach” (Caddy and McGarvey Citation1996; Punt et al. Citation2012). Simulated scenarios were a combination of configurations for the P* approach, the presence/absence of episodic natural mortality events on red grouper, and temporal frequencies for updating the red grouper TAC. Grüss et al. (Citation2016b) found that while episodic events of natural mortality significantly increased both the probability of red grouper being overfished and the probability of red grouper undergoing overfishing, increased temporal frequencies of TAC updates did not have significant impacts on biomass or catch metrics of red grouper.
Masi et al. (Citation2018) explored the impacts biological interactions may have on the development of adaptive management strategies and broken-stick HCRs for reef fish of the Gulf of Mexico. The OM was an Atlantis model of the Gulf of Mexico (Ainsworth et al. Citation2015; Tarnecki et al. Citation2016). The simulated MSE framework lacked a monitoring model and assessment model. Decision rules were applied to all of the functional groups identified in the reef fish complex. Simulated scenarios included variations of the broken-stick HCR (i.e., the upper biomass threshold and maximum fishing mortality rate). Moreover, Masi et al. (Citation2018) explored estimation error regarding the OMs food web by randomly resampling from Dirichlet distributions fitted to observational diet data described in Masi et al. (Citation2014) and Tarnecki et al. (Citation2016). Ten plausible food webs were developed based on ten independent, random draws, which were simulated under two of the HCR scenarios to derive the mean and associated 95% confidence limits for the biomass and catch (Masi et al. Citation2018). Masi et al. (Citation2018) found that the scenarios with lower maximum fishing mortality rates produced ecologically distinct ecosystems where relatively higher levels of fishing mortality rates on predators ultimately resulted in an increase in prey availability, which ultimately led to increased overall productivity of the ecosystem and higher catch and biomass of most other reef fish groups. Masi et al. (Citation2018) concludes that development of ecosystem-based fisheries management strategies for the Gulf of Mexico depends on a better understanding of the interspecific interactions between target reef fish and their prey.
4.6.3. The Northwest Atlantic Ocean
Deroba et al. (Citation2019) presented a stakeholder driven MSE to evaluate HCRs for Atlantic herring (C. harengus) in the Northwest Atlantic, which was requested by the political body responsible for the federal management of the stock (the New England Fishery Management Council; Feeney et al. Citation2019). This was the first MSE in the US to use open-invitation, public workshops to gather input from stakeholders (Feeney et al. Citation2019). The OM, described by the authors, was a MICE model consisting of (i) an age-structured population dynamics model for herring modified from Deroba (Citation2014), (ii) delay difference population dynamics models within which processes relating to each of the general predator populations (highly migratory fish, groundfish, and seabirds) were influenced by some aspect of the herring status (similar to Plagányi and Butterworth Citation2012), (iii) herring-predator link functions connecting herring to each of the predators, and (iv) an economics model converting fisheries yield from the herring component into gross revenues and net operating revenues. The OM was a result of discussing the scientific information known about the Northeast US continental shelf food web with stakeholders. Moreover, from the stakeholder workshops, eight OMs were developed to address uncertainties regarding herring productivity, herring growth, and possible bias in the herring stock assessment. The simulated MSE framework lacked an explicit monitoring model and assessment model, but Deroba et al. (Citation2019) used error to incorporate uncertainty to data provided to the decision rule—the authors associated this to assessment error. Considering each combination of HCR and OM, there were 43,680 unique scenarios simulated. The results suggested that some HCRs resulted in stable yields but at the expense of more frequent low levels of herring biomass and outcomes relatively detrimental to predators (Deroba et al. Citation2019; Feeney et al. Citation2019). Deroba et al. (Citation2019) concludes that the use of MICE models was informative for managers and created a base for future improvements.
Pérez-Rodríguez et al. (Citation2019) presented the development of an MSE of fisheries around the Flemish Cap. This application resulted from the Directorate-General for Maritime Affairs and Fisheries project of the European Commission, “A Multispecies Fisheries Assessment for NAFO.” Much of the eastern regions of Canada are under the intergovernmental fisheries science and management body NAFO (Northwest Atlantic Fisheries Organization), and this project aimed to contribute to the NAFO roadmap for a multispecies assessment and advice approach to fisheries management (EAF). The OM was a Gadget model of the Flemish Cap (Pérez-Rodríguez et al. Citation2017). The simulated MSE framework was based on the a4a approach (FLR package; Kell et al. Citation2007), which was modified to introduce the developed OM and to allow several MPs to run in parallel. Although the a4a-MSE algorithm includes the full simulated MSE framework (i.e., a monitoring model and assessment model), the simulated MSE framework used by Pérez-Rodríguez et al. (Citation2019) lacked explicit monitoring and assessment sub-models but used error to incorporate uncertainty to data provided to the decision rule—the authors associated this to assessment error. Simulated scenarios included variations in HCR functional form and reference point perspective (single species- and multispecies-based). Pérez-Rodríguez et al. (Citation2019) found that single species-based HCRs may not be capable of maintaining the status of multiple stocks above the biomass limit reference point, and that two stage HCRs may increase the possible combinations of fishing pressure.
Vasconcellos et al. (Citation2002) aimed to test EwE as a tool for analyzing the ecological and socioeconomic impacts of fishing strategies. The OM was an EwE model of the Newfoundland-Labrador shelf (Bundy et al. Citation2000). The application was carried out with the policy optimization (OLSs) and evaluation (CLSs) routines in EwE (Pitcher and Cochrane Citation2002). Under these routines, management strategies are defined with multi-criteria objective functions that specify weights between ecological stability value, social employment value, net economic value, and mandated rebuilding value. Vasconcellos et al. (Citation2002) considered four strategies (three maximizing the ecological, economic, and social criteria individually and one maximizing these three criteria evenly). First, the optimal fishing patterns were determined for each strategy by carrying out OLSs. Then, CLSs were carried out for the optimal strategy, which was the strategy maximizing the individual criteria evenly, under different coefficients of variation for the observation error. The simulated MSE framework (CLSs) lacked explicit monitoring and assessment sub-models, but Vasconcellos et al. (Citation2002) used error to incorporate uncertainty to data provided to the decision rule—the authors associated this to observation error. Vasconcellos et al. (Citation2002) found with increased observation error a decrease in performance for economic and social indicators and a slight increase in ecological indicator performance. Thus, the variability imposed by the observation error reduced the impact of fishing on ecological stability.
4.7. South America
Four applications around South America were identified: one of the Huizache-Caimanero lagoon (Zetina-Rejón et al. Citation2001), one of the Gulf of Salamanca (Duarte and García Citation2002), one of the central Gulf of California (Arreguín-Sánchez and Calderón-Aguilera Citation2002), and one of the Campeche continental shelf (Arreguín-Sánchez Citation2002; Arreguín-Sánchez et al. Citation2004). All of these applications were carried out with the policy optimization (OLSs) and evaluation (CLSs) routines in EwE (Pitcher and Cochrane Citation2002). Management strategies were defined with multi-criteria objective functions—specify weights between the ecological, social, and economic criteria. The simulated MSE framework (CLSs) lacked explicit monitoring and assessment sub-models, but all these applications used error to incorporate uncertainty to data provided to the decision rule—the authors all associated this to assessment error.
Zetina-Rejón et al. (Citation2001) explored how changes in fisheries effort within the Huizache-Caimanero lagoon impacts the fisheries and ecosystem. Some focus was put on the shrimp fishery as the system was characterized as having valuable shrimp resources (e.g., L. vannamei) and less valuable finfish resources. The OM was an EwE model of the Huizache-Caimanero lagoon (Zetina-Rejón Citation2000). First, Zetina-Rejón et al. (Citation2001) determined an optimal management strategy by running preliminary OLSs varying the weights of the ecological, social, and economic criteria. Then, the optimal management strategy was evaluated with a CLS. Zetina-Rejón et al. (Citation2001) found that the optimal management strategy was that specifying a small increase in effort of the finfish fishery in combination with a small decrease in effort of the shrimp fishery. Simulations of this strategy increased economic profits and reduced pressure (natural morality and fishing) on shrimp—allowing the group to recover.
Duarte and García (Citation2002) investigated the balance between the sustainability and economic importance of the Gulf of Salamanca fishery. The OM, described by the authors, was an EwE model of the Gulf of Salamanca. Duarte and García (Citation2002) considered four strategies (three maximizing the ecological, economic, and social criteria individually and one maximizing these three criteria evenly). First, the optimal fishing patterns were determined for each strategy by carrying out OLSs, then these optimal fishing patterns were evaluated by carrying out CLSs. Duarte and García (Citation2002) found that the strategy maximizing all three criteria had the best performance.
Arreguín-Sánchez and Calderón-Aguilera (Citation2002) aimed to generally explore management strategies in the central Gulf of California under the ecosystem approach. The OM was an EwE model of the central Gulf of California (Arreguín-Sánchez Citation2000). First, Arreguín-Sánchez and Calderón-Aguilera (Citation2002) determined optimal management strategies by running preliminary OLSs varying the weights of the criteria and functional group vulnerabilities. Then, two of the optimal management strategies were evaluated with CLSs. These two strategies differed in that one defined conservation weights for all groups, while the other emphasized the conservation of marine mammals and seabirds. Arreguín-Sánchez and Calderón-Aguilera (Citation2002) concludes that the strategy maximizing ecosystem criteria was the only reasonable strategy because, otherwise, stocks deplete and sometimes disappear from the system.
Arreguín-Sánchez (Citation2002) and Arreguín-Sánchez et al. (Citation2004) aimed to test and evaluate the impacts of different management strategies of fisheries of the Campeche Sound under the ecosystem approach. Some focus was put on the shrimp fishery due to the essential role it has in the regional economy. The OM was an EwE model of the continental shelf off Campeche (Manickchand-Heileman et al. Citation1998). Salinity stress was incorporated into the OM in the form of a forcing factor because of the significant, inverse correlation observed between shrimp abundance and salinity. Arreguín-Sánchez (Citation2002) considered eight management strategies defined by different weights for the ecological, social, and economic criteria. First, the optimal fishing patterns were determined for each strategy by carrying out OLSs. Then, CLSs were carried out for the two optimal strategies under different coefficients of variation, fishery impacts, and catchability. Arreguín-Sánchez et al. (Citation2004) considered five management strategies defined by different weights for the ecological, social, and economic criteria. First, the optimal fishing patterns were determined for each strategy by carrying out OLSs. Then, CLSs were carried out for strategy promoting shrimp recovery. Arreguín-Sánchez (Citation2002) found that the scenario optimizing ecosystem criteria minimized the uncertainty in shrimp behavior. Arreguín-Sánchez et al. (Citation2004) found that the shrimp-recovery management strategy was able to result in increased shrimp biomass despite stress inflicted by the forcing factor (salinity).
4.8. Multi-system
Two applications did not focus on any one specific marine ecosystem: Pikitch et al. (Citation2012), and Kaplan et al. (Citation2020).
Pikitch et al. (Citation2012) presented a report from the Lenfest Forage Fish Task Force, a panel for providing practical, science-based advice for the management of forage fish. Part of the report included an investigation of ecosystem responses to fisheries management strategies of forage fish. Rather than having a focal ecosystem, Pikitch et al. used OMs, all of which were EwE models, from 10 different ecosystems (; ). The HCRs were simulated with the MSE module in EwE (Christensen and Walters Citation2004). The simulated MSE framework lacked an explicit monitoring model but contained an assessment model, which included recruitment based on the biomass of the previous year and the stock recruitment curves. A monitoring model, however, was approximated with error. Simulated scenarios included variations in the functional form of HCRs, error, and the configuration for individual forage fish species/groups. Pikitch et al. (Citation2012) concludes that no one HCR-function can effectively promote sustainability when high levels of fishing are allowed, and that the broken-stick HCRs may be the optimal strategy when stock size is uncertain.
Kaplan et al. (Citation2020) used simulations for MSE under an ecosystem modeling context to test HCRs that explicitly address predator-prey linkages as well as the foraging needs of predators and fisheries. Two OMs were used, an Atlantis model of the California Current (Kaplan et al. Citation2017) and an Atlantis model of the Norwegian and Barents Seas (Hansen et al. Citation2016, Citation2019), and simulated management was centered around a prominent pelagic fishery from each system, the Pacific hake (Merluccius productus) in the California Current and mackerel (Scomber scombrus) in the Norwegian Sea. The simulated MSE framework did not contain a monitoring model or an assessment model. Three variations of the broken-stick HCR decision rule () were tested across both models: Flim constant at maximum sustainable yield, Flim decreases when the forage base declines, and Flim increases when the forage base increases. Simulated scenarios included variations in prey availability (i.e., zooplankton productivity). Kaplan et al. (Citation2020) found that the presence of HRCs led to higher stock biomass for the target species in both ecosystems, which is a result analogous to similar studies under a single-species modeling context, however a major tradeoff was an increase in catch variability, particularly with HCRs that adjust fishing pressure according to prey availability. Another tradeoff was the potential of strong impacts across other species, which was more notable in the Norwegian and Barents Seas model. Kaplan et al. (Citation2020) notes that the regional differences in results highlight the value in a multi-system comparison study.
5. Discussion
This review has developed an inventory of the applications evaluating fishing management strategies while explicitly simulating biological interactions. This may not be a comprehensive inventory as applications may have gone undetected due to a variety of reasons, such as changing/differing terminologies, published languages, and the difficulty of searching gray literature (Cordes Citation2004). Applications using either dynamic multispecies OMs or aggregated OMs are common in the inventory. Those using dynamic multispecies OMs often had a somewhat targeted focus (e.g., species or food web) and partially or fully structured MSE simulations. Those using aggregated OMs often had a somewhat broader focus (e.g., ecosystem communities) and partially structured MSE simulations. Applications using either biogeochemical-based OMs and hybrid OMs are less common in the inventory but, nonetheless, these applications showcased a range of foci and MSE simulation structures. The study region seems to have some influence on OM model-type and focus. For instance, most of the applications using biogeochemical-based OMs pertain to Australia, which is where the team that developed the most commonly used biogeochemical-based OM, Atlantis, is located (https://research.csiro.au/atlantis/).
The applications identified herein encompass a variety of aquatic systems around the world, but there are many regions that are not covered. This could be driven by a variety of factors, such as local fisheries governances lacking the structure for MSE (Grafton et al. Citation2007), or local research philosophies being apprehensive to ecosystem models (Anderson Citation2010). One key factor, however, is data availability. Models require data to be properly parameterized, with more complex models having greater data needs, so data availability limits the models that can be developed for the system (Espinoza-Tenorio et al. Citation2012; Collie et al. Citation2016). For instance, in South Africa it is common practice to simulate MSEs (i.e., the management procedure framework; Cochrane et al. Citation1998; Geromont et al. Citation1999; Rademeyer et al. Citation2008; de Moor et al. Citation2015). Single-species OMs are standard as data limitations have restricted the number of multispecies models vetted to assist the management of targeted species, despite the immediate role for more complex OMs (Butterworth and Plagányi Citation2004; Plagányi et al. Citation2007). Data limitations restricting the development of complex marine ecosystem models are an obstacle but do not impede MSEs for EAF. First, for data-poor situations, there are case examples illustrating the undertaking of MSEs (Dowling et al. Citation2015a, Citation2015b) as well as a growing list of tools available to assist such efforts—such as frameworks (Harford et al. Citation2016), statistical toolkits (Carruthers and Hordyk Citation2018), and ecosystem models for data-poor situations (Okamura et al. Citation2018). Second, for situations with enough data to parameterize single-species OMs, there are case examples illustrating the expansion of single-species OMs to implicitly account for ecological interactions (i.e., expanded single-species models; O’Farrell et al. Citation2017)—such as cannibalism and inter-species predation (ICES Citation2016a, Citation2016b), approximations of biological interactions (Punt et al. Citation2001), and other ecosystem effects (Plagányi et al. Citation2007).
Herein, applications with a harvest feedback mechanism were the focus as current MSE best practice guidelines assert that it is a necessary feature (Punt et al. Citation2016a). Initially, a literature review without this criterion was attempted as original definitions of MSE did not require a harvest feedback mechanism (Smith et al. Citation1999), but the number of applications resulting from these searches proved to be too numerous. Many of these applications evaluate the impacts of various fishing scenarios on aquatic systems, such as Kaplan et al. (Citation2012), which used an Atlantis model of the California Current, and Geers et al. (Citation2016), which used an EwE model of the Gulf of Mexico, and Nyamweya et al. (Citation2017), which used an Atlantis model of Lake Victoria. Other applications evaluate how elements of model development impact the resulting advice, such as Gaichas et al. (Citation2012), which used dynamic multispecies models of hypothetical ecosystems to evaluate how assembly rules for aggregating species into functional groups affect the estimation of biological reference points. Some applications relate to the development and assessment of evaluation metrics (i.e., indicators) commonly used in fisheries management, such as Fulton et al. (Citation2004c, Citation2005), which used Atlantis and EwE models to identify robust indicators and reference points for EBFM, and Shin et al. (Citation2018), which used EwE, OSMOSE, and Atlantis models to test commonly used ecological indicators. Simulating a harvest feedback mechanism is ideal and should be handled when it is necessary for the research question but simulating this mechanism should not be a limiting factor for using ecosystem models to provide strategic advice as these efforts provide a comparative evaluation resulting in relevant and illuminating information.
The inventory suggests two paths for selecting an OM: (i) selecting an OM to develop from scratch, or (ii) selecting an OM that has been previously developed. The former offers the advantage to develop an OM specific to the research questions and uncertainties. Many of the applications in the inventory presented the development of the OM, especially those using aggregated models. Aggregated models are the simplest of the categories considered herein, so it is feasible to detail both OM development and the simulation exercise jointly. Applications using more complex OMs, however, were often detailed across multiple reports and articles (e.g., Fulton et al. Citation2007, Citation2014). Model reviews, such as those presented by Espinoza-Tenorio et al. (Citation2012) and Geary et al. (Citation2020), are essential tools for determining the modeling frameworks best suitable as the OM provided the available data and research goals. Future applications should not limit OM selection to previously developed modeling frameworks as newly developed frameworks may offer new features that could be particularly advantageous for the study system.
The latter path offers the advantages to expand upon the uses of a previously developed model, build upon the knowledge from previous applications, and allows the exploration of model error via multi-model evaluation. A number of the applications in the inventory, particularly those using more complex OMs, used models that were previously developed. This includes applications using models that were previously developed for MSE simulations (e.g., Howell and Bogstad Citation2010), applications using models with newly developed features to allow MSE simulations (e.g., Lam et al. Citation2019), and applications jointly developing tools to allow MSE simulations (e.g., Grüss et al. Citation2016b). The development of ecosystem models, especially more complex frameworks, requires great investments into time and resources, so the drive to use previously developed models as OMs for MSE simulations is reasonable. It is essential, however, to ensure that the model is suitable for addressing the new questions being imposed, which can be done by following guidelines proposed by Essington and Plagányi (Citation2014) and making alterations to the model if necessary. An example of this is observed in the developed inventory following the series of applications of the Southwest region of Australia, which all used variations of an Atlantis model. No matter how the OM is selected, one of the most important features to remember moving forward when using complex marine ecosystem models for EBFM is evaluating the model performance. Fortunately, the research community is gradually developing methods to progress the development and evaluation of ecosystem models, such as diagnostics indicators (Link Citation2010a), quality control standards (Kaplan and Marshall Citation2016), sensitivity analysis (Christensen and Walters Citation2004; Morzaria-Luna et al. Citation2018; Bracis et al. Citation2020), skill assessments (Olsen et al. Citation2016), and best practices guidelines (Heymans et al. Citation2016; Pethybridge et al. Citation2019).
The analysis of MSE simulation structures within the developed inventory focused on the presence, absence and/or approximation of the monitoring and assessment sub-models, and many of the applications incorporated at least one if not both of these sub-models—satisfying best practice recommendations (e.g., Punt et al. Citation2016a). The handling of the monitoring and assessment sub-models ranged from simple approximations (e.g., STECF Citation2015; Mackinson et al. Citation2018) to explicit monitoring models (e.g., Hagen et al. Citation1998; Fulton et al. Citation2014) or full assessment models (e.g., Howell and Bogstad Citation2010; Fulton et al. Citation2016; Dichmont et al. Citation2017). The modeling tools currently available (e.g., Atlantis, EwE, OSMOSE, etc.) are flexible in how users can setup simulations, but this variety in MSE simulation structure also stems from the fact that many of these modeling tools are open-source programs developed in such a way to allow users to edit and adapt the code for particular situations. The inventory showcases examples of users building and implementing their own MSE modules (e.g., Grüss et al. Citation2016b). Future applications will need to weight the tradeoffs between developing simulations for MSE with modeling tools that roughly reflect the management procedures or investing resources into programming the modeling tools to reflect the desired amount of accuracy. This should be considered for all components of the MSE simulation structure, including the decision rule, implementation of the management decision, and MP frequency (i.e., how often the fisheries management is updated). For example, many of the applications in the inventory utilized broken-stick HCRs based on spawning stock biomass, but decision rules can take on a variety of forms. It is possible to program modeling tools to consider different forms for the decision rule, which is showcased in the inventory by Bustamante et al. (Citation2011) and Dichmont et al. (Citation2013) who used an indicator relating to the effects of trawling to make decisions with respect to area closures. Additionally, although MP frequency was difficult to discern across the inventory, it appears that applications generally assumed it to be annual—which is the assumption in many of the modeling tools. Grüss et al. (Citation2016b) was one of the only applications identified herein to explore the impacts of altering MP frequency. Although Grüss et al. (Citation2016b) found that changes in MP frequency had little impact on the performance metrics, such an analysis is valuable as stock assessment frequency can have important implications on resource management.
Future applications must consider how to handle each of the key components of the MSE simulation process as it directly influences the exploration of uncertainty and error. For instance, if an application aims for a general exploration then a simple MSE structure (e.g., truth + model-free) may be sufficient, but if an application aims to align with current best-practice analytical stock assessment methods where estimation of errors and uncertainties are key features, then the MSE simulation must be structured to include those errors and uncertainties. The one category of error that should not be overlooked by future MSE simulation with complex OMs is model error (i.e., error in model structure and/or parameterization) as it addresses concerns regarding model uncertainty. All of the applications within the developed inventory handled/discussed uncertainty and error, but model error was one of the least explored uncertainty and error categories—especially amongst more complex models. The best way forward to address this is to conduct MSE simulations on a set of OMs that cover a range of resource dynamics (i.e., robustness tests; Rademeyer et al. Citation2007). This could be accomplished with multiple versions of an OM of the same model-type, which was observed in the inventory (e.g., Punt et al. Citation2016b), or with multiple versions of an OM of various model-types. The latter is not observed in this inventory, but there are such applications which lack a harvest feedback mechanism (e.g., Smith et al. Citation2015b).
6. Conclusion
When a stock is anticipated to have significant responses to the ecosystem (e.g., biological interactions), candidate management strategies should be contrasted with MSE simulations that include these responses (Skern‐Mauritzen et al. Citation2016). This review comes at a rise in exploration of ecosystem-based MSE. The number of applications identified herein are sparse up until the 2000s, but over the last few years the number of applications has suddenly increased. Although not considered in this review, extended single-species models offer a means to immediately integrate ecological considerations into MSE applications and tactical advice (Plagányi et al. Citation2007; Grüss et al. Citation2017; O’Farrell et al. Citation2017; Punt et al. Citation2020). The integration of ecosystem models into MSE for informing fisheries management should not eliminate but rather complement the use of single-species models (Trites et al. Citation1999; Espinoza-Tenorio et al. Citation2012). The inventory compiled herein showcases applications that are part of a full MSE to inform fisheries management (e.g., Fulton et al. Citation2007; Deroba et al. Citation2019). For regions with established, peer-reviewed ecosystem models, MSE is a means to allow ecosystem models to support fisheries management (Grüss et al. Citation2017). For areas with multiple ecosystem models, MSE simulations for robustness tests could be accomplished. Ultimately, ecosystem-based MSE should consider several OMs of intermediate complexity to fully address model uncertainty (Sainsbury et al. Citation2000). In addition to the utilization of ecosystem models as OMs, ecosystem considerations can be integrated into MSE through any of the other components—the monitoring model, the assessment model, and the decision rule (Kaplan et al., Citationin review).
The applications identified herein showcase that, across a variety of modeled marine ecosystems and OM-types, biological interactions can have an influence on the outcomes of strategies explored through simulated MSE. This study focused predominantly on the general structure and motivation of the MSE simulations, but even more can be gained from the inventory developed herein (e.g., if/how simulations reflected those considered by management, the performance metrics presented and discussed).
Supplemental Material
Download MS Word (853.7 KB)Acknowledgments
This work was carried out as part of the Institute of Marine Research Strategic Project Reduced Uncertainty in Stock Assessment (2016–2020). We thank Daisuke Goto, Isaac Kaplan, and Sara Gaichas for informative and thoughtful discussions. We thank Berengere Husson, Mimi Lam, Szymon Surma, Elizabeth Fulton, Jason Link, Howard Townsend, Jonathan Deroba, and Rebecca Rademeyer for providing additional information and clarification. We also thank the anonymous reviewer for their insightful feedback.
Disclosure statement
The authors declare that the research was conducted in the absence of any commercial or financial relationships that could be construed as a potential conflict of interest.
Additional information
Funding
References
- Ainsworth CH, Schirripa MJ, Morzaria-Luna H. 2015. An Atlantis Ecosystem Model for the Gulf of Mexico supporting Integrated Ecosystem Assessment. NOAA Technical Memorandum NMFS-SEFSC-676, US Department of Commerce, La Jolla, California. p. 149. doi:https://doi.org/10.7289/V5X63JVH
- A’mar ZT, Punt AE, Dorn MW. 2010. Incorporating ecosystem forcing through predation into a management strategy evaluation for the Gulf of Alaska walleye pollock (Theragra chalcogramma) fishery. Fish Res. 102(1–2):98–114. doi:https://doi.org/10.1016/j.fishres.2009.10.014
- Anderson TR. 2010. Progress in marine ecosystem modelling and the “unreasonable effectiveness of mathematics. J Marine Syst. 81(1-2):4–11. doi:https://doi.org/10.1016/j.jmarsys.2009.12.015
- Araùjo JN, Mackinson S, Ellis JR, Hart PJB. 2005. An Ecopath model of the western English Channel ecosystem with an exploration of its dynamic properties. Sci Ser Tech Rep. CEFAS Lowestoft 125:45.
- Arreguín-Sánchez F. 2000. Modelación de flujos de biomasa en Centros de Actividad Biológica. In: Lluch Belda D, Elorduy-Garay J, Lluch-Cota SE, Ponce-Díaz G, editors. Bac: Centros de Actividad Biológica del Pacífico Mexicano, 1 ed. Centro de Investigaciones Biológicas del Noroeste, S.C.; p. 13–27.
- Arreguín-Sánchez F. 2002. Impact of harvesting strategies on fisheries and community structure on the Continental Shelf of the Campeche Sound, southern Gulf of Mexico. In: Pitcher TJ, Cochrane KL, editors. The use of ecosystem models to investigate multispecies management strategies for capture fisheries. Vancouver, B.C., Canada: Fisheries Centre Research Reports; p. 127–134.
- Arreguín-Sánchez F, Calderón-Aguilera LE. 2002. Evaluating harvesting strategies for fisheries in the Central Gulf of California ecosystem. In: Pitcher TJ, Cochrane KL, editors. The use of ecosystem models to investigate multispecies management strategies for capture fisheries. Vancouver, B.C., Canada: Fisheries Centre Research Reports; p. 135–141.
- Arreguín-Sánchez F, Zetina-Rejón M, Manickchand-Heileman S, Ramı́rez-Rodrı́guez M, Vidal L. 2004. Simulated response to harvesting strategies in an exploited ecosystem in the southwestern Gulf of Mexico. Ecol Model. 172(2-4):421–432. doi:https://doi.org/10.1016/j.ecolmodel.2003.09.016
- Audzijonyte A, Pethybridge H, Porobic J, Gorton R, Kaplan I, Fulton EA. 2019. Atlantis: a spatially explicit end-to-end marine ecosystem model with dynamically integrated physics, ecology and socio-economic modules. Methods Ecol Evol. 10(10):1814–1819. doi:https://doi.org/10.1111/2041-210X.13272
- Bartell SM, Lefebvre G, Kaminski G, Carreau M, Campbell KR. 1999. An ecosystem model for assessing ecological risks in Québec rivers, lakes, and reservoirs. Ecol Model. 124(1):43–67. doi:https://doi.org/10.1016/S0304-3800(99)00155-6
- Begley J, Howell D. 2004. An overview of Gadget, the Globally applicable Area-Disaggregated General Ecosystem Toolbox. Bergen, Norway: ICES Conference and Meeting Document ICES CM 2004/FF:13. p. 16.
- Benson AJ, Stephenson RL. 2018. Options for integrating ecological, economic, and social objectives in evaluation and management of fisheries. Fish Fish. 19(1):40–56. doi:https://doi.org/10.1111/faf.12235
- Bivand R, Keitt T, Rowlingson B, Pebesma E, Sumner M, Hijmans R, Rouault E, Warmerdam F, Ooms J, Rundel C. 2019. rgdal: bindings for the “Geospatial” Data Abstraction Library. R package version 1.4–3. https://CRAN.R-project.org/package=rgdal.
- Blanchard JL, Pinnegar JK, Mackinson S. 2002. Exploring marine mammal-fishery interactions using “Ecopath with Ecosim”: modelling the Barents Sea ecosystem. Sci Ser Tech Rep. Lowestoft, England: CEFAS Lowestoft. 117:52.
- Bogstad B, Gjøsaether H, Tjelmeland S. 1992. CapTool—a versatile aid in Barents Sea capelin catch quota options calculation. Working document to the 1992 meeting of the ICES Atlanto-Scandian Herring and Capelin Working Group. Copenhagen, Denmark: International Council for the Exploration of the Sea (ICES).
- Bracis C, Lehuta S, Savina-Rolland M, Travers-Trolet M, Girardin R. 2020. Improving confidence in complex ecosystem models: the sensitivity analysis of an Atlantis ecosystem model. Ecol Model. 431:109133. doi:https://doi.org/10.1016/j.ecolmodel.2020.109133
- Buchary EA, Alder J, Nurhakim S, Wagey T. 2002. The use of ecosystem-based modelling to investigate multi-species management strategies for capture fisheries in the Bali Strait, Indonesia. In: Pitcher TJ, Cochrane KL, editors. The use of ecosystem models to investigate multispecies management strategies for capture fisheries. Vancouver, B.C., Canada: Fisheries Centre Research Reports; p. 24–32.
- Bundy A, Lilly GR, Shelton PA. 2000. A mass balance model of the Newfoundland-Labrador Shelf. Can Tech Rep Fish Aquat Sci. 2310:xiv + 157.
- Bustamante R, Dichmont C, Ellis N, Rochester W, Griffiths S, Rothlisberg P, Burford M, Dell Q, Tonks M, Lozano-Montes H, et al. 2011. Effects of trawling on the benthos and biodiversity: development and delivery of a spatially-explicit management framework for the Northern Prawn Fishery. Final report to the project FRDC 2005/050. Cleveland: CSIRO Marine and Atmospheric Research; p. 382.
- Butterworth DS, Cochrane KL, De Oliveira JAA. 1997. Management procedures: a better way to manage fisheries? The South African experience. In: Pikitch EK, Huppert DD, Sissenwine MP, editors. Global trends: fisheries management. Bethesda, Maryland: American Fisheries Society; p. 83–90.
- Butterworth DS, Harwood J. 1991. Report on the Benguela Ecology Programme Workshop on Seal-fishery Biological Interactions. Benguela Ecology Programme, Department Zoology, University of Cape Town, Cape Town, Africa.
- Butterworth DS, Plagányi ÉE. 2004. A brief introduction to some approaches to multispecies/ecosystem modelling in the context of their possible application in the management of South African fisheries. Afr J Mar Sci. 26(1):53–61. doi:https://doi.org/10.2989/18142320409504049
- Butterworth DS, Punt AE. 1999. Experiences in the evaluation and implementation of management procedures. ICES J Mar Sci. 56(6):985–998. doi:https://doi.org/10.1006/jmsc.1999.0532
- Butterworth DS, Punt AE. 2003. The role of harvest control laws, risk and uncertainty and the precautionary approach in ecosystem-based management. In: Sinclair M, Valdimarsson G, editors. Responsible fisheries in the marine ecosystem. Wallingford: CABI; p. 311–319.
- Caddy JF, McGarvey R. 1996. Targets or limits for management of fisheries? N Am J Fish Manage.16(3):479–487. doi:https://doi.org/10.1577/1548-8675(1996)016 < 0479:TOLFMO > 2.3.CO;2
- Carruthers TR, Hordyk AR. 2018. The Data-Limited Methods Toolkit (DLMtool): an R package for informing management of data-limited populations. Methods Ecol Evol. 9(12):2388–2388. doi:https://doi.org/10.1111/2041-210X.13081
- Chen Z, Qiu YS, Jia XP. 2006. Quantitative model of trophic interactions in Beibu Gulf ecosystem in the northern South China Sea. Acta Oceanol Sin. 25:116–124.
- Chen Z, Qiu Y, Jia X, Xu S. 2008. Simulating fisheries management options for the Beibu Gulf by means of an ecological modelling optimization routine. Fish Res. 89(3):257–265. doi:https://doi.org/10.1016/j.fishres.2007.09.004
- Christensen V, Beattie A, Buchanan C, Ma H, Martell SJD, Latour RJ, Preikshot D, Sigrist MB, Uphoff JH, Walters CJ, et al. 2009. Fisheries ecosystem model of the Chesapeake Bay: methodology, parameterization, and model exploration. NOAA Tech. Memo. NMFS-F/SPO106. US Department of Commerce, La Jolla, California. p. 146.
- Christensen V, Walters CJ. 2004. Ecopath with Ecosim: methods, capabilities and limitations. Ecol Model. 172(2-4):109–139. doi:https://doi.org/10.1016/j.ecolmodel.2003.09.003
- Cochrane KL, Butterworth DS, Oliveira JAAD, Roel BA. 1998. Management procedures in a fishery based on highly variable stocks and with conflicting objectives: experiences in the South African pelagic fishery. Rev Fish Biol Fisher. 8(2):177–214. doi:https://doi.org/10.1023/A:1008894011847
- Collie JS, Botsford LW, Hastings A, Kaplan IC, Largier JL, Livingston PA, Plagányi É, Rose KA, Wells BK, Werner FE. 2016. Ecosystem models for fisheries management: finding the sweet spot. Fish Fish. 17(1):101–125. doi:https://doi.org/10.1111/faf.12093
- Constable AJ. 2001. The ecosystem approach to managing fisheries: achieving conservation objectives for predators of fished species. CCAMLR Sci. 8:37–64.
- Cordes R. 2004. Is grey literature ever used? Using citation analysis to measure the impact of GESAMP, an international marine scientific advisory body. Can J Inform Libr Sci. 28:45–65. doi:https://doi.org/10.29173/cais516
- de la Mare WK. 1996. Some recent developments in the management of marine living resources. In: Floyd RB, Sheppard AW, Barro PJD, editors. Frontiers of population ecology. Melbourne: CSIRO Publishing; p. 599–616.
- de Moor CL, Johnston SJ, Brandão A, Rademeyer RA, Glazer JP, Furman LB, Butterworth DS. 2015. A review of the assessments of the major fisheries resources in South Africa. Afr J Mar Sci. 37(3):285–311. doi:https://doi.org/10.2989/1814232X.2015.1070201
- DeAngelis DL, Bartell SM, Brenkert AL. 1989. Effects of nutrient recycling and food-chain length on resilience. Am Nat. 134(5):778–805. doi:https://doi.org/10.1086/285011
- Deroba JJ, Gaichas SK, Lee M, Feeney RG, Boelke D, Irwin BJ. 2019. The dream and the reality: meeting decision-making time frames while incorporating ecosystem and economic models into management strategy evaluation. Can J Fish Aquat Sci. 76(7):1112–1133. doi:https://doi.org/10.1139/cjfas-2018-0128
- Deroba JJ. 2014. Evaluating the consequences of adjusting fish stock assessment estimates of biomass for retrospective patterns using Mohn’s Rho. N Am J Fish Manage. 34(2):380–390. doi:https://doi.org/10.1080/02755947.2014.882452
- Dichmont CM, Deng A, Punt AE, Ellis N, Venables WN, Kompas T, Ye Y, Zhou S, Bishop J. 2008. Beyond biological performance measures in management strategy evaluation: bringing in economics and the effects of trawling on the benthos. Fish Res. 94(3):238–250. doi:https://doi.org/10.1016/j.fishres.2008.05.007
- Dichmont CM, Deng A, Punt AE, Venables W, Haddon M. 2006. Management strategies for short-lived species: the case of Australia’s Northern Prawn Fishery: 1. Accounting for multiple species, spatial structure and implementation uncertainty when evaluating risk. Fish Res. 82(1-3):204–220. doi:https://doi.org/10.1016/j.fishres.2006.06.010
- Dichmont CM, Ellis N, Bustamante RH, Deng R, Tickell S, Pascual R, Lozano‐Montes H, Griffiths S. 2013. EDITOR’S CHOICE: evaluating marine spatial closures with conflicting fisheries and conservation objectives. J Appl Ecol. 50(4):1060–1070. doi:https://doi.org/10.1111/1365-2664.12110
- Dichmont CM, Fulton EA, Gorton R, Sporcic M, Little LR, Punt AE, Dowling N, Haddon M, Klaer N, Smith DC. 2017. From data rich to data-limited harvest strategies—does more data mean better management? ICES J Mar Sci. 74(3):670–686. doi:https://doi.org/10.1093/icesjms/fsw199
- Dorn M, Barbeaux S, Guttormsen M, Megrey B, Hollowed A, Brown E, Spalinger K. 2002. Assessment of Walleye Pollock in the Gulf of Alaska Stock Assessment and Fishery Evaluation Report for Groundfish Resources in the Gulf of Alaska. Anchorage, AK, USA: North Pacific Fishery Management Council.
- Dowling NA, Dichmont CM, Haddon M, Smith DC, Smith ADM, Sainsbury K. 2015a. Empirical harvest strategies for data-poor fisheries: a review of the literature. Fish Res. 171:141–153. doi:https://doi.org/10.1016/j.fishres.2014.11.005
- Dowling NA, Dichmont CM, Haddon M, Smith DC, Smith ADM, Sainsbury K. 2015b. Guidelines for developing formal harvest strategies for data-poor species and fisheries. Fish Res. 171:130–140. doi:https://doi.org/10.1016/j.fishres.2014.09.013
- Duarte LO, García CB 2002. Testing responses of a tropical shelf ecosystem to fisheries management strategies: a small-scale fishery from the Colombian Caribbean Sea. In: Pitcher TJ, Cochrane KL, editors. The use of ecosystem models to investigate multispecies management strategies for capture fisheries. Vancouver, B.C., Canada: Fisheries Centre Research Reports; p. 142–149.
- Ellis N, Pantus F, Welna A, Butler A. 2008. Evaluating ecosystem-based management options: effects of trawling in Torres Strait, Australia. Cont Shelf Res. 28(16):2324–2338. doi:https://doi.org/10.1016/j.csr.2008.03.031
- Espinoza-Tenorio A, Wolff M, Taylor MH, Espejel I. 2012. What model suits ecosystem-based fisheries management? A plea for a structured modeling process. Rev Fish Biol Fisheries. 22(1):81–94. doi:https://doi.org/10.1007/s11160-011-9224-8
- Essington TE, Plagányi ÉE. 2014. Pitfalls and guidelines for “recycling” models for ecosystem-based fisheries management: evaluating model suitability for forage fish fisheries. ICES J Mar Sci. 71(1):118–127. doi:https://doi.org/10.1093/icesjms/fst047
- Exxon Valdez Oil Spill Trustee Council. 2002. 2002 Status Report. Anchorage, AK, USA: Exxon Valdez Oil Spill Trustee Council.
- FAO. 1996. Precautionary approach to fisheries. Part 1: guidelines on the precautionary approach to capture fisheries and species introductions - ScienceBase-Catalog. FAO Technical Guidelines for Responsible Fisheries. Rome: FAO.
- FAO. 2008. Fisheries management. 2. The ecosystem approach to fisheries. 2.1 Best practices in ecosystem modelling for informing an ecosystem approach to fisheries. FAO Fisheries Technical Guidelines for Responsible Fisheries. No. 4, Suppl. 2, Add. 1. Rome: FAO.
- Feeney RG, Boelke DV, Deroba JJ, Gaichas S, Irwin BJ, Lee M. 2019. Integrating management strategy evaluation into fisheries management: advancing best practices for stakeholder inclusion based on an MSE for Northeast US Atlantic herring. Can J Fish Aquat Sci. 76(7):1103–1111. doi:https://doi.org/10.1139/cjfas-2018-0125
- Field JC, Francis RC, Aydin K. 2006. Top-down modeling and bottom-up dynamics: linking a fisheries-based ecosystem model with climate hypotheses in the Northern California Current. Prog Oceanogr. 68(2–4):238–270. doi:https://doi.org/10.1016/j.pocean.2006.02.010
- Fogarty MJ. 2014. The art of ecosystem-based fishery management. Can J Fish Aquat Sci. 71(3):479–490. doi:https://doi.org/10.1139/cjfas-2013-0203
- Fournier DA, Skaug HJ, Ancheta J, Ianelli J, Magnusson A, Maunder MN, Nielsen A, Sibert J. 2012. AD Model Builder: using automatic differentiation for statistical inference of highly parameterized complex nonlinear models. Optim Method Softw. 27(2):233–249. doi:https://doi.org/10.1080/10556788.2011.597854
- Francis RICC, Shotton R. 1997. “Risk” in fisheries management: a review. Can J Fish Aquat Sci. 54:1699–1715.
- Fu C, Olsen N, Taylor N, Grüss A, Batten S, Liu H, Verley P, Shin Y-J. 2017. Spatial and temporal dynamics of predator-prey species interactions off western Canada. ICES J Mar Sci. 74(8):2107–2119. doi:https://doi.org/10.1093/icesjms/fsx056
- Fulton EA, Fuller M, Smith ADM, Punt AE. 2004a. Ecological indicators of the ecosystem effects of fishing: final report. Report No.: R99/1546. Hobart, Tas.//Canberra, ACT: CSIRO Div. of Marine Research//Australian Fisheries Management Authority. https://doi.org/10.4225/08/585c169120a95.
- Fulton EA, Parslow JS, Smith ADM, Johnson CR. 2004b. Biogeochemical marine ecosystem models II: the effect of physiological detail on model performance. Ecol Model. 173(4):371–406. doi:https://doi.org/10.1016/j.ecolmodel.2003.09.024
- Fulton EA, Punt AE, Dichmont CM, Gorton R, Sporcic M, Dowling N, Little LR, Haddon M, Klaer N, Smith DC. 2016. Developing risk equivalent data-rich and data-limited harvest strategies. Fish Res. 183:574–587. doi:https://doi.org/10.1016/j.fishres.2016.07.004
- Fulton EA, Punt AE, Dichmont CM, Harvey CJ, Gorton R. 2019. Ecosystems say good management pays off. Fish Fish. 20(1):66–96. doi:https://doi.org/10.1111/faf.12324
- Fulton EA, Sainsbury KJ, McDonald D, Hayes D, Lyne V, Little R, Fuller M, Condie S, Gray R, Scott R, et al. 2006. Management strategy evaluation specification for Australia’s North West Shelf. North West Shelf Joint Environmental Management Study. Technical Report No. 15. Australia: Commonwealth Scientific and Industrial Research Organisation (CSIRO).
- Fulton EA, Smith ADM, Johnson CR. 2004c. Biogeochemical marine ecosystem models I: IGBEM—a model of marine bay ecosystems. Ecol Model. 174(3):267–307. doi:https://doi.org/10.1016/j.ecolmodel.2003.09.027
- Fulton EA, Smith ADM, Punt AE. 2005. Which ecological indicators can robustly detect effects of fishing? ICES J Mar Sci. 62(3):540–551. doi:https://doi.org/10.1016/j.icesjms.2004.12.012
- Fulton EA, Smith ADM, Smith DC, Johnson P. 2014. An integrated approach is needed for ecosystem based fisheries management: insights from ecosystem-level management strategy evaluation. PLoS One. 9(1):e84242. doi:https://doi.org/10.1371/journal.pone.0084242
- Fulton EA, Smith ADM, Smith DC. 2007. Alternative Management Strategies for Southeast Australian Commonwealth Fisheries: Stage 2: Quantitative Management Strategy Evaluation. Australia: Commonwealth Scientific and Industrial Research Organisation (CSIRO).
- Fulton EA, Smith T. 2002. Ecosim Case Study: Port Phillip Bay, Australia. In: Pitcher TJ, Cochrane KL, editors. The use of ecosystem models to investigate multispecies management strategies for capture fisheries. Vancouver, B.C., Canada: Fisheries Centre Research Reports; p. 83–93.
- Gaichas S, Gamble R, Fogarty M, Benoît H, Essington T, Fu C, Koen-Alonso M, Link J. 2012. Assembly rules for aggregate-species production models: simulations in support of management strategy evaluation. Mar Ecol Prog Ser. 459:275–292. doi:https://doi.org/10.3354/meps09650
- Geary WL, Bode M, Doherty TS, Fulton EA, Nimmo DG, Tulloch AIT, Tulloch VJD, Ritchie EG. 2020. A guide to ecosystem models and their environmental applications. Nat Ecol Evol. 4(11):1459–1413. doi:https://doi.org/10.1038/s41559-020-01298-8
- Geers TM, Pikitch EK, Frisk MG. 2016. An original model of the northern Gulf of Mexico using Ecopath with Ecosim and its implications for the effects of fishing on ecosystem structure and maturity. Deep Sea Res Part II Top Stud Oceanogr. 129:319–331. doi:https://doi.org/10.1016/j.dsr2.2014.01.009
- Geromont HF, De OJ, Johnston SJ, Cunningham CL. 1999. Development and application of management procedures for fisheries in southern Africa. ICES J Mar Sci. 56(6):952–966. doi:https://doi.org/10.1006/jmsc.1999.0536
- Grafton RQ, Kompas T, McLoughlin R, Rayns N. 2007. Benchmarking for fisheries governance. Mar Policy. 31(4):470–479. doi:https://doi.org/10.1016/j.marpol.2006.12.007
- Gray R, Fulton EA, Little LR, Scott R. 2006. Ecosystem model specification within an agent based framework. North West Shelf Joint Environmental Management Study. Technical Report No. 16. Australia: Commonwealth Scientific and Industrial Research Organisation (CSIRO).
- Grüss A, Harford WJ, Schirripa MJ, Velez L, Sagarese SR, Shin Y-J, Verley P. 2016a. Management strategy evaluation using the individual-based, multispecies modeling approach OSMOSE. Ecol Model. 340:86–105. doi:https://doi.org/10.1016/j.ecolmodel.2016.09.011
- Grüss A, Rose KA, Simons J, Ainsworth CH, Babcock EA, Chagaris DD, De Mutsert K, Froeschke J, Himchak P, Kaplan IC, et al. 2017. Recommendations on the use of ecosystem modeling for informing ecosystem-based fisheries management and restoration outcomes in the Gulf of Mexico. Mar Coast Fish. 9(1):281–295. doi:https://doi.org/10.1080/19425120.2017.1330786
- Grüss A, Schirripa MJ, Chagaris D, Drexler M, Simons J, Verley P, Shin Y-J, Karnauskas M, Oliveros-Ramos R, Ainsworth CH. 2015. Evaluation of the trophic structure of the West Florida Shelf in the 2000s using the ecosystem model OSMOSE. J Marine Syst. 144:30–47. doi:https://doi.org/10.1016/j.jmarsys.2014.11.004
- Grüss A, Schirripa MJ, Chagaris D, Velez L, Shin Y-J, Verley P, Oliveros-Ramos R, Ainsworth CH. 2016b. Estimating natural mortality rates and simulating fishing scenarios for Gulf of Mexico red grouper (Epinephelus morio) using the ecosystem model OSMOSE-WFS. J Marine Syst. 154:264–279. doi:https://doi.org/10.1016/j.jmarsys.2015.10.014
- Guénette S, Heymans SJ, Christensen V, Trites AW. 2006. Ecosystem models show combined effects of fishing, predation, competition, and ocean productivity on Steller sea lions (Eumetopias jubatus) in Alaska. Can J Fish Aquat Sci. 63(11):2495–2517. doi:https://doi.org/10.1139/f06-136
- Guo C, Fu C, Forrest RE, Olsen N, Liu H, Verley P, Shin Y-J. 2019. Ecosystem-based reference points under varying plankton productivity states and fisheries management strategies. ICES J Mar Sci. 76(7):2045–2059. doi:https://doi.org/10.1093/icesjms/fsz120
- Guo C, Fu C, Olsen N, Xu Y, Grüss A, Liu H, Verley P, Shin Y-J. 2020. Incorporating environmental forcing in developing ecosystem-based fisheries management strategies. ICES J Mar Sci. 77(2):500–514. doi:https://doi.org/10.1093/icesjms/fsz246
- Hagen G, Hatlebakk E, Schweder T. 1998. Scenario Barents Sea a tool for evaluating fisheries management regimes. In: Rødseth T, editor. Models for multispecies management. Heidelberg, Germany: Physica-Verlag Heidelberg; p. 173–226.
- Hansen C, Drinkwater KF, Jähkel A, Fulton EA, Gorton R, Skern-Mauritzen M. 2019. Sensitivity of the Norwegian and Barents Sea Atlantis end-to-end ecosystem model to parameter perturbations of key species. PLoS One. 14(2):e0210419. doi:https://doi.org/10.1371/journal.pone.0210419
- Hansen C, Skern-Mauritzen M, van der Meeren G, Jähkel A, Drinkwater K. 2016. Set-up of the Nordic and Barents Seas (NoBa) Atlantis model. Havforskningsinstituttet. Bergen, Norway: Institute of Marine Research.
- Hansson S, Hjerne O, Harvey C, Kitchell JF, Cox SP, Essington TE. 2007. Managing Baltic Sea Fisheries under contrasting production and predation regimes: ecosystem model analyses. Ambio 36(2-3):265–271. https://doi.org/10.1579/0044-7447(2007)36. [265:MBSFUC]2.0.CO;22.0.co;2]
- Harford W, Gedamke T, Babcock E, Carcamo R, McDonald G, Wilson J. 2016. Management strategy evaluation of a multi-indicator adaptive framework for data-limited fisheries management. BMS. 92(4):423–445. doi:https://doi.org/10.5343/bms.2016.1025
- Hatfield B, Thomas L, Scott R. 2006. Management strategy evaluations for multiple use management of Australia’s North West Shelf – visualisation software user guide and outline. North West Shelf Joint Environmental Management Study. Technical Report No. 17. Australia: Commonwealth Scientific and Industrial Research Organisation (CSIRO).
- Heymans JJ, Coll M, Link JS, Mackinson S, Steenbeek J, Walters C, Christensen V. 2016. Best practice in Ecopath with Ecosim food-web models for ecosystem-based management. Ecol Model. 331:173–184. doi:https://doi.org/10.1016/j.ecolmodel.2015.12.007
- Hijmans RJ. 2019. raster: Geographic Data Analysis and Modeling. R package version 2.9-5. https://CRAN.R-project.org/package=raster. Version 3.0-7URL. https://CRAN.R-project.org/package=raster.
- Hill KT, Crone PR, Dorval E, Macewicz BJ. 2015. Assessment of the Pacific sardine resource in 2015 for U.S.A. management in 2015-16. NOAA Technical Memorandum NMFS-SWFSC-546. p. 168. US Department of Commerce, La Jolla, California.
- Hill SL, Cannon M. 2013. A potential feedback approach to ecosystem-based management: model predictive control of the Antarctic krill fishery. CCAMLR Sci. 20:119–137.
- Holland DS. 2010. Management strategy evaluation and management procedures: tools for rebuilding and sustaining fisheries. OECD Food, Agriculture and Fisheries Working Papers, No. 25. Paris, France: OECD Publishing. doi:https://doi.org/10.1787/5kmd77jhvkjf-en
- Holling CS. 1965. The functional response of predators to prey density and its role in mimicry and population regulation. Mem Entomol Soc Can. 97(S45):5–60. doi:https://doi.org/10.4039/entm9745fv
- Howell D, Bogstad B. 2010. A combined Gadget/FLR model for management strategy evaluations of the Barents Sea fisheries. ICES J Mar Sci. 67(9):1998–2004. doi:https://doi.org/10.1093/icesjms/fsq135
- ICES 2016a. Norway/Russia request for evaluation of harvest control rules for Northeast Arctic cod and haddock and for Barents Sea capelin. Report of the ICES Advisory Committee, 2016. ICES Advice 2016, Book 3, Section 3.4.1. ICES Special Request Advice.
- ICES. 2009. Report of the Arctic Fisheries Working Group (AFWG), April 21–27, 2009. Diane Lindemann: San-Sebastian, Spain. p. 579.
- ICES. 2011. Annex 5 - Report on key run for the North Sea Ecopath with Ecosim ecosystem Model, 1991 - 2007. Report of the Working Group on Multispecies Assessment Methods (WGSAM), October 10–14, 2011. ICES CM 2011/SSGSUE:10. Woods Hole, USA. p. 147–229.
- ICES. 2016b. Report of the second workshop on Management Plan Evaluation on Northeast Arctic cod and haddock and Barents Sea capelin (WKNEAMP-2), January 25–28, 2016. ICES CM 2016/ACOM:47.76. Kirkenes, Norway.
- ICES. 2016c. Report of the Working Group on Multispecies Assessment Methods (WGSAM), November 9–13, 2015. ICES CM 2015/SSGEPI:20. Woods Hole, USA. p. 206.
- ICES. 2019. Workshop on Guidelines for Management Strategy Evaluations (WKGMSE2). ICES Scientific Rep. 1:33–162. doi:https://doi.org/10.17895/ices.pub.5331
- IWC. 1993. Specification of the North Atlantic minke whaling trials. Rep Int Whal Commn. 43:371–382.
- IWC. 1994. The revised management procedure (RMP) for Baleen whales. Rep Int Whal Commn. 44:189–196.
- Kaplan IC, Gaichas SK, Stawitz CC, Lynch PD, Marshall KN, Deroba JJ, Masi M, Brodziak JKT, Aydin KY, Holsman K, et al. (in review). Management strategy evaluation: allowing the light on the hill to illuminate more than one species. Front Mar Sci.
- Kaplan IC, Hansen C, Morzaria-Luna HN, Girardin R, Marshall KN. 2020. Ecosystem-based harvest control rules for Norwegian and US Ecosystems. Front Mar Sci. 7:652. doi:https://doi.org/10.3389/fmars.2020.00652
- Kaplan IC, Horne PJ, Levin PS. 2012. Screening California Current fishery management scenarios using the Atlantis end-to-end ecosystem model. Prog Oceanogr. 102:5–18. doi:https://doi.org/10.1016/j.pocean.2012.03.009
- Kaplan IC, Koehn LE, Hodgson EE, Marshall KN, Essington TE. 2017. Modeling food web effects of low sardine and anchovy abundance in the California Current. Ecol Model. 359:1–24. doi:https://doi.org/10.1016/j.ecolmodel.2017.05.007
- Kaplan IC, Marshall KN. 2016. A guinea pig’s tale: learning to review end-to-end marine ecosystem models for management applications. ICES J Mar Sci. 73(7):1715–1724. doi:https://doi.org/10.1093/icesjms/fsw047
- Kell LT, Mosqueira I, Grosjean P, Fromentin J-M, Garcia D, Hillary R, Jardim E, Mardle S, Pastoors MA, Poos JJ, et al. 2007. FLR: an open-source framework for the evaluation and development of management strategies. ICES J Mar Sci. 64(4):640–646. doi:https://doi.org/10.1093/icesjms/fsm012
- Kishi MJ, Ito S, Megrey BA, Rose KA, Werner FE. 2011. A review of the NEMURO and NEMURO.FISH models and their application to marine ecosystem investigations. J Oceanogr. 67(1):3–16. doi:https://doi.org/10.1007/s10872-011-0009-4
- Kumar R, Surma S, Pitcher TJ, Varkey D, Lam ME, Ainsworth CH, Pakhomov E. 2016. An ecosystem model of the ocean around Haida Gwaii, Northern British Columbia: ecopath, ecosim and ecospace. Fish Cent Res Rep. 24:76. doi:https://doi.org/10.14288/1.0354480
- Lam M, Pitcher T, Surma S, Scott J, Kaiser M, White A, Pakhomov E, Ward L. 2019. Value- and ecosystem-based management approach: the Pacific herring fishery conflict. Mar Ecol Prog Ser. 617–618:341–364. doi:https://doi.org/10.3354/meps12972
- Levin P, Fogarty M, Matlock G, Ernst M. 2008. Integrated ecosystem assessments. NOAA Technical Memorandum NMFS-NWFSC-92. p. 20. US Department of Commerce, La Jolla, California.
- Levin P, Fogarty M, Murawski S, Fluharty D. 2009. Integrated ecosystem assessments: developing the scientific basis for ecosystem-based management of the ocean. PLoS Biol. 7(1):e1000014. doi:https://doi.org/10.1371/journal.pbio.1000014
- Lindstrøm U, Smout S, Howell D, Bogstad B. 2009. Modelling multi-species interactions in the Barents Sea ecosystem with special emphasis on minke whales and their interactions with cod, herring and capelin. Deep Sea Res Part II Top Stud Oceanogr. 56(21-22):2068–2079. doi:https://doi.org/10.1016/j.dsr2.2008.11.017
- Link J, Ihde TF, Harvey CJ, Gaichas SK, Field JC, Brodziak JKT, Townsend HM, Peterman RM. 2012. Dealing with uncertainty in ecosystem models: the paradox of use for living marine resource management. Prog Oceanogr. 102:102–114. doi:https://doi.org/10.1016/j.pocean.2012.03.008
- Link J. 2010a. Adding rigor to ecological network models by evaluating a set of pre-balance diagnostics: a plea for PREBAL. Ecol Model. 221(12):1580–1591. doi:https://doi.org/10.1016/j.ecolmodel.2010.03.012
- Link J. 2010b. Ecosystem-based fisheries management: confronting tradeoffs. New York, NY: Cambridge University Press.
- Little R, Fulton EA, Gray R, Hayes D, Lyne V, Scott R, Sainsbury KJ, McDonald D. 2006. Management strategy evaluation results and discussion for Australia’s North West Shelf. North West Shelf Joint Environmental Management Study. Technical Report No. 14. Australia: Commonwealth Scientific and Industrial Research Organisation (CSIRO).
- Mackinson S, Daskalov G. 2007. An ecosystem model of the North Sea to support an ecosystem approach to fisheries management: description and parameterisation. Sci Ser Tech Rep. 142:196.
- Mackinson S, Platts M, Buzowski J, Steenbeek J, Walters C, Hadeler S, Rossberg A, Garcia C, Lynam C. 2017. Management Strategy Evaluation toolkit for Ecopath with Ecosim (model output and technical report). UK: Cefas Laboratory. doi:https://doi.org/10.14466/CefasDataHub.44.
- Mackinson S, Platts M, Garcia C, Lynam C. 2018. Evaluating the fishery and ecological consequences of the proposed North Sea multi-annual plan. PLoS One. 13(1):e0190015. doi:https://doi.org/10.1371/journal.pone.0190015
- Mackinson S. 2000. Representing trophic interactions in the North Sea in the 1880s, using the Ecopath mass-balance approach. In: Guénette S, Christensen V, Pauly D, editors. Fisheries impacts on North Atlantic Ecosystems: Models and Analyses Fisheries Centre Research Reports. Vol. 9(4). p. 35–98. The Fisheries Centre, University of British Columbia, Canada.
- Mackinson S. 2002. Simulating management options for the North Sea in the 1880s. In: Pitcher TJ, Cochrane KL, editors. The use of ecosystem models to investigate multispecies management strategies for capture fisheries. Vancouver, B.C., Canada: Fisheries Centre Research Reports; p. 73–82.
- Mackinson S. 2014. Combined analyses reveal environmentally driven changes in the North Sea ecosystem and raise questions regarding what makes an ecosystem model’s performance credible? Can J Fish Aquat Sci. 71(1):31–46. doi:https://doi.org/10.1139/cjfas-2013-0173
- Manickchand-Heileman S, Soto LA, Escobar E. 1998. A preliminary trophic model of the continental shelf, South-western Gulf of Mexico. Estuar Coast Shelf Sci. 46(6):885–899. doi:https://doi.org/10.1006/ecss.1997.0324
- Martell SJD, Beattie AI, Walters CJ, Nayar T, Briese R. 2002. Simulating fisheries management strategies in the Strait of Georgia ecosystem using Ecopath and Ecosim In Pitcher TJ, Cochrane KL, editors. The use of ecosystem models to investigate multispecies management strategies for capture fisheries. Vancouver, B.C., Canada: Fisheries Centre Research Reports; p. 16–23.
- Masi MD, Ainsworth CH, Chagaris D. 2014. A probabilistic representation of fish diet compositions from multiple data sources: a Gulf of Mexico case study. Ecol Model. 284:60–74. doi:https://doi.org/10.1016/j.ecolmodel.2014.04.005
- Masi MD, Ainsworth CH, Kaplan IC, Schirripa MJ. 2018. Interspecific interactions may influence reef fish management strategies in the Gulf of Mexico. Mar Coast Fish. 10(1):24–39. doi:https://doi.org/10.1002/mcf2.10001
- Masi MD. 2016. An ecosystem-based approach to reef fish management in the Gulf of Mexico Graduate Theses and Dissertations. Tampa, Florida: University of South Florida.
- McDonald AD, Fulton EA, Little LR, Gray RC, Sainsbury KJ, Lyne VD. 2006. Multiple-use management strategy evaluation for coastal marine ecosystems using in vitro. In: Perez P, Batten D, editors. Complex science for a complex world: exploring human ecosystems with agents. Canberra, ACT, Australia: ANU E Press; p. 283–298.
- McDonald AD, Little LR, Gray R, Fulton E, Sainsbury KJ, Lyne VD. 2008. An agent-based modelling approach to evaluation of multiple-use management strategies for coastal marine ecosystems. Math Comput Simulat. 78(2-3):401–411. doi:https://doi.org/10.1016/j.matcom.2008.01.039
- Methot RD, Wetzel CR. 2013. Stock synthesis: a biological and statistical framework for fish stock assessment and fishery management. Fish Res. 142:86–99. doi:https://doi.org/10.1016/j.fishres.2012.10.012
- Morzaria-Luna HN, Ainsworth CH, Tarnecki JH, Grüss A. 2018. Diet composition uncertainty determines impacts on fisheries following an oil spill. Ecosyst Serv. 33:187–198. doi:https://doi.org/10.1016/j.ecoser.2018.05.002
- Nakazawa M. 2019. fmsb: functions for medical statistics book with some demographic data. R package version 0.6.3. https://CRAN.R-project.org/package=fmsb.
- Nsiku E. 2002. Exploration of management and conservation strategies for the multispecies fisheries of Lake Malawi using an ecosystem modelling approach. In: Pitcher TJ, Cochrane KL, editors. The use of ecosystem models to investigate multispecies management strategies for capture fisheries. Vancouver, B.C., Canada: Fisheries Centre Research Reports; p. 54–67.
- Nyamweya CS, Sturludottir E, Tomasson T, Taabu-Munyaho A, Njiru M, Stefansson G. 2017. Prediction of Lake Victoria’s response to varied fishing regimes using the Atlantis ecosystem model. Fish Res. 194:76–83. doi:https://doi.org/10.1016/j.fishres.2017.05.014
- O’Farrell H, Grüss A, Sagarese SR, Babcock EA, Rose KA. 2017. Ecosystem modeling in the Gulf of Mexico: current status and future needs to address ecosystem-based fisheries management and restoration activities. Rev Fish Biol Fisheries. 27(3):587–614. doi:https://doi.org/10.1007/s11160-017-9482-1
- Okamura H, Ichinokawa M, Komori O. 2018. Ecosystem model in data-poor situations. In: Aoki I, Yamakawa T, Takasuka A, editors. Fish population dynamics, monitoring, and management: sustainable fisheries in the eternal ocean. Japan, Tokyo: Springer; p. 207–225.
- Okey TA, Pauly D. 1999a. Trophic mass-balance model of Alaska’s Prince William Sound Ecosystem, for the Post-Spill Period 1994-1996: 2nd Edition. Fish Cent Res Rep. (4). Vancouver: University of British Columbia. p. 138.
- Okey TA, Pauly D. 1999b. A mass-balanced model of trophic flows in Prince William Sound: decompartmentalizing ecosystem knowledge. In: Ecosystem approaches for fisheries management. Alaska Sea Grant: University of Alaska Fairbanks; p. 621–635. doi:https://doi.org/10.4027/eafm.1999.45
- Okey TA, Wright BA. 2004. Toward ecosystem-based extraction policies for Prince William Sound, Alaska: integrating conflicting objectives and rebuilding pinnipeds. B Mar Sci. 74:727–747.
- Okey TA. 2002. Simulating extreme fishing policies in Prince William Sound, Alaska: a preliminary evaluation of an ecosystem-based policy analysis tool. In: Pitcher TJ, Cochrane KL, editors. The use of ecosystem models to investigate multispecies management strategies for capture fisheries. Vancouver, B.C., Canada: Fisheries Centre Research Reports; p. 94–108.
- Olsen E, Fay G, Gaichas S, Gamble R, Lucey S, Link JS. 2016. Ecosystem model skill assessment. yes we can! PLoS One. 11(1):e0146467. doi:https://doi.org/10.1371/journal.pone.0146467
- Pauly D, Christensen V, Walters C. 2000. Ecopath, Ecosim, and Ecospace as tools for evaluating ecosystem impact of fisheries. ICES J Mar Sci. 57(3):697–706. doi:https://doi.org/10.1006/jmsc.2000.0726
- Pérez-Rodríguez A, Howell D, Casas M, Saborido-Rey F, Ávila-de Melo A. 2017. Dynamic of the Flemish Cap commercial stocks: use of a Gadget multispecies model to determine the relevance and synergies among predation, recruitment, and fishing. Can J Fish Aquat Sci. 74(4):582–597. doi:https://doi.org/10.1139/cjfas-2016-0111
- Pérez-Rodríguez A, Howell D, Umar I. 2019. EU SC05 project: “Multispecies Fisheries Assessment for NAFO.” Estimation of multispecies based HCRs and use of a multispecies MSE framework to assess the risk of collapse and the fishery-ecological trade-offs. Northwest Atlantic Fisheries Organization, NAFO SCR Doc. 19/017.
- Pethybridge HR, Weijerman M, Perryman HA, Audzijonyte A, Porobic J, McGregor V, Girardin R, Bulman C, Ortega-Cisneros K, Sinerchia M, et al. 2019. Calibrating process-based marine ecosystem models: an example case using Atlantis. Ecol Model. 412:108822. doi:https://doi.org/10.1016/j.ecolmodel.2019.108822
- Pikitch E, Boersma PD, Boyd I, Conover D, Cury P, Essington T, Heppell S, Houde E, Mangel M, Pauly D, et al. 2012. Little fish, big impact: managing a crucial link in ocean food webs. Washington, DC: Lenfest Ocean Program.
- Pitcher TJ, Cochrane KL. 2002. The use of ecosystem models to investigate multispecies management strategies for capture fisheries. Vancouver, B.C., Canada: The Fisheries Centre, Cape Town, Africa: University of British Columbia.
- Plagányi ÉE, Butterworth DS. 2006a. A Spatial Multi-species Operating Model (SMOM) of krill–predator interactions in small-scale management units in the Scotia Sea. Cape Town, Africa: University of Cape Town.
- Plagányi ÉE, Butterworth D. 2006b. An illustrative management procedure for exploring dynamic feedback in krill catch limit allocations among small-scale management units. Cape Town, Africa: University of Cape Town.
- Plagányi ÉE, Butterworth DS. 2007. A spatial multi-species operating model of the Antarctic Peninsula krill fishery and its impacts on land-breeding predators. Cape Town, Africa: University of Cape Town.
- Plagányi ÉE, Butterworth DS. 2012. The Scotia Sea krill fishery and its possible impacts on dependent predators: modeling localized depletion of prey. Ecol Appl. 22(3):748–761. doi:https://doi.org/10.1890/11-0441.1
- Plagányi ÉE, Punt AE, Hillary R, Morello EB, Thébaud O, Hutton T, Pillans RD, Thorson JT, Fulton EA, Smith ADM, et al. 2014. Multispecies fisheries management and conservation: tactical applications using models of intermediate complexity. Fish Fish. 15(1):1–22. doi:https://doi.org/10.1111/j.1467-2979.2012.00488.x
- Plagányi ÉE, Rademeyer RA, Butterworth DS, Cunningham CL, Johnston SJ. 2007. Making management procedures operational—innovations implemented in South Africa. ICES J Mar Sci. 64(4):626–632. doi:https://doi.org/10.1093/icesjms/fsm043
- Plagányi ÉE. 2007. Models for an ecosystem approach to fisheries. FAO Fisheries Technical Paper No. 477. Rome
- Plagányi ÉE. 2016. Using simulation evaluation to account for ecosystem considerations in fisheries management. In: Edwards CTT, Dankel DJ, editors. Management science in fisheries: an introduction to simulation-based methods. New York, NY: Routledge; p. 298–318.
- Punt AE, Butterworth DS, de Moor CL, Oliveira JAAD, Haddon M. 2016a. Management strategy evaluation: best practices. Fish Fish. 17(2):303–334. doi:https://doi.org/10.1111/faf.12104
- Punt AE, Butterworth DS. 1995. The effects of future consumption by the Cape fur seal on catches and catch rates of the Cape hakes. 4. Modelling the biological interaction between Cape fur seals Arctocephalus pusillus pusillus and the Cape hakes Merluccius capensis and M. paradoxus. S Afr J Marine Sci. 16(1):255–285. doi:https://doi.org/10.2989/025776195784156494
- Punt AE, Dunn A, Elvarsson BÞ, Hampton J, Hoyle SD, Maunder MN, Methot RD, Nielsen A. 2020. Essential features of the next-generation integrated fisheries stock assessment package: a perspective. Fish Res. 229:105617. doi:https://doi.org/10.1016/j.fishres.2020.105617
- Punt AE, MacCall AD, Essington TE, Francis TB, Hurtado-Ferro F, Johnson KF, Kaplan IC, Koehn LE, Levin PS, Sydeman WJ. 2016b. Exploring the implications of the harvest control rule for Pacific sardine, accounting for predator dynamics: a MICE model. Ecol Model. 337:79–95. doi:https://doi.org/10.1016/j.ecolmodel.2016.06.004
- Punt AE, Siddeek MSM, Garber-Yonts B, Dalton M, Rugolo L, Stram D, Turnock BJ, Zheng J. 2012. Evaluating the impact of buffers to account for scientific uncertainty when setting TACs: application to red king crab in Bristol Bay, Alaska. ICES J Mar Sci. 69(4):624–634. doi:https://doi.org/10.1093/icesjms/fss047
- Punt AE, Smith ADM, Cui G. 2001. Defining robust harvest strategies, performance indicators and monitoring strategies for the SEF. FRDC Project 98/102. Hobart: Fisheries Research & Development Corporation & CSIRO Marine Research.
- Punt AE, Smith ADM. 1999. Harvest strategy evaluation for the eastern stock of gemfish (Rexea solandri). ICES J Mar Sci. 56(6):860–875. doi:https://doi.org/10.1006/jmsc.1999.0538
- R Core Team. 2017. R: a language and environment for statistical computing. Vienna, Austria: R Foundation for Statistical Computing. https://www.R-project.org/.
- Rademeyer RA, Butterworth DS, Plagányi ÉE. 2008. A history of recent bases for management and the development of a species-combined Operational Management Procedure for the South African hake resource. Afr J Mar Sci. 30(2):291–310. doi:https://doi.org/10.2989/AJMS.2008.30.2.8.558
- Rademeyer RA, Plagányi ÉE, Butterworth DS. 2007. Tips and tricks in designing management procedures. ICES J Mar Sci. 64(4):618–625. doi:https://doi.org/10.1093/icesjms/fsm050
- Sainsbury KJ, Campbell RA, Lindholm R, Whitelaw AW. 1997. Experimental management of an Australian multi-species fishery: examining the possibility of trawl-induced habitat modification. In: Pikitch EK, Huppert DD, Sissenwine MP, editors. Global trends: fisheries management: proceedings of the symposium. Maryland, USA: American Fisheries Society; p. 107–112.
- Sainsbury KJ, Punt AE, Smith ADM. 2000. Design of operational management strategies for achieving fishery ecosystem objectives. ICES J Mar Sci. 57(3):731–741. doi:https://doi.org/10.1006/jmsc.2000.0737
- Sainsbury KJ. 1991. Application of an experimental approach to management of a tropical multispecies fishery with highly uncertain dynamics. ICES Mar Sci Symp. 193:301–320.
- Schnute JT, Maunder MN, Ianelli JN. 2007. Designing tools to evaluate fishery management strategies: can the scientific community deliver? ICES J Mar Sci. 64(6):1077–1084. doi:https://doi.org/10.1093/icesjms/fsm109
- Schweder T, Hagen GS, Hatlebakk E. 1998. On the effect on cod and herring fisheries of returning the Revised Management Procedure for minke whaling in the greater Barents Sea. Fish Res. 37(1-3):77–95. doi:https://doi.org/10.1016/S0165-7836(98)00128-3
- Schweder T, Hagen GS, Hatlebakk E. 2000. Direct and indirect effects of minke whale abundance on cod and herring fisheries: a scenario experiment for the Greater Barents Sea. NAMMCOSP. 2:120–132. doi:https://doi.org/10.7557/3.2976
- Scientific Technical and Economic Committee for Fisheries (STECF). 2015. Evaluation of management plans: evaluation of the multi-annual plan for the North Sea demersal stocks (STECF-15-04). EUR 27232 EN, JRC 95959. Luxembourg: Publications Office of the European Union.
- Shin Y-J, Cury P. 2001. Exploring fish community dynamics through size-dependent trophic interactions using a spatialized individual-based model. Aquat Living Resour. 14(2):65–80. doi:https://doi.org/10.1016/S0990-7440(01)01106-8
- Shin Y-J, Houle JE, Akoglu E, Blanchard JL, Bundy A, Coll M, Demarcq H, Fu C, Fulton EA, Heymans JJ, Salihoglu B, et al. 2018. The specificity of marine ecological indicators to fishing in the face of environmental change: a multi-model evaluation. Ecol Indic. 89:317–326. doi:https://doi.org/10.1016/j.ecolind.2018.01.010
- Skern‐Mauritzen M, Ottersen G, Handegard NO, Huse G, Dingsør GE, Stenseth NC, Kjesbu OS. 2016. Ecosystem processes are rarely included in tactical fisheries management. Fish Fish. 17(1):165–175. doi:https://doi.org/10.1111/faf.12111
- Smith ADM, Fulton E, Hobday AJ, Smith DC, Shoulder P. 2007. Scientific tools to support the practical implementation of ecosystem-based fisheries management. ICES J Mar Sci. 64(4):633–639. doi:https://doi.org/10.1093/icesjms/fsm041
- Smith ADM, Sachse ML, Smith DC, Prince JD, Knuckey IA, Baelde P, Walker TJ, Talman S. 2004. Alternative management strategies for the Southern and Eastern Scalefish and Shark Fishery – qualitative assessment report. Canberra: Australian Fisheries Management Authority.
- Smith ADM, Sainsbury KJ, Stevens RA. 1999. Implementing effective fisheries-management systems – management strategy evaluation and the Australian partnership approach. ICES J Mar Sci. 56(6):967–979. doi:https://doi.org/10.1006/jmsc.1999.0540
- Smith ADM, Ward TM, Hurtado N, Klaer N, Fulton EA, Punt AE. 2015a. Review and update of harvest strategy settings for the Commonwealth Small Pelagic Fishery - Single species and ecosystem considerations. Final Report of FRDC Project No. 2013/028. Hobart: Fisheries Research and Development Corporation.
- Smith ADM. 1994. Management strategy evaluation – the light on the hill. In: Hancock DA, editor. Population dynamics for fisheries management. Perth: Australian Society for Fish Biology; p. 249–253.
- Smith MD, Fulton EA, Day RW, Shannon LJ, Shin Y-J. 2015b. Ecosystem modelling in the southern Benguela: comparisons of Atlantis, Ecopath with Ecosim, and OSMOSE under fishing scenarios. Afr J Mar Sci. 37(1):65–78. doi:https://doi.org/10.2989/1814232X.2015.1013501
- Stäbler M, Kempf A, Mackinson S, Poos JJ, Garcia C, Temming A. 2016. Combining efforts to make maximum sustainable yields and good environmental status match in a food-web model of the southern North Sea. Ecol Model. 331:17–30. doi:https://doi.org/10.1016/j.ecolmodel.2016.01.020
- Stäbler M, Kempf A, Temming A. 2014. Potatoes of opportunity for fishing in the southern North Sea: using Ecopath with Ecosim to identify MSY and GES options. Fish Cent Res Rep. 22:22–29.
- Steenbeek J, Buszowski J, Christensen V, Akoglu E, Aydin K, Ellis N, Felinto D, Guitton J, Lucey S, Kearney K, et al. 2016. Ecopath with Ecosim as a model-building toolbox: source code capabilities, extensions, and variations. Ecol Model. 319:178–189. doi:https://doi.org/10.1016/j.ecolmodel.2015.06.031
- Surma S, Pitcher TJ, Kumar R, Varkey D, Pakhomov EA, Lam ME. 2018. Herring supports Northeast Pacific predators and fisheries: insights from ecosystem modelling and management strategy evaluation. PLoS One. 13(7):e0196307. doi:https://doi.org/10.1371/journal.pone.0196307
- Surma S. 2019. Pacific Herring (Clupea pallasii) Trophodynamics and Fisheries in the Northeast Pacific Ocean Graduate Theses and Dissertations. Vancouver, Canada: University of British Columbia.
- Tarnecki JH, Wallace AA, Simons JD, Ainsworth CH. 2016. Progression of a Gulf of Mexico food web supporting Atlantis ecosystem model development. Fish Res. 179:237–250. doi:https://doi.org/10.1016/j.fishres.2016.02.023
- Taylor MH, Wolff M, Vadas F, Yamashiro C. 2008. Trophic and environmental drivers of the Sechura Bay ecosystem (Peru) over an ENSO cycle. Helgol Mar Res. 62(S1):15–32. doi:https://doi.org/10.1007/s10152-007-0093-4
- Thomson RB, Butterworth DS, Boyd IL, Croxall JP. 2000. Modeling the consequences of Antarctic krill harvesting on Antarctic fur seals. Ecol Appl. 10(6):1806–1819. doi:https://doi.org/10.1890/1051-0761(2000)010[10.1890/1051-0761(2000)010[1806:MTCOAK]2.0.CO;2]
- Thorpe RB, De Oliveira JAA. 2019. Comparing conceptual frameworks for a fish community MSY (FCMSY) using management strategy evaluation—an example from the North Sea. ICES J Mar Sci. 76(4):813–823. doi:https://doi.org/10.1093/icesjms/fsz015
- Thorpe RB, Jennings S, Dolder PJ. 2017. Risks and benefits of catching pretty good yield in multispecies mixed fisheries. ICES J Mar Sci. 74(8):2097–2106. doi:https://doi.org/10.1093/icesjms/fsx062
- Thorpe RB, Quesne WJFL, Luxford F, Collie JS, Jennings S. 2015. Evaluation and management implications of uncertainty in a multispecies size-structured model of population and community responses to fishing. Methods Ecol Evol. 6(1):49–58. doi:https://doi.org/10.1111/2041-210X.12292
- Tjelmeland S, Bogstad B. 1998. MULTSPEC – a review of a multispecies modelling project for the Barents Sea. Fish Res. 37(1-3):127–142. doi:https://doi.org/10.1016/S0165-7836(98)00132-5
- Trites AW, Livingston PA, Vasconcellos MC, Mackinson S, Springer AM, Pauly D. 1999. Ecosystem considerations and the limitations of ecosystem models in fisheries management: insights from the Bering Sea. In: Ecosystem Approaches for Fisheries Management. Fairbanks, Alaska: Alaska Sea Grant College Program AK-SG-99-01. p. 609–619 doi:https://doi.org/10.4027/eafm.1999.44
- United Nations. 2015. United Nations General Assembly: Transforming Our World: The 2030 Agenda for Sustainable Development. Draft resolution referred to the United Nations summit for the adoption of the post-2015 development agenda by the General Assembly at its sixty-ninth session. United Nations, General Assembly, New York.
- Vasconcellos M, Heymans J, Bundy A. 2002. The use of Ecosim to investigate multispecies harvesting strategies for capture fisheries of the Newfoundland-Labrador shelf. In: Pitcher TJ, Cochrane KL, editors. The use of ecosystem models to investigate multispecies management strategies for capture fisheries. Vancouver, B.C., Canada: Fisheries Centre Research Reports; p. 68–72.
- Walters CJ, Christensen V, Pauly D. 2002. Searching for optimum fishing strategies for fishery development, recovery and sustainability. In: Pitcher TJ, Cochrane KL, editors. The use of ecosystem models to investigate multispecies management strategies for capture fisheries. Vancouver, B.C., Canada: Fisheries Centre Research Reports; p. 11–15.
- Walters CJ, Martell SJD, Korman J. 2006. A stochastic approach to stock reduction analysis. Can J Fish Aquat Sci. 63(1):212–223. doi:https://doi.org/10.1139/f05-213
- Walters CJ. 2004. Simple representation of the dynamics of biomass error propagation for stock assessment models. Can J Fish Aquat Sci. 61(7):1061–1065. doi:https://doi.org/10.1139/f04-120
- Wickham H. 2016. ggplot2: elegant graphics for data analysis. 2nd ed. New York: Springer-Verlag.
- Yu G. 2019. scatterpie: scatter Pie Plot. R package version 0.1.4. https://CRAN.R-project.org/package=scatterpie.
- Zeller D, Freire K. 2002. A preliminary North-East Atlantic marine ecosystem model: the Faroe Islands and ICES Area Vb. In: Pitcher TJ, Cochrane KL, editors. The use of ecosystem models to investigate multispecies management strategies for capture fisheries. Vancouver, B.C., Canada: Fisheries Centre Research Reports; p. 39–45.
- Zetina-Rejón MJ, Arreguín-Sánchez F, Chávez EA. 2001. Using an ecosystem modeling approach to assess the management of a Mexican coastal lagoon system. Cal Coop Ocean Fish. 42:88–96.
- Zetina-Rejón MJ. 2000. Influencia de la Pesca de Camarón en la Estructura Del Ecosistema Lagunar Huizache-Caimanero Sinaloa, México [MS thesis]. Centro Interdisciplinario de Ciencias Marinas-IPN.