
 ?Mathematical formulae have been encoded as MathML and are displayed in this HTML version using MathJax in order to improve their display. Uncheck the box to turn MathJax off. This feature requires Javascript. Click on a formula to zoom.
Abstract
A range of sustainability metrics have been proposed over the years that calculate the various efficiencies (and inefficiencies) of the use of feed in animal production (terrestrial livestock and aquaculture) and more specifically the utilization of the marine ingredient content of that feed. Like all metrics though, they come with some assumptions and are only as good as the reliability of the data feeding into them. The ones commonly used in the marine ingredients sector include eFIFO, FFDR, FIFO and FCR. In this review the basis of each of these metrics, aspects of their origins and each of their short comings is discussed. It is noted that many of these metrics fail to recognize the foundational role that marine ingredients play in supporting global “blue-food” production when misapplied. Subsequently an alternative strategy is proposed to assess the sustainability of marine ingredients based on a life cycle assessment (LCA) approach. With this shift we provide the reasoning behind this move toward a more transparent assessment process and how this will better support aquaculture to move forward by being able to assess the sustainability of the use of all feed ingredient resources on an equivalent basis.
Introduction
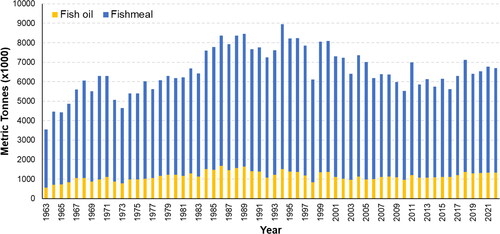
The marine ingredients of fish oil and fishmeal have arguably underpinned the development of intensive aquaculture since the inception of the sector in the 1970s (Zhang et al. Citation2020; Hardy et al. Citation2022; Glencross et al. Citation2023). As ingredients, they provided clear nutritional advantages in terms of their nutrient density, amino acid/fatty acid balance, digestibility, and palatability (Tacon and Metian Citation2015; Glencross Citation2020; Hardy et al. Citation2022). Despite increases in demand from the 1990s onwards, the production of marine ingredients initially increased to a peak of almost nine million tonnes in 1994, before some volatility in the late 1990s due to a combination of climatic events and overfishing led to a sector wide rationalization in the early 2000s () (Tacon Citation2004; Shepherd and Jackson Citation2013). Following this period, many of the fisheries contributing to this marine ingredient production recognized their capacities and various fishery management strategies were implemented across many of those fisheries around the developed world from the late 1990s onwards (Hilborn et al. Citation2022). Notably, from the early 2000s many of those fishery management programs introduced varying degrees of independent assessment leading to a large-scale rationalization of many of the global forage fisheries with a defining management feature being the reduction in fishing effort across the sector (Hilborn et al. Citation2022).
Figure 1. Global fishmeal and fish oil production from 1963 to 2022 (data IFFO Citation2024).
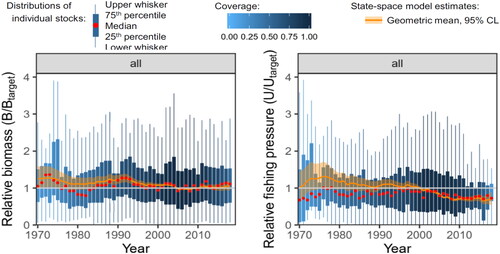
This increasing level of effective science-based management, which led to a systematic reduction in fishing effort of those forage fisheries, has contributed to a stabilized global biomass of those stocks as represented by the existing biomass against the expected maximum sustainable yield biomass (B/BMSY) () (Hilborn et al. Citation2022). This reduction in effort, combined with modernization of fishing fleets, has allowed the sector to maintain capture of between 15 and 20 million tonnes of fish per annum globally (Hilborn et al. Citation2022). While there remain many fisheries around the world coming under increasingly unsustainable pressure (FAO Citation2022), particularly in the developing world, the science clearly shows that when effective fisheries management practices are implemented, often in combination with restructuring fishing effort, then there is clear capacity to rebuild many of the fish stocks whilst continuing to exploit them, and the current evidence clearly demonstrates this for many forage fisheries (Hilborn et al. Citation2020). The case studies presented for many of the small pelagic fisheries clearly demonstrates this potential, with their management in many cases being an exemplar of world’s best practice (Hilborn et al. Citation2020, Citation2022).
Figure 2. Relative biomass and relative fish pressure indicators of small pelagic fisheries from 1970 through to 2019. Notable is how mean relative biomass has virtually always maintained at or above Btarget, and how changes in fishing effort have had to be introduced to maintain this biomass. Figure reproduced from Hilborn et al. (Citation2022).
Seafood is required to feed the world’s growing population but must be managed sustainably (FAO Citation2022). Resources from seafood can provide important nutrition to the human population, which can be targeted either through direct consumption or indirectly through animal feeds. Indirect application allows the use of marine resources which may not be palatable or available to many, to be converted into food that is nutritious, highly valued, and available (Tacon and Metian Citation2009, Citation2015; 2022). This paper considers the value of marine ingredients in a global nutrition context, to increase the availability of seafood through aquaculture, and how to ensure that aquaculture feeds develop sustainably whilst accounting for their dependence on a marine resource base, and accounting for the broader the environmental impacts of production.
Changing values lead to changing markets
The stasis in the volume of marine ingredient production over the past thirty years, when confronted with the burgeoning demand from aquaculture, has meant that the economic values of marine ingredients have risen substantially over time (). This growth in the value of the marine ingredient sector, in the absence of volume growth has meant that there have been marked changes in the use of the product that have also occurred over time, as increasingly the resources move toward those markets with the greater purchasing power () (Tacon and Metian Citation2008, Citation2009; Shepherd and Jackson Citation2013). Over fifty years ago, when the volume of global fishmeal and fish oil production was not drastically different in volumes to that of today (), the majority of the fishmeal was used for pig and poultry production. The emergence of intensive aquaculture in the 1980s saw a shift in the utilization of fishmeal being redirected to the more valuable and efficient use (economic gravity) of the resource by that sector (Glencross et al. Citation2023). Logic contends that this was a good move, as it meant the resource was being used more efficiently and maintained more of its nutritional value directly into our food chain. Over time the global aquaculture market has increasingly dominated the demand for fishmeal, with the purchasing power of the pig and poultry sectors not being able to compete with the higher market values and efficiencies of aquaculture except when fishmeal is applied to specialist high-value feeds like piglet weaner diets (IFFO Citation2024). All feeds (livestock and aquaculture) have only been able to be produced at current quantities due to the increased use of vegetable proteins, but the macro- and micronutrient density in fishmeal make it an important inclusion in aquaculture feeds, albeit presently at a much lower percent inclusion than twenty years ago (Naylor et al. Citation2000, Citation2021).
Figure 3. Historical (2010–2024) values (USD per Metric Tonne) of various grades of fishmeal (left) and fish oil (right) (data: IFFO Citation2024).
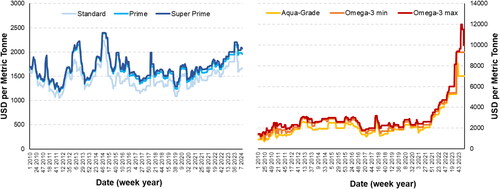
Figure 4. Changing utilization patterns of fishmeal (left) and fish oil (right) over the past sixty years have underpinned a transformation of the marine ingredients sector. Data from IFFO 2023.
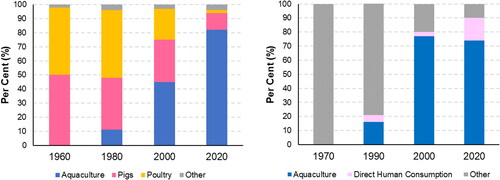
The history of the use of fish oil tells a slightly different story to that of fishmeal (). Initially, there was little perceived value for fish oil, and it was in many instances burnt as a fuel or used for other industrial purposes, such as a lubricant (IFFO Citation2024). Over time its value has grown to exceed that of fishmeal as it is increasingly being sought for direct human consumption (DHC), either as a nutraceutical omega-3 supplement or as a cooking oil in some cases (IFFO Citation2024). While the majority of the volume of fish oil continues to go to aquaculture, the growth in value is arguably coming from the DHC and petfood markets (). Recent commercial production of algal oil products, which command a market value of USD$150 – USD$250 per percentage EPA + DHA omega-3, is also driving prices of fish oil up, with recent moves by the fish oil sector seeing increases in prices up to USD$260–USD$360 per percentage EPA + DHA omega-3 subject to oil grade (IFFO Citation2024). The principal driver to this change was the discovery of the nutritional value to humans of the long-chain omega-3 fatty acids (Calder Citation2001, Citation2015). Their benefits in terms of human health have been widely extolled for several decades now and the omega-3 nutraceutical market has grown to become a major economic driver of fish oil consumption globally. In many fish oil production regions, the DHC demand has led to widespread changes in the regulations governing fish oil production, which has contributed to this cost increase. In addition to the DHC value, the benefits of omega-3 to many aquaculture species also became increasingly apparent. The majority of inclusion though, even in aquaculture feeds, is more about ensuring that the fish that are farmed maintain a high level of long-chain omega-3 for their human consumers, as most feed levels exceed documented requirements for the various aquaculture species (Glencross Citation2009; Aas et al. Citation2019, Citation2022). Once this is met, the energy requirements of the aquaculture species from the oils in the feeds can be met with vegetable or animal oils, which are now included at greater levels than 20 years ago, helping to ensure that the aquaculture feed sector can grow on the limited fish oil resources (Glencross Citation2009).
An important aspect of fishmeal production is that the process also yields fish oil from the same raw material base. The actual yields of fishmeal and fish oil differ from species to species, but globally the weighted average yield in 2020 was around 225 kg fishmeal and 48 kg fish oil per tonne of harvested fish raw material (). Over time these values have evolved to become more efficient, reflecting improved technologies and efficiency gains by the marine ingredient sector. They also vary year to year depending on the oil yield of different fish species, which occurs due to changes in environmental conditions, and the size/maturity of the fish at harvest (Galdos et al. Citation2002; Romotowska et al. Citation2016; Ferreira et al. Citation2020).
Table 1. Typical embodiment yields of fishmeal and fish oil as produced from major reduction fisheries. Data from IFFO 2023.
You cannot manage what you cannot measure
Concurrent with the recognition of the finite nature of global fisheries resources, constraints to the use of marine ingredients were also recognized early in the 1990s. Various observations by different sectors established that the supply of fishmeal was going to constrain the development of aquaculture as an industry and various research programs across the world were implemented to address this looming constraint (Boyd et al. Citation2020; Hardy et al. Citation2022; Glencross et al. Citation2023). Evolution of this concern gave rise to the notion that use of fisheries and from them the fishmeal and/or marine ingredients was unsustainable, despite that no specific metrics to evidence the case were demonstrated at the time.
Over the past 30 years, a range of sustainability metrics have been proposed that calculate the various efficiencies (and inefficiencies) of the use of feed in animal production and more specifically the marine ingredient content of that feed (Naylor et al. Citation2000, Citation2021; Tacon and Metian Citation2008; Jackson Citation2009; Kaushik and Troell Citation2010; Kok et al. Citation2020). Like all metrics though, they come with some assumptions and are only as good as the reliability of the data being applied to them. The purpose behind such metrics, like that of any metrics arguably, is that by establishing relevant goals and measuring progress, one can better demonstrate impact, effectiveness, and value. Transparency in decision making processes, assumptions, and the ability to compare different options remains a paramount issue in the application of such metrics. A key problem with simplistic metrics is that despite their apparent simplicity, they are widely open to misrepresentation and misinterpretation. In this regard, the ones commonly used in the marine ingredients sector include those metrics of FCR, FIFO, FFDR and eFIFO, which in many respects are each simply evolutions of the former. These metrics count all marine ingredients as equal – though clearly well managed fisheries are not equivalent to poorly managed, over-fished ones. They also focus solely on the use of marine ingredients, not taking into account impact of what may replace them in feeds, or how efficient this may be in the total production of farmed seafood and food more generally. A much more holistic approach is needed than the current focus on just fishmeal and fish oil.
FCR: the simplest metric
In the present context, the simplest of the sustainability metrics that have been used in fed aquaculture, is the FCR (feed conversion ratio). This defines the amount of feed fed to an animal to achieve 1 kg of weight gain of animal biomass. There are various versions of FCR, including eFCR (economic FCR = weight of feed fed/animal harvested) and bFCR (biological FCR = feed consumed/weight gain) (NRC 2011). As a metric, the eFCR can be used to define the various mass balances that occur in the process of farming animals, and it accounts for feed wastage as well as any animal production losses (e.g., mortalities) that occur (EquationEquation 1(1)
(1) ). The bFCR is a more theoretical metric used to define the biological efficiency of the feed (and/or animal) and it removes any non-consumed feed and production losses from the calculation to allow focus on the biological efficiency (NRC 2011). In some circumstances the scientific community have used feed conversion efficiency (FCE) as an alternative to bFCR. FCE is based on the weight gain per unit consumption, and as such is simply the reciprocal of the bFCR (NRC 2011). The bFCR is usually always lower than the eFCR. The FCR has the advantage in that it is conceptually quite simple; a comparison of salmon with an eFCR of 1.3 against chickens with an eFCR of 2 and pigs with an eFCR of 3, shows very easily the differences in efficiencies across different intensive animal production systems (Fry et al. Citation2018). Such a metric does not account for the quality of the feed input though (e.g., grain for broilers vs. protein concentrates for salmon).
(1)
(1)
Historically, over the past thirty years an improving trend in eFCR has been observed across all fed aquaculture sectors (). Key improvement drivers over this period include gains in nutritional knowledge of major species, allowing feeds to be tailored to each species needs more precisely to deliver nutrients more efficiently (Glencross et al. Citation2020). There have also been significant improvements in feed management strategies and associated technologies, resulting in improved feed intakes and ensuring less feed is lost, both of which also contribute to improving production efficiencies (Hardy et al. Citation2022). Notably, many sectors show eFCR values less than 1.0: 1 reflecting not only the high efficiency of aquaculture production, but also that in many such production systems the use of feed is supplemented by natural system productivity (Fry et al. Citation2018). The eFCR values by their nature reflecting this relationship between the feed fed and product harvested, irrespective of where the overall nutrition is derived from. Overall, total global fed aquaculture has a weighted average eFCR of 0.71 steadily improving from 0.75 in 2000. The only sector whose values are against the descending trend is shrimp. During this period an increasing proportion of shrimp aquaculture has moved from extensive to intensive farming processes, with most production now being fed with a compound feed unlike the situation earlier (especially in Asia).
Table 2. Sector wide and species specific eFCR values.
No sector functions in isolation
One of the first sustainability metrics developed that focussed specifically on the use of marine ingredients was the Fish In:Fish Out (FIFO) ratio (Naylor et al. Citation2000; Tacon and Metian Citation2008; Jackson Citation2009). The FIFO is a metric that was developed as a way to examine the “efficiency” of fish use in animal production. Most of the focus has been on aquaculture in relation to the use of wild fish in feed to produce farmed fish and as such assess the balance in perceived fish production in terms of nutrition available for direct human consumption. Conversely, a similar concept seems to have never been used in other animal production sectors that also use food grade materials to grow food animals (e.g., corn used to feed pigs and chickens), so there seems something of an imbalance in this assessment from an overall food production system perspective in this regard. Additionally, a problematic issue with FIFO has been its widespread misuse and miscalculation. Frequently proponents have argued for isolation of fishmeal or fish oil, failing to recognize in their arguments that you cannot get one without the other from the same fish biomass and therefore to contend that such resource use functions in isolation is nonsense. Therefore, in the following sections, the various equations and practices that have been published will be detailed, but only so as to highlight their flaws.
FIFO: assessing the balance
The Fish In:Fish Out ratio has arguably been one of the more widely used sustainability metrics found in the scientific literature. Although there are some disputes over the veracity of the concept, FIFO has been widely used as a simple benchmark of sustainability by the sector in relation to its environmental performance. FIFO is one of those metrics though, that has been subject to much confusion, misrepresentation, and misinterpretation since it was introduced.
FIFO is generally expressed as a ratio that takes into account the amount of marine ingredients in the feed though the distinction between forage and by-product resource use is not always consistent (Naylor et al. Citation2000, Citation2009; Tacon and Metian Citation2008). It is calculated as a function of the eFCR, the inclusion level of marine ingredients in the feed and the yield ratio of producing marine ingredients from fishery raw material. Notably, marine ingredient inclusion levels have changed considerably over the past twenty years, with typical inclusion levels in feed for various sectors based on industry estimates presented in .
Table 3. Sector wide and species-specific fishmeal and fish oil dietary inclusion levels. Shown also is the approximate ratio of forage fish versus by-product source for each.
FIFO has various limitations, including but not limited to, its application to one sector in isolation of a more global contribution (Naylor et al. Citation2000, Citation2009, Citation2021). Variants on the way in which FIFO has been calculated and key assumption values have caused confusion. In many of the representations, an approach to FIFO is often considered based on examining a single sector in isolation of others in the calculation. Other vagaries encountered include the fish oil and fishmeal yield values applied, and variation in these values can have significant impacts. Arguably, one of the earliest iterations of the FIFO calculation was that of Naylor et al. (Citation2000), who used a calculation based only on fishmeal inclusion, fishmeal yield from forage fish, the eFCR (though reported as feed:gain ratio), and a correction factor to account for the fraction of fishmeal from forage fisheries, which was claimed as 15/16th (¬94%) of total fishmeal production (EquationEquation 2.1(2.1)
(2.1) ; Naylor et al. Citation2000).
(2.1)
(2.1)
In the version by Naylor et al. (Citation2000), the focus is clearly just on fishmeal as driving the use of marine ingredients. Notably, in that earlier version it was recognized that EquationEquation 2.1(2.1)
(2.1) should only account for forage fish, with by-product-based fishmeal production excluded through the use of the 15/16th part of that equation. In this regard, it could be argued that this equation is actually a progenitor of the forage fish dependency ratio (FFDR), which will be discussed later. The equation missed though the important role that fish oils played in the marine ingredient sustainability story. This was subsequently addressed by Tacon and Metian (Citation2008), who included an additive term in their equation that represented the fish oil use and yield (EquationEquation 2.2
(2.1)
(2.1) ; Tacon and Metian Citation2008);
(2.2)
(2.2)
In the additive component scenario, EquationEquation 2.2(2.1)
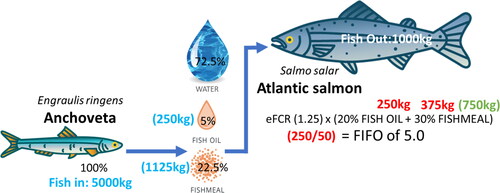
(2.1) assumes the position of the “fish in” is being defined by the highest ratio in the calculation, which then effectively discounts the additional volume of the lesser used resource as not contributing to fish production and therefore being wasted. A graphic example of this approach is shown in , where using the original numbers of Tacon and Metian (Citation2008), the reduction of 5000 kg of forage fish (e.g., Anchoveta; Engraulis ringens) produces 250 kg of fish oil and 1125 kg of fishmeal. This then sustains the fish oil demands of producing 1000 kg Atlantic salmon (Salmo salar) at an eFCR of 1.25 with a feed fish oil inclusion of 20% and fishmeal inclusion of 30% (requiring 250 kg of fish oil and 375 kg of fishmeal). This is where the often used argument of a FIFO of 5:1 comes from, that division of the fish oil demand of 250 kg divided by the yield from 1000 kg of anchoveta of 50 kg of fish oil. In the original calculations it was contended that the amount of “fish in” was based on the demand for oil alone, despite that the production of this amount of fish oil produces a 750 kg “surplus” of fishmeal, and that the additional usage of this surplus was not considered in the fish “out “component of the calculation. While a dependency on this amount of fish could be argued, it still does not accurately represent the complete notion of fish-in: fish-out.
Figure 5. The original FIFO argument for the reduction of 5000 kg of forage fish (Anchoveta) producing 250 kg of oil and 1125 kg of fishmeal. This then sustains the fish oil demands of producing 1000 kg Atlantic salmon at an eFCR of 1.25 with a feed fishoil inclusion of 20% and fishmeal inclusion of 30%. Note that 750 kg of fishmeal remains unaccounted for. The FIFO of 5.0 being based on the use of 250 kg of fish oil to produce one tonne of Atlantic salmon, when one tonne of Anchoveta produces 50 kg of fish oil.
In practice what happens is that the resources (both fish oil and fishmeal) inevitably go to the highest paying markets and there is no “surplus.” In the light of that reality, some revision of the concept being applied to a single sector in isolation of others was required. This issue with the original FIFO calculation was originally pointed out by Jackson (Citation2009), who proposed a different way of calculating FIFO based on the combined feed inclusion of fish oil and fishmeal over the combined embodiment yield of both fish oil and fishmeal (EquationEquation 2.3(2.1)
(2.1) ; Jackson Citation2009).
(2.3)
(2.3)
Around the same time, Naylor et al. (Citation2009) proposed another variant of the FIFO calculation. This amended version made some attempt to reconcile the issues of the co-use of fishmeal and fish oil, that were not addressed in Naylor et al. (Citation2000) while at the same time attempting to recoup the contribution of fish oil made from the fishmeal inclusion in a diet (EquationEquation 2.4(2.1)
(2.1) ; Naylor et al. Citation2009).
(2.4)
(2.4)
In this equation, the RFEFM was defined as the reduction fish equivalent for fishmeal, whereas the RFEAO was defined as the reduction fish equivalent for additional fish oil, when residual fish oil and the amount of oil extractable from the RFEFMare both subtracted from the total fish oil inclusion, assuming the residual oil content of the fishmeal is 8% yield. The inclusion of this additional step certainly did not clarify the situation, nor did it make much sense as the original data included in their study was based on the fish oil added to the diets, not the total lipid content of the diets, as can be noted by the reduction in fish oil inclusion between the inclusion estimates for 1995 and 2007, when in fact total lipid in salmonid diets over that period went up. Additionally, the yield value of 0.225 (22.5%) used for reduction fish equivalent from fishmeal already includes that oil content of the fishmeal in that value, so arguably it had already been accounted for. Notably, the authors include as a footnote to their calculation that this FIFO value (EquationEquation 2.4(2.1)
(2.1) ) could be altered to the average of the RFEFM + RFEFO where RFEFO is defined as the reduction fish equivalent for fish oil, not additional fish oil as presented earlier. Which seems to be an acknowledgement that the equation is better represented as that proposed by Jackson (Citation2009).
One of the key criticisms of the various Naylor et al. (Citation2000, Citation2009) calculations and those of Tacon and Metian (Citation2008), was that they failed to represent the complete “fish-out” side of the equation in each of their calculations, though it is acknowledged that this was somewhat addressed in a more recent analysis (Naylor et al. Citation2021). The easiest way to demonstrate the limitations of the earlier representation is through using a systems analysis approach and applying the same original numbers of Tacon and Metian (Citation2008) to EquationEquation 2.3(2.1)
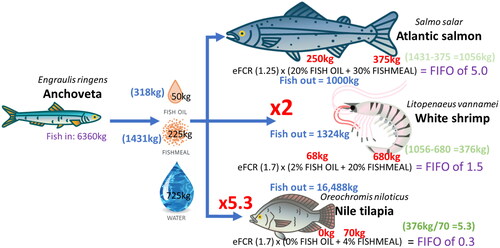
(2.1) . In this example, it can be seen that the reduction of 6360 kg of Anchoveta produces 318 kg of oil and 1431 kg of fishmeal (). This “fish in” then sustains the fish oil demands of producing 1000 kg Atlantic salmon at an eFCR of 1.25 with a feed fish oil inclusion of 20% and fishmeal inclusion of 30% (using 250 kg of oil and 350 kg of meal), leaving a fishmeal “surplus” of 1056 kg. In this example though, considering the additional production of 1324 kg of White shrimp (Litopenaeus vannamei) at an eFCR of 1.7 with a feed fish oil inclusion of 2% and fishmeal inclusion of 20% (using 68 kg of oil and 680 kg of meal), with a FIFO of 1.5:1.Using this FIFO ratio means that only 662 kg of shrimp is produced per 1000 kg of anchoveta, but the amount of the original surplus fishmeal means that double the output can be achieved within that same volume of anchoveta used for the fish oil production for the Atlantic salmon and the shrimp. This still leaves 376 kg of the fishmeal unused, which progressively falls to the markets with lower purchasing power, like that for example of Nile tilapia (Oreochromis niloticus). In this example, starter feeds for tilapia which use a low level of fishmeal, result in the overall tilapia production with an eFCR of 1.7 with no fish oil inclusion and fishmeal inclusion of 4% (using 0 kg of oil and 70 kg of meal), with a FIFO of 0.3:1 (or 3111 kg of tilapia per tonne of anchoveta). To use up the remaining fishmeal in this market system requires a multiplier of 5.3, meaning that 5.3 times the volume of tilapia is produced (16,488 kg). Therefore, from the original fish (anchoveta) “in” of 6360 kg, there is now a “fish out” of 1000 kg + 1324 kg + 16,488 kg = 18,812 kg. Such an assessment would yield a FIFO of 0.34 based on the complete utilization of the original “fish in.” While detractors might argue that this approach hides the sectors that have a higher burden, it could also be argued that those sectors with greater efficiencies and capacity to carry forward the value of those nutrients from the fish-in are the ones that get preferential use of the resource, and as such this represents the best use of a finite resource.
Figure 6. Using a systems analysis approach and the Tacon and Metian (Citation2008) data, it can be noted that the reduction of 6360 kg of forage fish produces 318 kg of fish oil and 1431 kg of fishmeal. This then sustains the demands of producing 1000 kg Atlantic salmon at an eFCR of 1.25 with a feed fish oil inclusion of 20% and fishmeal inclusion of 30% (using 250 kg of oil and 350 kg of meal), the production of 1324 kg of White shrimp at an eFCR of 1.7 with a feed fish oil inclusion of 2% and fishmeal inclusion of 20% (using 68 kg of oil and 680 kg of meal), and Nile tilapia with an eFCR of 1.7 with a feed fish oil inclusion of 0% and fishmeal inclusion of 4% (using 0 kg of oil and 376 kg of meal). Total fish out production is 18,812 kg, with a FIFO = 0.34 from the complete utilization of the fish in.
The use of EquationEquation 2.3(2.1)
(2.1) applied to global production data from 2000 to 2020, both as a total and for individual sectors resulted in FIFO values ranging from 0.01 for fed carps, to 3.89 for eels (). The global total FIFO value in 2020 was 0.27 across all marine ingredients used and fed fish produced. From a historical context, there has been a continued reduction in the FIFO values across all aquaculture sectors. This trend increasingly reflecting the use of fishmeal and fish oil as strategic ingredients at key points in aquaculture production cycles with a trend toward optimizing their nutritional contributions. The overall fed aquaculture figure shows a marked decrease from 0.66 in 2000 to 0.27 in 2020, essentially meaning that in 2020, for every 0.27 kg of whole wild fish used in marine ingredient production, a kilogram of farmed fish is produced. In other words, for every 1 kg of wild fish used around 4 kg of farmed fish is produced. Within specific aquaculture sectors, there has also been a reduction in FIFO values over time, but of particular note is the figure for salmonids, which for 2020 is now seen to be below or close to 1.0, i.e., the salmonid feed industry supports the production of equal amounts of farmed fish that it uses as feed fish. Overall, this is a very positive message about the contribution that marine ingredients make to global animal protein production. Following these examples, it can be seen that the marine ingredients industry supports the production of a significantly greater volume of animal protein for humanity than would be supplied merely through the direct consumption of the fish used as raw material in the production process.
Table 4. Sector wide and species-specific FIFO values calculated using the revised Jackson (Citation2009) calculation (Equation 2.3).
FFDR: redirecting priorities
An evolution from the FIFO was the Forage Fish Dependency Ratio (FFDR) as another conceptual metric for calculating the quantity of wild (forage) fish used in feeds in relation to the quantity of fed animal production (Aas et al. Citation2019). FFDR was originally developed as a way of attempting to quantify the environmental impact of feed use in aquaculture systems and there has been particular attention on FFDR in salmon aquaculture (Ytrestøyl et al. Citation2015; Aas et al. Citation2019). Like FIFO, the FFDR is expressed as a ratio that considers the amount of marine ingredients in the feed but focusses on those that originate from forage fisheries (Aas et al. Citation2019). It is calculated based on taking into account the eFCR, the inclusion level of forage fish derived marine ingredients in the feed (notably any marine ingredients produced from by-products are not included) and the yield ratio of producing marine ingredients from forage fisheries. In this regard some detail on the nature of the feed formulation used in any feed (and how that varies across a production cycle), including the origins of the marine ingredients, whether they are from forage resources or by-products needs to be obtained. This can be challenging as feed companies rarely give away details on specific formulations. Some researchers have had success in collating such industry wide data (Ytrestøyl et al. Citation2015; Aas et al. Citation2019, Citation2022).
One of the limitations to the use of FFDR is that the focus on forage fish assumes that the species used in marine ingredient production would have higher value to society by being used differently, such as through direct human consumption markets, or by environmental benefits through conservation (Pikitch et al. Citation2014; Avadi and Fréon Citation2013; Konar et al. Citation2019). When marine ingredients are produced from well managed fisheries though, or from by-product from fish from well managed fisheries, then their use in animal feeds can remain as one of the best use options of that resource (Newton et al. Citation2014; Cashion et al. Citation2017; Regueiro et al. Citation2022). As such, assumptions about the environmental impact of forage fish exploitation may not be valid. At first view, the FFDR (EquationEquation 3.1(3.1)
(3.1) ) can be seen to follow much of the structure of the FIFO equation (EquationEquation 2.3
(2.1)
(2.1) ):
(3.1)
(3.1)
Limitations to FFDR aside, it is a metric that has garnered some adoption by the certification sector. Notably the Aquaculture Stewardship Council (ASC 2022) has in its latest standards for aquaculture production a series of targets for producers to aim for where the FFDR values are directed toward meal and oil dependencies in isolation of each other. The issues with this have already been discussed, as they extend the same issue identified with a similar practice in FIFO metrics, namely that the same fish produces both meal and oil. For the record though, those isolation dependencies are calculated as such (Aas et al. Citation2019, Citation2022);
(3.2)
(3.2)
(3.3)
(3.3)
Historically, the forage fish dependency ratio (FFDR) values have also seen notable improvements between 2000 and 2020 (). In 2020, all values for each of the different species’ groups are below 1.0, with the exception for the category “Turtles and Frogs.” Major improvements in FFDR values for sectors like the salmonids and crustaceans are noted, with three-fold reductions achieved in those sectors over the past twenty years. Overall, global FFDR values across all fed aquaculture show that only 0.19 kg of forage fish is used for each kilogram of fed aquaculture production. There are various reasons underpinning these improvements. The nature of the FFDR calculation leverages off both the eFCR values and the marine ingredient inclusion values. Accordingly, improvements in eFCR impact the FFDR and this is noted from the changes in eFCR over time as observed earlier. Reductions in the inclusion of forage fish sourced marine ingredients through both changes in total marine ingredient use and the relative use of forage fish versus by-product sourced marine ingredients have also been influential ( and ).
Figure 7. Estimates of global fishmeal production and the proportion of that production from fish by-products. Redrawn from FAO SOFIA 2020.
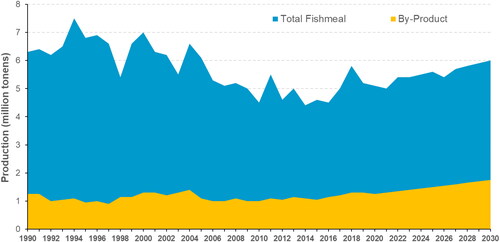
Table 5. Sector wide and species-specific FFDR values calculated using Equation 3.1.
eFIFO: adapting to changing burdens
More recently, the economic Fish In:Fish Out (eFIFO) has been proposed as an improvement to both the FIFO and FFDR approaches (Kok et al. Citation2020). In the eFIFO an economic allocation (weighting) has been applied to the relative values of the fishmeal and fish oil produced. In the standard FIFO calculation (e.g., EquationEquation 2.3(2.1)
(2.1) ), the weighting is biased according to the yield (or embodiment) for each marine ingredient on a mass basis. As such it is arguably easier to reduce the FIFO value by reducing the fishmeal inclusion rather than the fish oil inclusion in the diet. This same issue is why some have implicated the higher dependency issues associated with fish oil for sectors like the salmonid farming sector. One way to manage this bias is to attach an economic weighting to the embodiment value. The economic allocation approach proposed serves well for two reasons, one being that the whole process of ingredient use is an economic exercise. Second, that the economic aspect also aligns somewhat with the nutritional value of the various commodities, with most ingredients trading on a protein + fat (profat) basis, and oils also trading on an omega-3 index basis (Glencross et al. Citation2020; Malcorps et al. Citation2021). The economic allocation approach is also consistent with the agreed standards used in feed sustainability assessment proposed by the European Union in their Product Environmental Footprint Categorization Rules (PEFCR) and more recently those also of the Global Feed Life Cyle-Assessment Institute (GFLI) [https://globalfeedlca.org/]. Economic allocation also places greater importance on the more limiting ingredients and their relative demand. In the case of eFIFO it can be observed that with the changing balance in values between fishmeal and fish oil over time, it is possible to be able to able better represent that sustainability burden.
When considering the eFIFO equation (EquationEquation 4a(4a)
(4a) ) it can be seen that it builds on from the original Jackson (Citation2009) equation discussed earlier (EquationEquation 2.3
(2.1)
(2.1) ). Where it varies from that equation though is in how it defines the embodiment value of the “fish-in” component (EquationEquation 4b
(4b)
(4b) ):
(4a)
(4a)
Where %FM inclusion = the proportion of the diet as fishmeal, %FO inclusion = the proportion of the diet as fish oil, Pm = the economic embodiment of fishmeal and Po = the economic embodiment of fish oil. The economic embodiment value is derived using the proportional value of the different co-products.
(4b)
(4b)
Where EVm = the economic value of fishmeal, EVo = the economic value of fish oil, FmY = the mass embodiment of fishmeal (usually 22.5%) and FoY = the mass embodiment of fish oil (usually 5%). The other required economic embodiment value, Po is calculated by switching the numerator to be the EVo. An additional function (not shown) can be added into this embodiment component of the calculation to capture the economic contribution of by-products relative to the economic contribution of the direct human consumption (DHC) component of the fish. In the study by Kok et al. (Citation2020), it was largely assumed that the by-product fractions have zero value and subsequently cancel out that contribution. Over time, as increasing value is attributed to by-products the contribution to eFIFO will also increase, but it is still unlikely to ever match the value of the DHC component.
Like that seen with each of the metrics examined in this study, there have been notable improvements in the estimated eFIFO values for various sectors between 2000 and 2020 (). In 2020, the values for each of the different species’ groups are below 1.5, with most below 1.0. Overall, global eFIFO values across all fed aquaculture show that only 0.27 kg of forage fish is used for each kilogram of fed aquaculture production, meaning that there is effectively a 4x multiplier effect of the use of marine ingredients in the aquaculture value chain (Kok et al. Citation2020). Major improvements in eFIFO values for sectors like the much-criticised Atlantic salmon and shrimp farming sectors are noted, although the change from extensive to intensive farming of shrimp in recent years has slightly increased the eFIFO score in 2020. Even bigger changes were noted for some of the other sectors like that of Cyprinids (carps) which had a nine-fold reduction in their eFIFO and tilapias a six-fold reduction ().
Table 6. Sector wide and species-specific eFIFO values calculated using Equations 4a and 4b.
As with the other metrics the nature of the eFIFO calculation leverages off improvements in both the eFCR values and the marine ingredient inclusion values, but in this metric the changing economic values over time with the growth in the value of fish oil has some impact in redistributing the embodiment burden. As far as single-value metrics go, the eFIFO is clearly the most developed and practical as well as more relevant to use of global resources. Importantly, it does not segregate the meal and oil fractions into separate metrics, but rather consolidates them both into a single value based on their economic weighting, which better aligns with a systems thinking approach.
Moving beyond simplistic metrics
The next steps in the pathway to improved sustainability of the marine ingredients sector are becoming increasingly clear. It is not through the use of metrics like FIFO, FFDR or eFIFO, even though they are arguably all improvements on their predecessor. None of the previously mentioned metrics though addresses the issues of the alternative ingredients used to replace fishmeal or fish oil nor, do they take into account differences in the management of fisheries, recognizing that a well-managed fishery provides an important resource for global human nutrition. Robust sustainability assessment is one that allows a clear and objective comparison among all the various feed ingredient options available, so that in the event that a choice needs to be made, that the best outcome can be achieved. To achieve this a system that allows direct comparisons of different resources based on specific sustainability impact categories needs to be adopted and embraced across the sector. The obvious choice for a system to be applied in such an instance is that of life cycle assessment (LCA) analysis (De Vries and De Boer Citation2010; Fréon et al. Citation2014; Notarnicola et al. Citation2017; Silva et al. Citation2018).
Life cycle assessment aims to compare a range of environmental effects assignable to products and services by quantifying all the inputs and outputs associated with various material and energy flows and assessing how these flows impact the environment (Tukker Citation2000; Notarnicola et al. Citation2017). Impacts can occur throughout the value-chain from such products and/or services, including from raw material extraction (capture), to processing, distribution, consumption and of course at the point of waste disposal (or recycling). Each of these stages requires land, water, raw materials, and energy, and each can contribute to emissions of some kind or other. There are various phases to undertaking such an assessment, but foundational is a mapping exercise whereby the establishment of the system boundaries in which the LCA analysis are considered (Ott et al. Citation2023). From there, the LCA process progresses by the compilation of a life cycle inventory (LCI) of the relevant energy and material inputs and environmental releases that occur within that system boundary. There can be various “stages” to a system and “gates” through which flows occur. An LCA is considered to capture all the relevant stages and gates when it examines the “cradle-to-grave” life cycle associated with a product or service (Tukker Citation2000). The establishment of the LCI then allows an evaluation of the potential environmental impacts associated with each of the identified inputs and releases, and in the process allows the identification of “hotspots”, or points in the lifecycle where parameters are most sensitive to impacts.
As part of the LCA process, the characterization of the emissions is included; whereby different emissions are standardized into what are referred to as equivalents (De Schryver et al. Citation2009). For example, in terms of global warming potential (GWP), which is measured in carbon dioxide (CO2) equivalents, one unit of CO2 = 1 equivalent, whereas methane (CH4) has 28x the CO2 equivalent in terms of GWP. Another of the important considerations of LCA is the observation that impacts do not just occur on the unit of production, but all the constituent inputs in the value-chain to a certain point. Another aspect to the LCA story, is that it is not constrained to just carbon footprint but commonly includes up to 18 different environmental impacts now being assessable (), with more being developed that cover socio-economic as well as environmental impacts.
Table 7. Impact categories associated with the LCA ReCiPe Midpoint Criteria.
It is notable though that the process of undertaking an LCA analysis requires lots of planning and data. How you plan and how you collect the data can have important effects on the interpretation though. Because of these constraints, there have been various attempts to set some standards on this; the International Standardization Organization (ISO) initiated the development of some standards (ISO 14040 series), the European Union have also established their Product Environmental Footprint Categorization Rules (PEFCR) approach and more recently the Global Feed Life Cyle-Assessment Institute (GFLI) was established to be an independent repository with an available database and tools. The GFLI [https://globalfeedlca.org/] is an independent animal nutrition and food industry institute with the purpose of developing a publicly available feed ingredient LCA database to support meaningful environmental assessment of animal nutrition products and to stimulate continuous improvement of the environmental performance in the animal nutrition, animal production and food industry. As such it provides a centralized resource for standardizing LCA datasets and therefore sustainability claims in the feed sector.
As part of the LCA process, the partitioning of impacts between co-products (e.g., meal and oil), needs to be considered when the flow of a material or energy gets split along its life cycle. There are several ways of achieving this, including “system expansion” as a favored by practitioners of “consequential” LCA, but more common is a system of “allocation” as used in “attributional” LCA, which is the focus on this review. There are principally three ways in which allocation is applied across the co-products; by the proportion of mass, energy, or economic values (Ayer et al. Citation2007; Cherubini et al. Citation2011; Svanes et al. Citation2011). There have been arguments made for which allocation method makes the most sense across different sectors. While use of mass allocation is the most straight forward, the use of energy allocation has been equated to address the nutritional value of the product. For the feed sector though, the position is currently prioritizing an economic allocation, with such allocation methods recommended by PEFCR-Feed and GFLI methodologies (European Commission Citation2018). The idea being that the allocation process should incentivise the most valuable approach to full product utilization. As such when the primary catch/production of fish for human consumption occurs, it means that most of the economic allocation is taken by the food portion, even though that fraction often represents less than 50% of the raw material by volume (Stevens et al. Citation2018). This means that the lower-value by-products get attributed a lower proportion of the environmental footprint associated with the capture of the raw material (Newton et al. Citation2014; Regueiro et al. 2022). Generally, this approach incentivises Circular Economy approaches to waste up-cycling as a key goal of the EU Green deal, as feed formulators would source upcycled materials with low footprints compared to virgin material. Processors are also incentivized to improve the utilization of by-products as increasing their proportionate value results in a lower impact being attributed to their main products. There are further advantages over methods employed in early FIFO calculations (where by-products were attributed no Fish-In value) in that by-products from highly impacting fisheries may still result in relatively high footprints compared to some virgin materials. Overall, this will support returning nutrients that would have been lost in co-products or waste back into the human nutrition value chain. Disadvantages occur because of price volatility that can skew temporal changes in impacts, which must be addressed by applying long-term price averages.
One of the merits of LCA analysis is that it allows for the assessment of a diverse range of impact categories, and as such it demonstrates vastly greater utility than single point metrics. Critically, neither the FFDR nor FIFO metrics align with LCA as a more robust measure of broader environmental impacts. There is a case for FIFO potentially becoming an additional impact category and the recent improvements to that metric in the form of the eFIFO are a step in the right direction (Kok et al. Citation2020). Arguably the existence of biotic resource use (BRU) as an existing impact category among standard LCA impact categories already, somewhat covers the same thing and importantly allows for its extension across resources other than just those obtained from fisheries (Cashion et al. Citation2016).
Through the use of the LCA system as a more widely applicable sustainability tool, it can be seen that all ingredients have sustainability impacts of biodiversity loss, carbon-emissions, and resource use (e.g., biological, or energy.). Indeed, a comparison of soybean agriculture and anchoveta fishmeal production further provides some excellent case studies here in this regard. Soybean production around the world is dominated by six producers (USA, Brazil, China, India, Argentina, and Paraguay), each producing over 10 million tonnes each year (Da Silva et al. Citation2021). The majority of these countries are low-middle-income-countries (LMICs) and as such primary production forms a crucial foundation to their developing economies. This often conflicts with environmental sustainability considerations as the growth of those primary industries increasingly conflicts with natural resource management (Da Silva et al. Citation2021). Widespread deforestation, leading to broadscale biodiversity depletion and massive amounts of carbon-release each year, are associated with soybean industry growth (Jia et al. Citation2020; Da Silva et al. Citation2021). The production of the crops themselves each year produces enormous amounts of soil loss and carbon emissions from the fuel used. Beyond these, the widespread use of insecticides and herbicides further contributes a host of other ecological threats (Jia et al. Citation2020). While the issue of deforestation might presently be limited to some LMIC countries and even regions within them, it must be acknowledged that this issue is one of temporal dissonance, with all those other regions of agricultural activity simply having done the same at some earlier time. Arguably no agricultural cropping system anywhere can be insulated from issues of land clearing and biodiversity loss.
Production of marine ingredients from anchoveta (Engraulis ringens) has some similarity to the soybean story in that as a primary production industry it forms a crucial foundation to other LMIC economies, however it does also present some contrasts. It has been reported that this fishery, which contributes 15% of the global biomass of fish caught, results in just 3% of the global fishery related carbon-emissions, which come mostly from the catching and refrigeration of the fish (Cashion et al. Citation2017; Parker et al. Citation2018). While its carbon-footprint is remarkably low, and no pesticides or herbicides are used, it does have an enormous impact on biotic resource use (Fréon et al. Citation2017). Despite the harvest of close to 5 million tonnes of fish each year, the broader impacts on biodiversity are comparatively tiny compared to most forms of agriculture or even other forms of fishing, like trawling due to the use of purse seine fishing methods which produce a high biomass yield and low fuel use (Avadi and Fréon 2013). Even the broader ecosystem trophic impacts have been suggested to be nominal (Free et al. Citation2021).
Completing the story
Throughout this review a range of sustainability metrics have been discussed that have been proposed over time to calculate the various efficiencies (and inefficiencies) of the utilization of the marine ingredient content of feeds. Like all metrics though, they come with some assumptions and are only as good as the reliability of the data underpinning them. It is noted that the range of metrics commonly used to assess the use of marine ingredients, including FIFO, FFDR, and eFIFO are not consistently applied across other feed ingredients and as such this limits their utility in progressing a constructive assessment on broader feed ingredient sustainability. An alternative and more robust strategy is proposed to assess the sustainability of marine ingredients based on LCA. Although LCA has been around for several decades now, its role in the sustainability story is clearly growing as one of importance on the pathway to improved sustainability for all feed ingredients. As a way of improving our decision making it presents as a system that allows clear comparisons of different resources based on specific sustainability impact categories, something that adds considerable sense and needs to be more broadly adopted and embraced across the feed ingredient sector. By moving to a widely applicable system, with a more transparent assessment framework, it is believed that this will better support the aquaculture feed sector in being able to move forward to assess the sustainability of the use of all feed resources on an equivalent basis and how it contributes into farmed seafood and ultimately human nutrition. As noted the recent review (Glencross et al. Citation2024), all ingredients have shortcomings in one area or more, but progress can only be made by comparing all options through a system based on shared metrics.
Disclosure statement
BG has both a university affiliation and a commercial affiliation with a member-based organization representing the international marine ingredient sector. EB has a commercial affiliation with a member-based organization representing the international marine ingredient sector. DR has a commercial affiliation with a feed company. All other authors have solely a university affiliation and no declared interests.
References
- Aas TS, Ytrestøyl T, Åsgård T. 2019. Utilization of feed resources in the production of Atlantic salmon (Salmo salar) in Norway: an update for 2016. Aquacult Rep. 15:100216. doi: 10.1016/j.aqrep.2019.100216.
- Aas TS, Åsgård T, Ytrestøyl T. 2022. Utilization of feed resources in the production of Atlantic salmon (Salmo salar) in Norway: an update for 2020. Aquacult Rep. 26:101316. doi: 10.1016/j.aqrep.2022.101316.
- Avadí A, Fréon P. 2013. Life cycle assessment of fisheries: a review for fisheries scientists and managers. Fish Res. 143:21–38. doi: 10.1016/j.fishres.2013.01.006.
- Ayer NW, Tyedmers PH, Pelletier NL, Sonesson U, Scholz A. 2007. Co-product allocation in life cycle assessments of seafood production systems: review of problems and strategies. Int J Life Cycle Assess. 12(7):480–487. doi: 10.1065/lca2006.11.284.
- Boyd CE, D'Abramo LR, Glencross BD, Huyben DC, Juarez LM, Lockwood GS, McNevin AA, Tacon AGJ, Teletchea F, Tomasso JR, Jr, et al. 2020. Achieving sustainable aquaculture: historical and current perspectives and future needs and challenges. J World Aquaculture Soc. 51(3):578–633. doi: 10.1111/jwas.12714.
- Calder PC. 2001. Polyunsaturated fatty acids, inflammation, and immunity. Lipids. 36(9):1007–1024. doi: 10.1007/s11745-001-0812-7.
- Calder PC. 2015. Marine omega-3 fatty acids and inflammatory processes: effects, mechanisms and clinical relevance. Biochim Biophys Acta. 1851(4):469–484. doi: 10.1016/j.bbalip.2014.08.010.
- Cashion T, Hornborg S, Ziegler F, Hognes ES, Tyedmers P. 2016. Review and advancement of the marine biotic resource use metric in seafood LCAs: a case study of Norwegian salmon feed. Int J Life Cycle Assess. 21(8):1106–1120. doi: 10.1007/s11367-016-1092-y.
- Cashion T, Tyedmers P, Parker RW. 2017. Global reduction fisheries and their products in the context of sustainable limits. Fish Fish. 18(6):1026–1037. doi: 10.1111/faf.12222.
- Cherubini F, Strømman AH, Ulgiati S. 2011. Influence of allocation methods on the environmental performance of biorefinery products—a case study. Resour Conserv Recycl. 55(11):1070–1077. doi: 10.1016/j.resconrec.2011.06.001.
- Da Silva RFB, Viña A, Moran EF, Dou Y, Batistella M, Liu J. 2021. Socioeconomic and environmental effects of soybean production in metacoupled systems. Sci Rep. 11(1):18662. doi: 10.1038/s41598-021-98256-6.
- De Schryver AM, Brakkee KW, Goedkoop MJ, Huijbregts MAJ. 2009. Characterization factors for global warming in life cycle assessment based on damages to humans and ecosystems. Environ Sci Technol. 43(6):1689–1695. doi: 10.1021/es800456m.
- De Vries M, de Boer IJ. 2010. Comparing environmental impacts for livestock products: a review of life cycle assessments. Livest Sci. 128(1–3):1–11. doi: 10.1016/j.livsci.2009.11.007.
- European Commission. 2018. PEFCR feed for food producing animals. [accessed 2023 Apr 12]. https://ec.europa.eu/environment/eussd/smgp/pdf/PEFCR_feed.pdf.
- Ferreira I, Gomes-Bispo A, Lourenço H, Matos J, Afonso C, Cardoso C, Castanheira I, Motta C, Prates JAM, Bandarra NM. 2020. The chemical composition and lipid profile of the chub mackerel (Scomber colias) show a strong seasonal dependence: contribution to a nutritional evaluation. Biochimie. 178:181–189. doi: 10.1016/j.biochi.2020.09.022.
- Food and Agricultural Organisation (FAO). 2022. State of the world’s fisheries and aquaculture. Rome: (SOFIA) Food and Agricultural Organisation; p. 266.
- Free CM, Jensen OP, Hilborn R. 2021. Evaluating impacts of forage fish abundance on marine predators. Conserv Biol. 35(5):1540–1551. doi: 10.1111/cobi.13709.
- Fréon P, Sueiro JC, Iriarte F, Miro Evar OF, Landa Y, Mittaine JF, Bouchon M. 2014. Harvesting for food versus feed: a review of Peruvian fisheries in a global context. Rev Fish Biol Fish. 24(1):381–398. doi: 10.1007/s11160-013-9336-4.
- Fréon P, Durand H, Avadí A, Huaranca S, Moreyra RO. 2017. Life cycle assessment of three Peruvian fishmeal plants: toward a cleaner production. J Cleaner Prod. 145:50–63. doi: 10.1016/j.jclepro.2017.01.036.
- Fry JP, Mailloux NA, Love DC, Milli MC, Cao L. 2018. Feed conversion efficiency in aquaculture: do we measure it correctly? Environ Res Lett. 13(2):024017. doi: 10.1088/1748-9326/aaa273.
- Galdos MEA, Albrecht-Ruiz M, Maldonado AS, Minga JP. 2002. Fat content of Peruvian anchovy (Engraulis ringens), after “El Niño” phenomenon (1998—1999). J Food Compos Anal. 15(6):627–631. doi: 10.1006/jfca.2002.1059.
- Glencross BD. 2009. Exploring the nutritional demand for essential fatty acids by aquaculture species. Rev Aquacult. 1(2):71–124. doi: 10.1111/j.1753-5131.2009.01006.x.
- Glencross BD. 2020. A feed is still only as good as its ingredients: an update on the nutritional research strategies for the optimal evaluation of ingredients for aquaculture feeds. Aquacult Nutr. 26(6):1871–1883. doi: 10.1111/anu.13138.
- Glencross BD, Baily J, Berntssen MH, Hardy R, MacKenzie S, Tocher DR. 2020. Risk assessment of the use of alternative animal and plant raw material resources in aquaculture feeds. Rev Aquacult. 12(2):703–758. doi: 10.1111/raq.12347.
- Glencross B, Fracalossi DM, Hua K, Izquierdo M, Mai K, Øverland M, Robb D, Roubach R, Schrama J, Small B, et al. 2023. Harvesting the benefits of nutritional research to address global challenges in the 21st century. J World Aquacult Soc. 54(2):343–363. doi: 10.1111/jwas.12948.
- Glencross B, Ling X, Gatlin D, Kaushik S, Øverland M, Newton R, Valente LM. 2024. A SWOT analysis of the use of marine, grain, terrestrial-animal and novel protein ingredients in aquaculture feeds. Rev Fish Sci Aquacult. :1–39. doi: 10.1080/23308249.2024.2315049.
- Hardy RW, Kaushik SJ, Mai K, Bai SC. 2022. Fish nutrition—history and perspectives. In: Fish nutrition. Cambridge (MA): Academic Press. p. 1–16.
- Hilborn R, Amoroso RO, Anderson CM, Baum JK, Branch TA, Costello C, de Moor CL, Faraj A, Hively D, Jensen OP, et al. 2020. Effective fisheries management instrumental in improving fish stock status. Proc Natl Acad Sci U S A. 117(4):2218–2224. doi: 10.1073/pnas.1909726116.
- Hilborn R, Buratti CC, Díaz Acuña E, Hively D, Kolding J, Kurota H, Baker N, Mace PM, de Moor CL, Muko S, et al. 2022. Recent trends in abundance and fishing pressure of agency-assessed small pelagic fish stocks. Fish Fish. 23(6):1313–1331. doi: 10.1111/faf.12690.
- IFFO. 2024. [accessed 2024 Mar 25]. https://www.iffo.com/key-facts.
- Jackson A. 2009. Fish in–fish out ratios explained. Aquac Eur. 34(3):5–10.
- Jia F, Peng S, Green J, Koh L, Chen X. 2020. Soybean supply chain management and sustainability: a systematic literature review. J Cleaner Prod. 255:120254. doi: 10.1016/j.jclepro.2020.120254.
- Kaushik SJ, Troell M. 2010. Taking the fish-in fish-out ratio a step further. Aquaculture. 35(1):15–17.
- Kok B, Malcorps W, Tlusty MF, Eltholth MM, Auchterlonie NA, Little DC, Harmsen R, Newton RW, Davies SJ. 2020. Fish as feed: using economic allocation to quantify the fish in: fish out ratio of major fed aquaculture species. Aquaculture. 528:735474. doi: 10.1016/j.aquaculture.2020.735474.
- Konar M, Qiu S, Tougher B, Vause J, Tlusty M, Fitzsimmons K, Barrows R, Cao L. 2019. Illustrating the hidden economic, social and ecological values of global forage fish resources. Resour Conserv Recycl. 151:104456. doi: 10.1016/j.resconrec.2019.104456.
- Malcorps W, Newton RW, Sprague M, Glencross BD, Little DC. 2021. Nutritional characterisation of european aquaculture processing by-products to facilitate strategic utilisation. Front Sustain Food Syst. 5:378. doi: 10.3389/fsufs.2021.720595.
- Naylor RL, Goldburg RJ, Primavera JH, Kautsky N, Beveridge MC, Clay J, Folke C, Lubchenco J, Mooney H, Troell M. 2000. Effect of aquaculture on world fish supplies. Nature. 405(6790):1017–1024. doi: 10.1038/35016500.
- Naylor RL, Hardy RW, Bureau DP, Chiu A, Elliott M, Farrell AP, Forster I, Gatlin DM, Goldburg RJ, Hua K, et al. 2009. Feeding aquaculture in an era of finite resources. Proc Natl Acad Sci U S A. 106(36):15103–15110. doi: 10.1073/pnas.0905235106.
- Naylor RL, Hardy RW, Buschmann AH, Bush SR, Cao L, Klinger DH, Little DC, Lubchenco J, Shumway SE, Troell M. 2021. A 20-year retrospective review of global aquaculture. Nature 591(7851):551–563. doi: 10.1038/s41586-021-03308-6.
- Newton R, Telfer T, Little D. 2014. Perspectives on the utilization of aquaculture coproduct in Europe and Asia: prospects for value addition and improved resource efficiency. Crit Rev Food Sci Nutr. 54(4):495–510. doi: 10.1080/10408398.2011.588349.
- Notarnicola B, Sala S, Anton A, McLaren SJ, Saouter E, Sonesson U. 2017. The role of life cycle assessment in supporting sustainable agri-food systems: a review of the challenges. J Cleaner Prod. 140:399–409. doi: 10.1016/j.jclepro.2016.06.071.
- Ott D, Goyal S, Reuss R, Gutzeit HO, Liebscher J, Dautz J, Degieter M, De Steur H, Zannini E. 2023. LCA as decision support tool in the food and feed sector: evidence from R&D case studies. Environ Syst Decis. 43(1):129–141. doi: 10.1007/s10669-022-09874-y.
- Parker RW, Blanchard JL, Gardner C, Green BS, Hartmann K, Tyedmers PH, Watson RA. 2018. Fuel use and greenhouse gas emissions of world fisheries. Nature Clim Change. 8(4):333–337. doi: 10.1038/s41558-018-0117-x.
- Pikitch EK, Rountos KJ, Essington TE, Santora C, Pauly D, Watson R, Sumaila UR, Boersma PD, Boyd IL, Conover DO, et al. 2014. The global contribution of forage fish to marine fisheries and ecosystems. Fish Fish. 15(1):43–64. doi: 10.1111/faf.12004.
- Regueiro L, Newton R, Soula M, Méndez D, Kok B, Little DC, Pastres R, Johansen J, Ferreira M. 2022. Opportunities and limitations for the introduction of circular economy principles in EU aquaculture based on the regulatory framework. J Ind Ecol. 26(6):2033–2044. doi: 10.1111/jiec.13188.
- Romotowska PE, Karlsdóttir MG, Gudjónsdóttir M, Kristinsson HG, Arason S. 2016. Seasonal and geographical variation in chemical composition and lipid stability of Atlantic mackerel (Scomber scombrus) caught in Icelandic waters. J Food Compos Anal. 49:9–18. doi: 10.1016/j.jfca.2016.03.005.
- Shepherd CJ, Jackson AJ. 2013. Global fishmeal and fish-oil supply: inputs, outputs and markets. J Fish Biol. 83(4):1046–1066. doi: 10.1111/jfb.12224.
- Silva CB, Valente LM, Matos E, Brandão M, Neto B. 2018. Life cycle assessment of aquafeed ingredients. Int J Life Cycle Assess. 23(5):995–1017. doi: 10.1007/s11367-017-1414-8.
- Stevens JR, Newton RW, Tlusty M, Little DC. 2018. The rise of aquaculture by-products: Increasing food production, value, and sustainability through strategic utilisation. Mar Pol. 90:115–124. doi: 10.1016/j.marpol.2017.12.027.
- Svanes E, Vold M, Hanssen OJ. 2011. Effect of different allocation methods on LCA results of products from wild-caught fish and on the use of such results. Int J Life Cycle Assess. 16(6):512–521. doi: 10.1007/s11367-011-0288-4.
- Tacon AGJ. 2004. Use of fish meal and fish oil in aquaculture: a global perspective. Aquatic Resour Cult Dev. 1(1):3–14.
- Tacon AGJ, Metian M. 2008. Global overview on the use of fish meal and fish oil in industrially compounded aquafeeds: trends and future prospects. Aquaculture 285(1–4):146–158. doi: 10.1016/j.aquaculture.2008.08.015.
- Tacon AGJ, Metian M. 2009. Fishing for aquaculture: non-food use of small pelagic forage fish—a global perspective. Rev Fish Sci. 17(3):305–317. doi: 10.1080/10641260802677074.
- Tacon AGJ, Metian M. 2015. Feed matters: satisfying the feed demand of aquaculture. Rev Fish Sci Aquacult. 23(1):1–10. doi: 10.1080/23308249.2014.987209.
- Tacon AG, Metian M, McNevin AA. 2022. Future feeds: suggested guidelines for sustainable development. Rev Fish Sci Aquacult. 30(2):135–142. doi: 10.1080/23308249.2020.1860474.
- Tukker A. 2000. Life cycle assessment as a tool in environmental impact assessment. Environ Impact Assess Rev. 20(4):435–456. doi: 10.1016/S0195-9255(99)00045-1.
- Ytrestøyl T, Aas TS, Åsgård T. 2015. Utilisation of feed resources in production of Atlantic salmon (Salmo salar) in Norway. Aquaculture 448:365–374. doi: 10.1016/j.aquaculture.2015.06.023.
- Zhang W, Liu M, Sadovy de Mitcheson Y, Cao L, Leadbitter D, Newton R, Little DC, Li S, Yang Y, Chen X, et al. 2020. Fishing for feed in China: facts, impacts and implications. Fish and Fisheries.21(1):47–62. doi: 10.1111/faf.12414.
