
 ?Mathematical formulae have been encoded as MathML and are displayed in this HTML version using MathJax in order to improve their display. Uncheck the box to turn MathJax off. This feature requires Javascript. Click on a formula to zoom.
Abstract
The limitation posed by the traditional comparison of water quality indicators with guide values or acceptable limits has necessitated the use of water quality indices. Most water quality indices depend on use of weighting factors which have the problem of subjectiveness. These limitations have been overcome by the Canadian Council of Ministers of the Environment (CCME) framework which estimates scope, frequency and amplitude of impairment to water quality status. The framework was used to create 3 Water Quality Indices (WQI) for Agricultural, Health and Environmental evaluation of water quality in the Ogun and Ona Basins which cover 8 rivers, with 27 gauging locations. 32 physical, chemical and microbiological water quality indicators were monitored over a 12-month period. The CCME scores showed that Health WQI ranged between 21 and 42 which rank all the rivers and locations as poor. Environmental WQI was 41–76 which ranks the basins between marginal and fair, while the Agricultural WQI was between 31 and 59; thus making river water quality poor and unfit for aquaculture even though, adequate for irrigation with the acceptable EC (<2.0 dS/m) and low SAR (<1.0). The WQI patterns across the basins were mapped with GIS which reveal specific communities and areas with high pollution levels. The water quality status poses a negative impact on sustainable utilization of river water unless efforts are made to control negative anthropogenic activities in the basins.
Public Interest Statement
Water quality evaluation is critical to sustainable utilization and general management of surface and groundwater resources. Often, less emphasis is placed on the quality of river water beyond the immediate point where the water is being used. Often, when surveys are conducted, results are presented in such a way that is complex to see the pattern across a basin or to identify areas with major issues. The use of CCME framework and GIS enable the understanding of the pattern of water quality at the basin level in terms of space and level of impairment. In the investigated Ogun and Ona Basins, Nigeria, the water quality of studied rivers varies with respect to meeting health, environmental or ecosystem and agricultural, water requirement. The status of water in these basins calls for urgent environmental pollution control most especially, the use of fertilizers and dumping of industrial, domestic and agricultural wastes.
1. Introduction
The limitation of the traditional way of assessing water quality by comparing measured parameters with existing guidelines (or limits) has been acknowledged (Hülya, Citation2006). The methodology is not inclusive of spatial and temporal status of the catchment or a watershed even though specific locations could be assessed. It has been suggested by House (Citation1990) that the use of a Water Quality Index (WQI) can bridge the gap between these two extremes of water quality data acquisition analysis and reporting methods. This has been identified earlier by the Scottish Development Department where they defined a WQI as a form of average derived by relating a group of variables to a common scale and combining them into a single number. The group should contain the most significant parameters of the data-set, so that the index can describe the overall position and reflect changes in a representative manner (Scottish Development Department [SDD], Citation1976).
In his work, House (Citation1989), identified nine physico-chemical and microbiological determinants and related them to a general water quality index. However, the weighting factor in the water quality development is a function of the determinants considered to be most indicative of changes in water quality and relates to possible water use usually in accordance with the use-specific water quality standards and criteria that are available (House, Citation1990).
Most water quality indices rely on normalizing or standardizing data parameter by parameter according to expected concentrations and some interpretation of “good” versus “bad” concentrations. Parameters are then weighted according to their perceived importance to overall water quality and the index is calculated as the weighted average of all observations of interest. The major limitation to this approach is the subjectiveness of the assigned weight which is dependent on the judgements of the investigator (Liou, Lo, & Wang, Citation2004; Sargaonkar & Deshpande, Citation2003). Currently, there is no single nationally acceptable index for water quality assessment in Nigeria and this has allowed development of different approaches for evaluation of water quality. The prominent methodology remains the simple comparison of observed parameters with standards set by international or national regulators. By this approach, Jaji, Bamgbose, Odukoya, and Arowolo (Citation2007) have declared Ogun River to be highly polluted and possesses high risk to the health of several communities that depends on it for their water supply. Also, Olanike and Olutayo (Citation2008) and Fasunwo, Olowofela, Akinyemi, Fasunwo, and Akintokun (Citation2008) using the same approach confirmed this pollution status in their work on water quality of rivers in Ibadan and Ago-Iwoye which are among the major cities within the Ogun and Ona basins. To further and better understand the state of water pollution within the Ogun and Ona basins, this work used the Canadian Council of Minister of Environment (CCME) framework in the assessment of river water quality within Ogun and Ona Basins, in Nigeria.
1.1. Canadian council of ministers of environment framework: A review
The Canadian Council of Ministers of Environment (CCME) WQI provides a mathematical framework for assessing ambient water quality conditions relative to water quality objectives without depending on the judgement of researchers to assign the value weight. It is flexible with respect to the type and number of water quality variables to be tested, the period of application and the type of water body (stream, river reach, lake, etc.) tested. The decisions on these factors, and the extent and type of water body are left to the user (Canadian Council of Ministers of the Environment [CCME], Citation2001). However, the strength of CCME framework is that each parameter’s exceedance of a guide value is computed mathematically to obtain the final quality score. The body of water to which the index will be applied can be defined by one station for example or a monitoring site on a particular river reach or by a number of different stations throughout a lake. The more stations that are combined, the more general the conclusions will be. The period chosen will depend on the amount of data available and the reporting requirements of the user. A minimum period of one year is often used as data are usually required and collected to reflect this period (CCME, Citation2001).
The CCME framework was adopted in the global evaluation of surface water systems (Global Environmental Monitoring Systems [GEMS], Citation2007). It was noted that the index allows for measurements of the frequency and extent to which parameters exceed their respective guidelines at each monitoring station in arriving at a decision on the quality status which is a major advantage over other subjective index frameworks. The index is flexible enough to accept global, regional or national guidelines based on specific objectives (Ashok, Halliwel, & Tribeni, Citation2006).
The index is determined on an annual basis resulting in an overall rating for each station per year. Marta, Borrell, de Campos, Damia, and Roma (Citation2010) has also used the CCME WQI in the context of the European Union Water Framework Directive to simulate data-sets describing three different environmental conditions corresponding to episodes of discharge of urban wastewater, eutrophication and risk to fish. In like manner, de Simone, Dennis, and Monique (Citation2009) also used the CCME WQI in comparative-analysis of exposure sites to reference sites downstream of point source discharges across Canada. It is in the light of some of the highlighted advantages that the CCME was used in assessment of river water quality for the purposes of agriculture, public health and environmental quality requirements in Ogun and Ona Basins.
2. Materials and methods
2.1. Study location
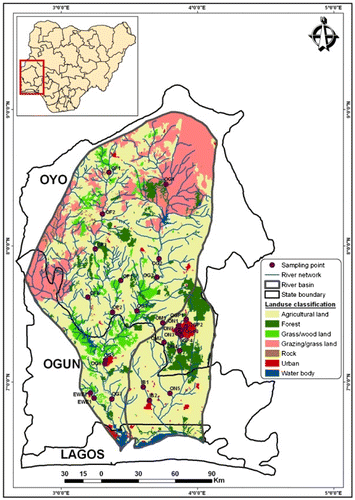
This study was conducted on eight major rivers in Ogun (23,047 km2) and Ona (6,407 km2) river basins which are major sub-basins in the geographical area delineated as Ogun Osun River Basin, in South Western Nigeria (Figure ). Twenty-seven (27) locations which correspond to established gauging stations across the two basins were chosen as sampling points, although, none of the points was being used actively as a gauging site as the time of this survey. Figure shows the number of locations investigated on each of the rivers: Ogun (OG1–OG6), Ofiki (OF1–OF4), Ona (ON1–ON5), Ogunpa (OGP 1–OGP4), Opeki (OP1–OP2), Ewekoro (EW1–EW2), Ibu (IB1 –IB2), and Omi (OM1–OM2). The rivers are perennial even though they vary greatly in discharge and capacity. Although, reliable estimates of river discharge in the basins are a major challenge, however, in terms of cross section (width and depth) and river length, the order of size of the rivers is from Ogun, Ofiki, Ona, Ogunpa, Opeki, Ibu, Ewekoro to Omi. The land use characteristics of the basins are shown in Figure .
Figure 1. Study location in Ogun and Ona Basins.
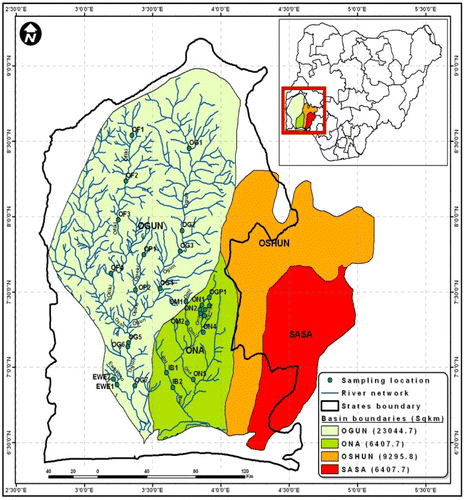
Figure 2. Land Use map of Ogun and Ona Basins.
2.2. Sampling methodology
Water samples were collected on a monthly basis over a period of 12 months using grab sampling technique following procedure in Franceska (Citation2005) and Gary, Sims, and Vance (Citation2006). On each sampling day, three grab water samples were taken across the river at and below the surface (0–25 cm) to make a composite. Physical, chemical and microbiological water quality indicators were analysed for in the samples. These include: temperature, electrical conductivity (EC), pH, dissolved oxygen (DO), 5 day Biochemical Oxygen Demand (BOD5), Chemical Oxygen Demand (COD), total acidity, turbidity, Total Suspended Solid (TSS), ammonium–nitrogen, nitrate-nitrogen, nitrite-nitrogen, Total Nitrogen (TN), Total Phosphorous (TP), phosphate, iron, cadmium, zinc, mercury, copper, manganese, lead, chromium, Total Viable Bacteria Count (TVC), Escherichia coliform (E. coli) and faecal coliform.
The composite samples were collected in high-density polyethylene (HDPE) plastic bottles. Prior to sampling, the sample bottles had been washed with HNO3 (American Public Health Association [APHA], Citation1992). Each bottle was thoroughly rinsed with the sampled water before sample collection and then the bottle was sealed. The samples were then refrigerated in a mobile cooler with ice packs maintained at <4°C and immediately transported to the laboratory for analysis within 48 h. This eliminated the need for storage treatment or acidification procedure for sample preservation (APHA, Citation1992; Meybech, Kimstach, & Helmer, Citation1996). Water samples for microbiological analysis were kept in glass bottle (250 ml) and were preserved in a separate mobile cooler. However, temperature, pH and DO were analysed on site using a HANNA, HI9829 multimeter.
2.3. Statistics
The mean values over the 12 months of sampling were compared with the guide value (maximum allowable level) of the water quality indicators for river water based on requirements for domestic uses (WHO, Citation2011). The Student t-test (Helsel & Hirsch, Citation2002) was used in the comparison of mean values and established the level of significance (p < 0.05) in the differences across the rivers.
2.4. Laboratory analytical techniques
The laboratory analysis followed the Standard Methods for Water and Wastewater Analysis (APHA, Citation1992). Analyses were done at the Central Analytical Laboratory of the Institute of Agricultural Research and Training (I.A.R. & T.), Ibadan. Sample analysis was done in three replicates and simple average was taken as observation for a sample.
2.5. Water quality index
The critical water quality indicators were used in the development of WQI which was based on the Canadian Council of Ministers of the Environment Framework (CCME, Citation2001; GEMS, Citation2007) The WQI is based on a combination of three factors:
| (1) | Scope, F1 - the number of variables whose objectives are not met within the 12 months | ||||
| (2) | Frequency, F2 - and the frequency with which the objectives are not met over the 12 months | ||||
| (3) | Amplitude, F3 - the amount by which the objectives are not met | ||||
(3.1)
(3.1)
F1 = Scope which represents the percentage of variables that do not meet their objectives at least once during the time period under consideration (failed variables):(3.2)
(3.2)
F2 = Frequency which represents the percentage of individual tests that do not meet objectives (failed tests):(3.3)
(3.3)
F3 = Amplitude which is the amount by which failed test values do not meet their objectives.
It is calculated in three steps.
The number of times by which an individual concentration is greater than (or less than), the objective is termed an “excursion”. The test value must not exceed the objective:(3.4)
(3.4)
The collective amount by which individual tests was out of compliance is calculated by adding up the excursions of individual tests from their objectives and dividing by the total number of tests (both those meeting objectives and those not meeting objectives).(3.5)
(3.5)
where i is the first parameter to be evaluated; n = no of parameter chosen for the analysis
F3 is calculated by an asymptotic function that scales the normalized sum of the excursions from objectives (nse) to yield a range of score between 0 and 100:(3.6)
(3.6)
The index is thus calculated by summing F1, F2 and F3 as vectors. The sum of the squares of each factor is:(3.7)
(3.7)
Typically, water quality is ranked into the following five categories for the assessment and protection of aquatic environment (Canadian Council of Ministers of the Environment, Citation2001).
Excellent: (WQI: 95–100) - water quality is protected with a virtual absence of threat or impairment; conditions very close to natural or pristine levels.
Good: (WQI: 80–94) - water quality is protected with only a minor degree of threat or impairment; conditions rarely depart from natural or desirable levels.
Fair: (WQI: 65–79) - water quality is usually protected but occasionally threatened or impaired; conditions sometimes depart from natural or desirable levels.
Marginal: (WQI: 45–64) - water quality is frequently threatened or impaired; conditions often depart from natural or desirable levels.
Poor: (WQI: 0–44) - water quality is almost always threatened or impaired; conditions usually depart from natural or desirable levels.
2.6. Water quality index map
Geographical Information System (GIS) maps of the three Water Quality (Health, Environmental and Agricultural) Indices (WQIs) based on the CCME framework were produced. Each index was based on reported indicators of scientific importance to the assessment for domestic use or health (associating with drinking water), environmental (associating with ecosystem health) as well as agricultural water quality requirements. The Inverse Distance Weighted Interpolation (IDW) method of the spatial analyst extension (ESRI, Citation2002) in the ArcGIS 9.3 was used in the mapping of the computed WQI following Oke, Sangodoyin, Ogedengbe, and Omodele (Citation2013). The scores of WQI generated were mapped to show spatial characteristics of the indices across the basins. Assessments of how the indicators affect use of water for agricultural activities and environmental functions were made in relation to demography of the study area. The population data used were from the Nigerian Bureau of Statistics (Nigerian Bureau of Statistics, Citation2012).
3. Results and discussions
3.1. Water quality of rivers in Ogun and Ona basins
Figure (a–g) represents the mean value of the water quality indicators observed over the 12 months of sampling across the 8 rivers. Whereas there is no significant difference in pH across the rivers in Ogun and Ona Basins, the Opeki River has the highest pH (7.4) while only Omi has a value that is less than 7.0 making it slightly acidic. The EC characteristics across the rivers was found to be highest (Figure ) in the Omi which drains a peri-urban environment and was lowest in the Ofiki which drains predominantly agricultural and rural area. The EC is significantly low in the Ogun, Ofiki and Ibu Rivers than the maximum guideline value (3dS/m) compared to what was observed in the Omi and Opeki Rivers. The EC is generally low in the river basins.
Figure 3a. pH and EC across the rivers.
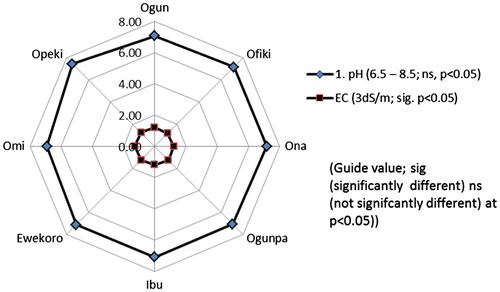
Figure 3b. Biochemical oxygen demand and dissolved oxygen in rivers across the Basins.
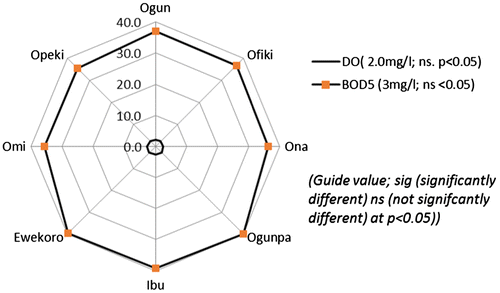
Figure 3c. TSS and turbidity in rivers across the basins.
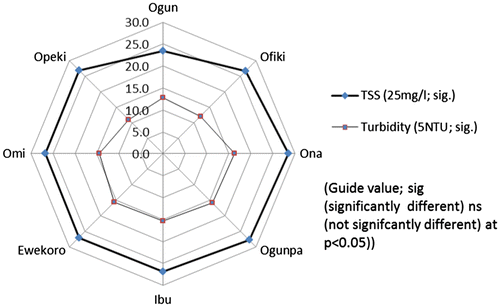
Figure 3d. Nitrogen characteristics in rivers across the Basins.
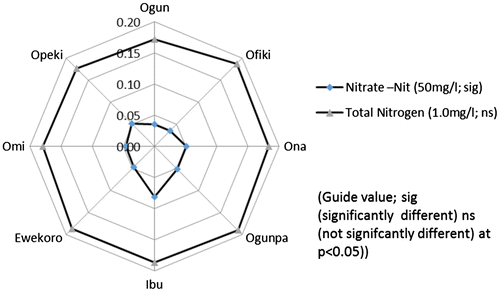
Figure 3e. Phosphorous characteristics in rivers across the basins.
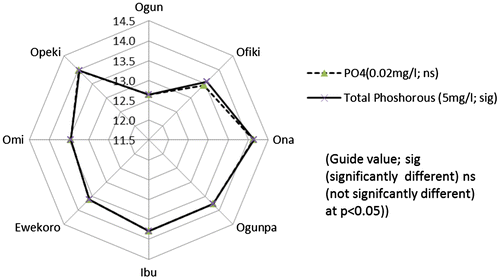
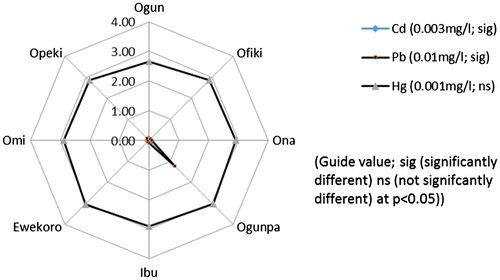
Figure 3f. Heavy metals characteristics in rivers across the basins.
Dissolved oxygen is not statistically different across the rivers. The Ogun and Opeki rivers however, are significantly lower in dissolved oxygen than the Ewekoro River which had the highest DO concentrations (3.0 mg/l). The observed low level of DO across the basins (2.17–3.0 mg/l) may be explained by the higher level of BOD5 observed across all of the rivers. The BOD5 ranged between 35 and 40 mg/l in the basins (Figure ). There is no significant difference in BOD5 across the rivers which implies that the level influx of organic load into the natural drainage is nearly homogenous in the Ogun and Ona Basins. This is also a reflection of poor drainage and land use planning in the basins. This observation is also corroborated by the high level of Turbidity (>5.0NTU) across all of the rivers.
Similarly, TSS is significantly higher in the Ona and Ogunpa Rivers which drain the Ibadan metropolitan area, while the Ogun River which drains area that are largely agricultural land, grasslands/woodlands and grazing/grasslands has the lowest level of TSS. The TSS ranged between 23.4 and 28.5 mg/l across the basins. TSS is an indicator of level of solids, debris and particles from runoff which contribute to turbidity status of the river water. Hence, this explains high level of turbidity in the rivers in settlement with large population, either urban or rural (Figure ).
Nitrate-nitrogen is significantly lower than the guideline value of 50 mg/l in all the rivers. However, the concentration in Ibu River (Figure ) was observed to be the highest (0.08 mg/l). It was significantly higher than levels found in all other rivers which were not statistically different from each other. The total Nitrogen concentration is not significantly different across all rivers in the studied basins. It follows almost the pattern of Nitrate-nitrogen too. Similarly, the concentrations of phosphate in the rivers are not significantly different. However, total Phosphorous in the Ogun River is significantly lower than concentrations observed in the Opeki, Ofiki, Ona, Ogunpa and Ibu Rivers (Figure ). The level of nitrate and phosphate relate to inorganic fertilizer use in the basins which is still lower than recommended fertilizer levels Afua, Nkonya, and Oboh (Citation2009), while other forms of nitrogen and phosphorous find their ways into the surface water bodies from other sources such as biodegradation of animal and human wastes. Because of the low level of Nitrate (0.04–0.08 mg/l) and Phosphate (12.7–14.1 mg/l) across the basins, eutrophication is low in all of the rivers under investigation. However, there is a renew interest in use of organic and inorganic fertilizers across the basins which may likely increase the level of N and P in the watersheds if proper control on agricultural inputs is not established.
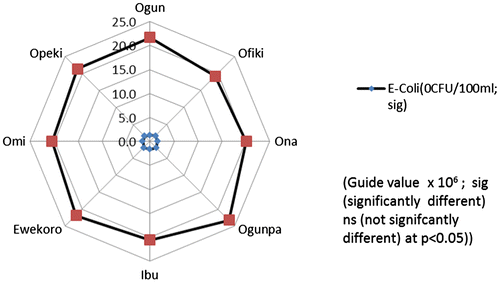
Figure shows the status of Cd, Hg and Pb, respectively. Cadmium concentration is worst in the Ona and Ogunpa Rivers (0.06 mg/l) due to poor waste disposal (solid especially electronic and industrial wastes) and sanitation inadequacies in the urban environment where the rivers receive surface runoff. Mercury concentration is not significantly different across the rivers and ranged between 2.66 mg/l in Ogun river and 3.05 in Ewekoro. The Pb concentration in Ogunpa River is significantly (p < 0.05) higher (1.22 mg/l) than all other rivers. All of the rivers have concentrations of heavy metals that are generally higher than the maximum tolerable concentration. This is similar to what was observed with the level of E. coli and Total Microbial Count in all the rivers (Figure ) which have the microbial load in the order of millions. These observations show that the levels of these metals and microbial pollutants known to be dangerous to human health are higher than save limit across the rivers in the basins. The concerns raised by these observations become more critical because of the population that is exposed to the use of these rivers for different agricultural and domestic purposes without any form of treatment. The high level of pollution load from heavy metals and microbial pollutants in Ogun and Ona Rivers have been observed by Jaji et al. (Citation2007) and Olanike and Olutayo (Citation2008) respectively. Nearly a decade after their works, the situation has not improved.
Figure 3g. Microbiological pollutants in rivers across the basin.
The Sodium Absorption Ratio (SAR) in the rivers is low. It ranged between 0.84 and 0.90 which suggests that, the balance of sodium, magnesium and calcium is within acceptable boundaries to keep the SAR less than 1.0 across the investigated rivers in the basins. The SAR was observed to be within the range required for agricultural water use, especially for irrigation.
3.2. Water quality indices
The observed water quality indicators were classified into three separate groups of parameters for computation of the three water quality indices for the basins. Table shows the quality score for the indices.
Table 1. Quality scores of the three water quality indices across the locations
The Health Water Quality Index (HWQI) was based on the critical indicators for health-related requirements. These are Hg, Cd, Cu, Pb, Mn NO2, NO3, E. coli and Faecal coliform (GEMS, Citation2007; MdWasim, Paramasivam, Ganguly, Purkait, & Daipayan, Citation2010; Mohamed & Osman, Citation1998; WHO, Citation2011; Xiang, Mika, Duo, & Egil, Citation2008). The Health Water Quality Index is required since water from these rivers across the basins is used for domestics, drinking water (in many of the rural communities) and sanitation. In the smaller cities, towns and villages across the basins, people use the water without any form of primary or conventional treatment.
The Environment Water Quality Index (EWQI) was based on the parameters that influence the aesthetic and environmental acceptability of surface waters. These are Fe, Zn, Cl, SO4, CO3, pH, BOD5, DO, NH4, and turbidity (GEMS, Citation2007; Kari-Matti, Citation1995; MdWasim et al., Citation2010).
The Agricultural Water Quality Index (AWQI) was based on the water quality indicators which are critical for evaluation of surface water for agricultural use. The parameters in this class are, EC, pH, turbidity, TSS, NO3, PO4-P, DO, TP and TN. Crop production, livestock and aquatic life management were the major consideration for this index (Ayres & Westcott, Citation1994; George, Citation2004).
3.2.1. Health water quality index across the Basins
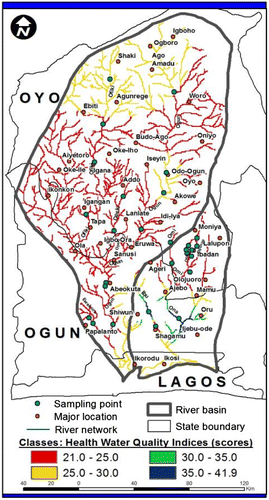
Figure shows the extent and characteristic of the rivers in the basins in terms of HWQI. The HWQI scores in all the rivers are between 21 and 42 (<44) which ranked them all as having poor quality. In the Ogun River, there is degradation of water quality from upstream to the last location downstream. The Ofiki River also shows degradation in the HWQI scores from OF1 (29) to OF3 (21) while there is a slight improvement at OF4 (24). The Ibu River degrades sharply from IB1 (42) to IB2 (21) which was a point just after the Ajura township. The Ona River which drains Ibadan City was among sites with the worst score for HWQI having rating of 21 for ON1, ON2, ON3 and 23 for ON4, while there is a sharp improvement in HWQI rating towards the last location ON5 (42). This is related to the self-purification capacity of the river which improves with distance downstream. Improvement is also attributed to the area ON4 being primarily forest and sparse agricultural land with reduced pollutant releases unlike what is received from the urban environment. The Ogunpa River is within Ibadan and has an average score of 21 across the locations just like the Ona River within the metropolis as well. The implications of this poor HWQI rating across all the locations studied with worse cases within urban rivers (Ona and Ogunpa) include a high risk for potential water-borne diseases and health conditions from exposure to the contaminated water. The risk of carcinogenicity and mutagenicity is high with the recorded high concentrations of Pb, Cd and Hg in the rivers and may increase the problem of bio-accumulation of these metals when the river water is used especially in dry seasons when demand for water from open sources increases in rural communities.
Figure 4. Spatial characteristics of health water quality in Ogun and Ona Basins.
3.2.2. Environmental water quality index across the Basins
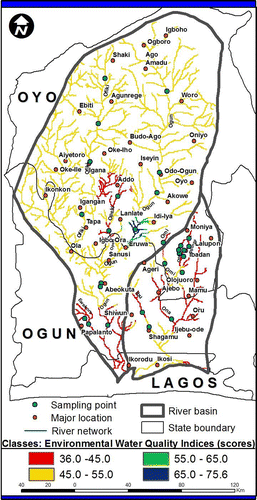
The Environmental water quality index (EWQI) is an index of environmental acceptability, aesthetics and appearance for recreational uses. In terms of EWQI, the rivers quality rating ranged from poor to marginal, and fair. The quality rating range was 40–76 across the basins. The distribution is shown in Figure . In Ogun River, OG3 has the highest rating of 76 which makes it fair in status and the best location while OG6, the last sampling locations downstream had the worst score (40) in terms of EWQI. However, OG1 and OG2 are rated with a score of 52 and 51, respectively, while OG5 and OG6 are rated 48 which makes them marginal. The Ofiki River is also marginal with rating between 45 and 50 with OF1 showing better status and quality, but the rating decreased downstream. Locations on the Ona River are marginal except ON2 (within Ibadan City centre) which was observed to be poor. However, the Ogunpa River was poor in terms of environmental acceptability and aesthetics. Across the basins, more than half of the locations (15 out of 27) showed marginal status in terms of EWQI (appearance and aesthetics). Being marginal implies that the rivers may look much better than the actual potential to cause health hazards as quantified by HWQI. Station OG3 alone with a quality rating of 76 has a fair status because it is in a location where the river has an expansive reach with little in-stream activities adding pollutants. High Fe, BOD, Turbidity and low DO, contributed to the marginal EWQI ratings.
Figure 5. Spatial characteristics of environmental water quality in Ogun and Ona Basins.
3.2.3. Agricultural Water Quality Index across the Basins
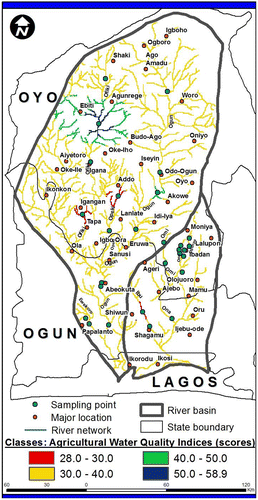
The AGWQI shows that the Ogun River is marginally fit for agricultural activities. The SAR in all the rivers and across the locations is within acceptable limits (<2.0dS/m) making the river water useful when considered for irrigation irrespective of the seasons. The requirement for aquaculture (including high DO and low turbidity) and livestock watering may not have been met because of high TSS, Turbidity, PO4-P and low DO. Basically, the AGWQI rating in the Ogun River ranged between 31 and 43 which still rank the locations as being poor (Figure ). Station OF2 was rated 59 which makes the source marginal but better than other locations within the Ofiki River with AGWQI ranging between 29 and 31 thus making them poor. Other rivers have poor ratings across all the locations (Figure ). Apart from the possibility of irrigation water requirement being met, the risk of eutrophication is high with high TP and PO4-P if the water is used for ponding or reservoir storage. Thus, the possibility of retaining the river water for other agricultural activities may be grossly limited. Similarly, as observed earlier, low DO, high TSS and Turbidity which characterize all the rivers limit the use of water for aquaculture and livestock production.
Figure 6. Spatial characteristics of agricultural water quality in Ogun and Ona Basins.
3.3. Water quality implications in the Basins
3.3.1. Impacts of water quality on agriculture in Ogun and Ona Basins
High concentrations of nutrients in water have been known to be responsible for eutrophication in surface water bodies (Ruth & Mathew, Citation2003). Lakes and reservoirs which are fed from rivers impaired with high load of nitrogen species (TN, NO3-N and NH4-N) and phosphorous compound (particulate phosphate and TP) develop algal blooms, increased turbidity and total dissolved solids which limit light penetration, reduces dissolved oxygen availability and consequently reduce the potential of such environments to sustain aquatic life. Nitrogen species are not very high in the study areas, but the major risk of nutrient pollution is from phosphorous compounds which are very high across the basins and pose a high risk of eutrophication. Also, it has been reported that wastewater or highly polluted water when used for irrigation could lead to the accumulation of heavy metals in soil and consequently transfer to plants and especially vegetables (Roy, Jamie, & Richard, Citation2003; WHO, Citation2006).
The study of health risk of metal toxicity through contaminated vegetables from polluted water used for irrigation in Varanasi, India showed that when the maximum permissible limits are exceeded, there is increase health risk to the population associated with Cd, Pb and Ni contamination of vegetables (Anita, Rajesh, Madhoolika, & Fiona, Citation2010). These are foreseeable dangers in the use of water in the basins if nothing is done to reduce the rate of contamination.
3.3.2. Implications of river water quality on human health in the Basins
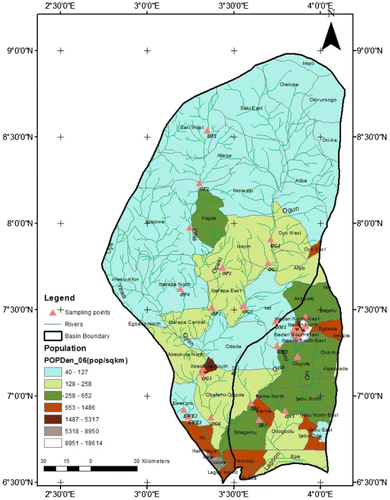
Figure shows the population map of the area under investigation. The population of the 65 Local Government Areas in the study area is over 20 million based on projection of Nigerian Bureau of Statistics (Citation2012). Presently, except in view parts of the urban centers where there is albeit irregular supply of pipe borne water, a higher percentage of the population in the urban, sub-urban and the rural agricultural areas depend on water from groundwater, rivers and streams for domestic activities without treatment.
Figure 7. Population distribution across the study area.
The observed concentrations of heavy metals in the rivers exceed the concentrations of acceptable intake by an adult per day (WHO, Citation2011). Also, the load of E. coli and faecal coliform in the river water system which were in the order of 106 Colony Forming Unit (CFU) per 100 ml is an indication that the water is close to the status of wastewater both in constituents and characteristics (Ruth & Mathew, Citation2003). Health and environmental issues are known to arise when polluted water is used for irrigation. The report of Ursula, Anne, Guillermo, and Duncan (Citation2000) gave evidences of enteric infections in farming families in direct contact with partially treated wastewater and in populations living nearby sprinkler irrigated fields, when the water quality exceeds 106 FC/100 ml. Regarding the use of wastewater or highly polluted water in aquaculture, WHO (Citation2006) reported evidence from epidemiological studies which showed that the faecal coliform needs to be below 10,000 FC/100 ml. There appears to be sufficient evidence to suggest that the tentative faecal coliform guideline of 1,000 FC/100 ml (WHO, Citation2006) for fishpond water is the right order of magnitude, and insufficient data to warrant a reduction in this level to 100 FC/100 ml or a relaxation to 10,000 FC/100 ml. For irrigation, the appropriate guideline will depend on which irrigation method is used and who is exposed. A guideline of 105 FC and 103 FC per 100 ml is required for sprinkler and furrow irrigation, respectively (WHO, Citation2006). This show the risk water users in the basins are exposed to with the high level of faecal coliform across all the locations and rivers studied because all these maximum guides were exceeded.
3.3.3. Implications for engineering structures in the Basins
The observation of river water quality in the basins shows a grave consequence for reservoirs, hydraulic weirs and lakes in the basins. With high TSS, Turbidity, Cd, Hg, Pb and Fe, the accumulation of heavy metals in the reservoir sediments and lakes will be high. This poses danger for secondary pollution from polluted river sediments as evidenced in the reported high accumulation factors from these rivers (Oke, Sangodoyin, Are, & Adelana, Citation2013). There are over 20 dams and weirs across the study area. The Ogun River is feeding Ikere George dam (250CM) at Saki and the Iseyin Irrigation Weir at Iseyin, while the Ofiki River is feeding a weir at Irawo Ile. The Opeki River is the source of the dam (2.5MCM) in Eruwa which is the major source of water to the Ibarapa community. Ogedengbe and Oke (Citation2004) have documented the reduction in the reservoir area of the Eruwa dam which partly resulted from invasive weeds resulting from the high nutrient in the reservoir water.
Since these dams also supply raw water to their respective treatment plants, there is the direct impact of high organic load, nutrients and heavy metals on the cost of coagulants in the conventional water treatment methods being employed. The residual level of heavy metals in the treated water may also be high and this exposes the receiving community potential risks from continual drinking of such water since the conventional treatment methods being used still have limitations in removing heavy metals.
4. Conclusion
The use of the CCME framework for water quality indexing enabled an integration of data across locations and across rivers at the basin level. The spatial characteristics of water quality variations were shown with the aid of GIS maps which allows for identification of major areas of high level of impairment in water quality. Thus, CCME eliminates the subjectivity that is common with the use of indices which are based on weight allocation. The spatial pattern of water quality status in relation to agriculture, health and environment quality requirements has been shown using GIS maps. This enables a clear understanding of water quality across the three major rivers in the Ogun and Ona River Basins. Although, it was found that except for environmental quality which bothers on aesthetic and outward appearances of the surface water which was marginal, quality for agriculture is poor especially in meeting aquaculture need even though it is still fair for crop production. Generally, across the rivers and all the locations in the basins, the water quality is poor and does not meet the domestic use requirements. Adequate water treatment procedures are required in the study area; unfortunately, this is currently largely unavailable in most communities across the basins.
Funding
The authors received no direct funding for this research.
Additional information
Notes on contributors
Adebayo O. Oke
Adebayo O. Oke and Abimbola Y. Sangodoyin are of the Obafemi Awolowo University and University of Ibadan, respectively. This work was initiated and jointly executed as part of the doctoral research activities of Oke in the University of Ibadan, Nigeria. The team is concerned about the inability of researchers in water resources in Nigeria to evaluate the status of river water quality beyond the immediate point of sampling, most importantly at the basin scale. With Omodele Taiwo, GIS was used to present the spatial variation in the water quality indices developed by using Canadian Council of Minister of Environment framework. The report presented in this work is part of the efforts of the team to evaluate the status of surface water quality in Ogun and Ona sub-basins which are part of the Ogun-Osun basin, one of the twelve major hydrological basins that delineate Nigeria hydrological systems.
References
- Afua, B. B. Nkonya, l. E., & Oboh, V. (2009). Fertilizer use in Nigeria: Perspective and insights from the agricultural extension service. Nigeria Strategy Support Program. International Food Programme Institute (IFPRI) Brief, 6, 1–6.
- American Public Health Association. (1992). Standard methods for the examination of water and wastewater (18th ed.). Washington, DC: Author.
- Anita, S., Rajesh, K. S., Madhoolika, A., & Fiona, M. M. (2010). Risk assessment of heavy metal toxicity through contaminated vegetables from wastewater irrigated area of Varanasi. India. Toxical Ecology, 51, 375–387.
- Ashok, L., Halliwel, D., & Tribeni, S. (2006). Application of CCME water quality index to monitor water quality: A case study of the Mackenzie River Basin. Canada. Environmental Monitoring and Assessment, 113, 411–429.
- Ayres, R. S., & Westcott, D. W. (1994). Water quality for agriculture. Rome: FAO.
- Canadian Council of Ministers of the Environment. (2001). Canadian water quality guidelines for the protection of aquatic life (CCME Water Quality Index 1.0 User’s Manual, pp. 1–4). Winnipeg: Author.
- de Simone, R., Dennis, C. D., & Monique, D. (2009). Comparative analysis of regional water quality in Canada using the water quality index. Environmental Monitoring and Assessment, 156, 223–240.
- ESRI. (2002). ArcGIS 9x using ArcGIS spatial analyst. Software user guide. Author.
- Fasunwo, O., Olowofela, J., Akinyemi, O., Fasunwo, B., & Akintokun, O. (2008). Contaminants evaluation as water quality indicator in Ago-Iwoye, South-western, Nigeria. African Physical Review, 2, 110–116.
- Franceska, D. W. (2005). Preparation for water sampling. In National field manual for the collection of water quality data, techniques for water resources investigation USGS. Retrieved September 16, 2008, from http://pubs.water.usgs.gov/twri9A/
- Gary, M. P., Sims, J. T., & Vance, G. R. (2006). Soil and environmental quality. New York, NY: CRC Press.
- George, P. R. (2004). Agricultural water quality criteria. Resource management (Technical Report No. 30). Australia: Department of Agriculture Western Australia.
- Global Environmental Monitoring Systems [GEMS]. (2007). Global drinking water quality index development and sensitivity analysis report (pp.3–18). Burlington, VT: United Nations Environment Programme. GEMS Water Programme.
- Helsel, D. R., & Hirsch, H. M. (2002). Statistical methods in water resources (pp 157–205). Techniques in Water Resources Investigation. United States Geological Services. Retrieved September 16, 2008, from http://water.usgs.gov/pubs/twri/twri4a3/
- House, M. A. (1989). A water quality index for the classification and operational management of Rivers. River basin management V. Advances in water pollution control (pp. 37–47). New York, NY: International Association on Water Pollution Research and Control.
- House, M. A. (1990). Water quality indices as indicators of ecosystem change. Environmental Monitoring and Assessment, 15, 255–263.10.1007/BF00394892
- Hülya, B. (2006). Development of a water quality index based on a European classification scheme. Water SA, 33, 101–106.
- Jaji, M. O., Bamgbose, O., Odukoya, O. O., & Arowolo, T. A. (2007). Water quality assessment of Ogun river, South West Nigeria. Environmental Monitoring and Assessment, 133, 473–482.10.1007/s10661-006-9602-1
- Kari-Matti, V. (1995). Direct and in-direct effects of Iron on River Ecosystems. Annales Zoologici Fennici, 32, 317–329.
- Liou, S. M., Lo, S. L., & Wang, S. H. (2004). A generalized water quality index for Taiwan. Environmental Monitoring and Assessment, 96, 32–25.
- Marta, T., Borrell, E., de Campos, S., Damia, B., & Roma, T. (2010). Surface water quality indices for the analysis of data generated by automated sampling networks. Trends in Analytical chemistry, 29, 40–52.
- MdWasim, A., Paramasivam, M., Ganguly, M., Purkait, S., & Daipayan, S. (2010). Assessment and occurrence of various Heavy Metals in Surface Water of Ganga River around Kolkata: A study for Toxicity and Ecological Impact. Environmental Monitoring and Assessment, 160, 207–213.
- Meybech, M., Kimstach, V., & Helmer, R. (1996). Strategies for water quality assessment - A guide to use of biota, Sediments and Water in Environmental Monitoring (pp. 40–73). Cambridge: UNESCO/WHO/UNEP.
- Mohamed, M. A., & Osman, M. A. (1998). Lead and cadmium in Nile River water and finished drinking water in Greater Cairo, Egypt. Environment International, 24, 767–772.10.1016/S0160-4120(98)00058-0
- Nigerian Bureau of Statistics. (2012). Annual abstract of statistics. Abuja: Federal Government of Nigeria.
- Ogedengbe, K., & Oke, A. O. (2004). Studies on the potential of Opeki River Dam for water supply and irrigation. Moor Journal of Agricultural Research, 5, 74–81.
- Oke, A., Sangodoyin, A., Are, K., & Adelana, A. (2013). Spatial variation of dissolved nutrient and heavy metal concentrations in river bed sediments as influenced by land-use patterns in Ogun-Osun River Basin, Nigeria. Journal of Environmental Protection, 4, 1203–1212.10.4236/jep.2013.411138
- Oke, A. O., Sangodoyin, A. Y., Ogedengbe, K., & Omodele, T. (2013). Mapping of river water quality using inverse distance weighted interpolation in Ogun-Osun River Basin, Nigeria. ACTA Geographical Debrecina Landscape & Environment, 7, 48–62.
- Olanike, K., & Olutayo, O. B. (2008). Geographical Information System (GIS) Mapping of spatio-temporal pollution status of rivers in IbadanNigeria. Pakistan Journal of Biological Sciences, 11, 982–988.
- Roy, M. K., Jamie, B., & Richard, C. (2003). Water in food production and processing: Quantity and quality concerns. Food control, 14, 283–299.
- Ruth, F. W., & Mathew, A. M. (2003). Environmental engineering (4th ed., pp. 51–104). Oxford: Butterworth and Heineman, Elsevier Science.
- Sargaonkar, A., & Deshpande, V. (2003). Development of an overall index of pollution for surface water base on a general classification scheme in Indian context. Environmental Monitoring and Assessment, 89, 43–67.10.1023/A:1025886025137
- Scottish Development Department [SDD]. (1976). Development of a water quality index. Applied research and development engineering division (pp. 1–62). Ellis: HMSO Edinburgh.
- Ursula, J. B., Anne, P., Guillermo, R., & Duncan, D. M. (2000) Guidelines for wastewater reuse in agriculture and aquaculture: Recommended revisions based on new research water and wastewater (18th ed.). Retrieved May 7, 2010, from http://www.lboro.ac.uk/well/
- WHO. (2006). WHO guidelines for the safe use of wastewater, excreta and greywater. Volume 1: Policy and regulatory aspects (pp. 19–30). Geneva: Author.
- WHO. (2011). World health organization guidelines for drinking-water quality (4th ed.). (pp. 7–33). Geneva: Author.
- Xiang, H., Mika, S., Duo, B., & Egil, T. G. (2008). Water quality in the Tibetian Plateau: Metal contents. Environmental Pollution, 156, 270–277.