
 ?Mathematical formulae have been encoded as MathML and are displayed in this HTML version using MathJax in order to improve their display. Uncheck the box to turn MathJax off. This feature requires Javascript. Click on a formula to zoom.
Abstract
Physico-chemical characterisation of industrial effluent is of importance in view of its inherent toxic substances. Effluent from cement plant located in Nigeria was characterised and its impact on the receiving Onyi River was investigated in this study. Effluent, water samples from upstream, discharge point along the river course and downstream location were collected monthly. The river was monitored up to about 1 km downstream from the discharge point for a period of twelve months. The impact of the effluent on the water quality downstream was shown by reduced dissolved oxygen. With respect to upstream, the levels of pH, nitrate, phosphate, total solid, total suspended solids, total dissolved solids, turbidity and biological oxygen demand at downstream were much high, arising from the influx of cement effluent. The cement effluent significantly contributed to the levels of Zn (0.045 ± 0.003 mg/L) and Pb (0.016 ± 0.001 mg/L) downstream such that they exceeded the criteria set by USEPA and WHO respectively. Using Prati method of classification of surface water quality, the Onyi River fell in the class of slightly polluted water. Weight arithmetic water quality index of 85.2 and metal pollution index of 3.46 corroborated the classification. Hence, adequate treatment of downstream water prior to its use for beneficial purposes is required.
Public Interest Statement
Waste water from industries contaminates rivers if discharged without adequate treatment. Consequently, upon this, most notable rivers in the world whose water resources are to be of benefit to human have been impaired. This study, therefore, focused on the assessment of the degree of contamination of Onyi River in Obajana with waste water from cement production plant. Upon the receipt of such water, the quality of the river was found unfit for beneficial purpose.
1. Introduction
Rivers are the major source of surface water for drinking, domestic, irrigation and industrial purposes which are of tremendous benefits to humans. Monitoring of water quality of rivers regularly is quite necessary for the assessment of water quality for beneficial purposes. One of the several approaches that can be used to assess the water quality status of rivers is to adopt water quality index (WQI) method (Goher, Hassan, Abdel-Moniem, Fahmy, & El-sayed, Citation2014). WQI is a mathematical expression utilised to transform large number of water quality data into a single number, which denotes the water characteristic (Sutadian, Muttil, Yilmaz, & Perera, Citation2017). The WQI was first developed in United State by incorporating few commonly used water quality variables, which include dissolved oxygen (DO). pH, conductance, alkalinity and chloride. Since then, several authors have formulated different methods to calculate water quality indices (WQIs). Such WQIs include US national sanitation foundation WQI (Brown, McCleihand, Deiniger, & O’Conor, Citation1972), Canadian council of ministers of the environment WQI (Khan, Paterson, & Khan, Citation2003) and Oregon WQI (Kannel, Lee, Lee, Kanel, & Khan, Citation2007). Upon the application of WQI, the quality of rivers can be categorised as excellent, good, medium, bad and very bad based on the WQI results (Chaturvedi & Bassin, Citation2010). To obtain data for WQIs, large number of samples are required in water quality measurement with long periods of continuous measurement. This requirement set a limitation to the use of these traditional WQIs. Three-dimensional (3D) fluorescence spectrum index method for river water has been developed to circumvent the difficulties in achieving substantial water-quality data for the use of traditional WQIs. The 3D fluorescence spectrum index has been applied to estimate surface water quality of the Ebinur lake watershed in China (Wang et al., Citation2017).
The availability of fresh surface water for these purposes is becoming hampered nowadays in the world partly due to municipal and industrial pollution. The vulnerability of rivers to especially industrial pollution is unprecedentedly high because of its unhindered accessibility for disposal of wastes. Pollution from industries constitutes a considerable part of total pollution in the world (Bai, Zhang, Sun, Wang, & Zhu, Citation2006; Pandey et al., Citation2005). With the development of industries across the world, rivers have become dumping reservoirs for solid wastes and effluents from industries. A navigable Shitalakkhya River in Bangladesh frequently receives waste from textile and dyeing industries located at Narayangany industrial zone. The waste was known to contain untreated dye with heavy metals (Islam, Sarkar, Rahman, & Ahmed, Citation2015). The major agro-industrial effluents of sugarcane and starch industries were discharged to the River Nile around Cairo city. Their disposal increased the microbial load of the River (Ali, Sabae, Fayez, Monib, & Hegazi, Citation2011; El-Sayed & Salem, Citation2015). The industrial effluent disposal into rivers which resulted to pollution was evident for Lake Calumet in Chicago (Roadcap, Kelly, & Bethke, Citation2005) and Gorka lake in Poland (Czop, Motyka, Sracek, & Szuwarzyński, Citation2011). Cement kiln dust was generated as by product from a cement plant in India (Kunal, Rajor, & Siddique, Citation2016). Like all over the world, Obajana community in Nigeria is encountering tremendous challenge of getting fresh water from the Onyi River. The river plays an important role in the supply of fresh water for bathing, household work and irrigation for Obajana community whose population is about 3,500 (Adejoh, Citation2016). The river is vulnerable to industrial pollution from a cement plant located in the community. Industrial effluent from the plant essentially contains stream of wastewater, solids and gaseous waste. The plant, however, claimed to have effluent treatment plant whose efficiency is uncertain.
The estimated amount of cement produced globally was 3.6 billion tonnes in which the proportion for Africa was 4.7% (Imbabi, Carrigan, & McKenna, Citation2012). production of cement in the world is increasing constantly and Nigeria is not exempted. Nigeria, being a developing country is experiencing a high demand for infrastructure and housing which places high demand for cement production (Makinde, Citation2014; Nyaruai, Kinyua, & Gathu, Citation2016). The cement production sector in Nigeria is playing a vital role in the Nigeria economic development due to its wide spectrum of usage. The by-products in form of effluent and gaseous waste from the cement plant are also increasing as production is stepped up. The dumping station of the effluent from the cement plant at Obajana is Onyi River. Using the Onyi riverwater for bathing and domestic purposes, the Obajana residents and people who are living at farther distance downstream are prone to skin irritation and cholera.
The assessments of effluent quality from the plant and of water quality of the Onyi River are very much necessary for safe and sound health of the community and river system. The assessment becomes an important tool to understand the effluent impact of the Onyi River. The classification of water quality of the river equally becomes possible with the assessment. Therefore, the objectives of this study were to investigate the quality of effluent from a cement plant, its impact on the Onyi River and to assess the water quality of the river for beneficial purpose. The impact was ascertained by comparison of the effluent quality with the national regulatory standard, National Environment Standards and Regulations Enforcement Agency (Citation2011), for effluent discharges into surface water meant for beneficial purposes such as irrigation, fisheries and swimming and recreation. The consideration of the downstream surface water as fit for drinking and domestic purposes was done by comparison of the water quality with the WHO standard for drinking water. Water-quality indices were also employed to classify the river based on the level of contamination from the effluent discharges. The information about the monitoring of quality of Onyi River in scope and duration is scarce in this regard. Hence, this attempt of frequent monthly monitoring of Onyi River was of environmental essential and could be useful for relevant evaluation of the cement industry. The monitoring covered both wet and dry seasons to study seasonal variations in the water characteristics of the river.
2. Description of study area and sampling design
Obajana Cement plant is the largest cement factory in West Africa and is located in Obajana community on latitude 7.916°N and longitude 6.433°E of Kogi state, The plant is about 60 m away to the Onyi River which frequently receives discharges of effluent directly from the plant. Selected portion of the river with sampling points along the river is shown in Figure . Some vegetation grows around the company and the banks of the river. The riverbank is characterised with steep-sided valley. The Fulani settlements are remotely located in the community and access is only via footpaths. The Fulani are nomadic by nature and can settle where there is favourable condition even for their cattle. Occupations of the people in this community include cattle rearing, farming, hunting and petty trading. The crops grown in this area include rice, sweet potatoes, maize, millets, sugarcane, cassava and cowpea.
Figure 1. Selected area of Onyi River at Obajana showing sampling points.
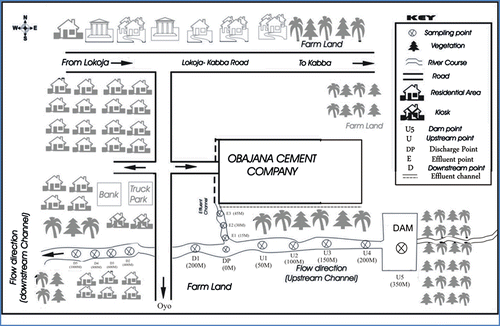
A portion of the Onyi River under investigation was divided into four zones taking reference from the point of discharge of effluent into the river. These zones are the (1) Dam (2) upstream (3) discharge point at which industrial discharge entered the water course and (4) downstream. All the sampling points along the watercourse before the discharge point were referred to as upstream and it serves as the control points, while all those sampling points after the discharge point were referred to as downstream. The sampling points are designated as follows:
| (1) | The dam and upstream sampling points were designated as U1–U5 with distances ranging from 50 to 200 m to the discharge point, | ||||
| (2) | The discharge point at junction where the effluent discharging channel intersected the river and was designated as JP. | ||||
| (3) | The effluent collection points along the effluent discharging channel and were designated as E1–E3, | ||||
| (4) | The downstream point as D1–D5 with distances ranging from 200 to 1,000 m away from the discharge point, | ||||
| (5) | One sampling point was located at the Dam location. This was designated as U5 (350 m). | ||||
3. Sampling and chemical analysis of samples
Effluents and water samples of 2.5 L each were collected using grab sampling technique at the designated sampling point monthly for a year. They were kept at 4°C in ice chests and transported to the laboratory. In the laboratory, analyses were carried out immediately. A total of 36 effluent samples and 132 water samples were collected into polyethylene containers soaked in 2 M HNO3, washed and rinsed with distilled water prior to sampling. All analyses were carried out using standard procedures of the American Public Health Association, American Water Works Association & Water Environmental Federation (Citation1998). The physicochemical qualities of the samples were determined. The pH of samples was determined by electrometric method using a pH meter (HANNA, model HI 96107). Total alkalinity, total hardness, calcium and magnesium were determined by titrimetry. Gravimetry method was used for total solid (TS), total suspended solids (TSS) and total dissolved solids (TDS). Turbidity was determined by turbidimetry method. This method is based on the comparison of the intensity of UV/Visible light scattered by the sample solution with that of 400 FTU. The absorbance values of the solutions were determined using NICOLET Evolution 300 UV/Visible spectrophotometer. Sulphate, nitrate and phosphate were determined by colorimetry. Colorimetric determination of sulphate was performed with barium chloride solution as reagent. Colorimetric phenoldisulphonic acid method was used for nitrate while molybdenum blue method was employed for phosphate. In each of these methods, the absorbance values of the colour solutions were measured with spectrophotometer.
Alkaline-azide modification of Winkler’s method was used for dissolved oxygen and biological oxygen demand (BOD). Open reflux method involving the oxidation of organic matter of sample in acidic medium and titration with ferrous ammonium sulphate was used for chemical oxygen demand (COD). Heavy metals (Cd, Co, Cr, Cu, Ni, Pb and Zn) were determined by atomic absorption spectrophotometry using Buck 205 Atomic Spectrophotometer after the digestion of samples with concentrated nitric acid.
All the reagents were of analar grade. Sample blanks were collected for the determinations of anions and metals and appropriate corrections were made. The recovery study of heavy metals in samples was carried out and percentage recoveries of 90.1–110% (Co), 89.4–102% (Cd), 94.3–106% (Cr), 86.7–90.0% (Cu), 90.0–103% (Ni), 98.6–101% (Pb) and 92.5–105% (Zn) were obtained.
4. Application of water quality and pollution indeces
The suitability of water from the river downstream was investigated using weighted arithmetic WQI and metal pollution index (PI) as described by Brown et al. (Citation1972) and Caeiro et al. (Citation2005) respectively. The downstream physicochemical parameter values together with WHO standard permissible limits of the parameter were employed to evaluate the mathematical expression for WQI given as follows:
where Qi is the quality rating scale of each parameter, W is the weight unit of each parameter and n is the number of parameter measured. Qi was obtained using the following expression:
where Vi is the concentration of each parameter, Si is the WHO standard permissible value of each parameter and Vo is the ideal value of each parameter in pure water. The Vo values for all parameters are zero except for pH and DO values which are 7.0 and 14.6, respectively (Tripaty & Sahu, Citation2005). The value of Wi for each water quality parameter is inversely proportional to the WHO recommended standard for the parameter. Therefore, Wi is expressed as follows:
The proportionality constant K of the weights for various water quality parameters is given as follows:
The metal PI for Onyi River was evaluated using the following expression:
where Ci is the concentration of each metal for maximum and minimum values and Si is the metal level according to WHO water quality criteria.
In view of the utilisation of natural water resources as a source of municipal water supply, a classification was established by Prati, Pavanello, and Pesarin (Citation1971). The classification was based on certain water-quality parameters that are only indicative of most commonly measured parameters. The accepted categories of water quality are excellent, accepted, slightly polluted, polluted and heavily polluted water types. The ranges of concentrations of the parameters for which the classification is based are available in the literature (Prati et al., Citation1971). The two approaches that seemed to have been used in Prati single index of pollution make the index most preferred for this study. The first approach was based on the characteristics of effluents before their discharge into water bodies. The second approach took into consideration the quality to be maintained in water bodies after dilution of effluents, natural capacity of water bodies for dispersion and self-purification capacity of water bodies. These important considerations were fully considered in the design of this study.
5. Statistical analysis of data
Kruskal-Wallis ANOVA non-parametric (p = 0.05) was employed to investigate the difference between the water quality parameters during dry and wet season. This statistical parameter was equally used to determine the difference between water-quality upstream and downstream. Non-parametric test was used because the data were few and were not normally distributed. These statistical analyses were carried out with the aid of OriginPro-8 software package. The results of the analysis were confirmed with Duncan multiple test range.
6. Results and discussions
6.1. Physicochemical characteristics of cement effluent
The production process of cement involves burning of limestone and clay together in a rotary kiln at a temperature of about 1,450°C (Gaharwar, Gaurav, Singh, Singh, & Gariya, Citation2016). This might be responsible for the observed high average temperature of the effluent. The temperature of the effluent was 28.0 ± 2.7°C ranging from 24 to 34°C (Table ). The pH of 9.1 ± 0.9 suggested that the effluent was alkaline in nature. This observation is similar to the report about pH of 8.3 for effluent from cement plant located at Sistan area of Iran (Table ). Following mixing of calcium carbonate, alumnum silicate, silica oxide and iron oxide as raw materials for cement production in a rotary kiln, water is required in the plant by factory workers for sanitary purpose. This might result in wastewater that is alkaline. The resulting effluent from the production has potential of imparting high alkalinity to the effluent receiving Onyi River. The total alkalinity of the effluent was 87 ± 33 mg/L with a range of 35–150 mg/L (Table ). These levels of alkalinity were lower than 625 mg/L observed for cement effluent from Chttak industrial zone of Bangladesh (Table ).
Table 1. Physicochemical characteristics of cement effluent discharged to the Onyi river and effluent quality standards
Most cement plants are well located near a limestone quarry. Quarrying limestone in Obajana community involves drilling and crushing. These operations could be responsible for the TSS of 240 ± 267 mg/L observed for the effluent. In addition, the end product of pryoprocessing at the rotary kiln ranges from dust to lumps of calcium silicate or clinker that can possibly contribute to the TS level of 449 ± 318 mg/L for the effluent. The cement effluent acquires hardness due to dissolved calcium and magnesium salts possibly from the ore. The concentrations of calcium and magnesium in the effluent were in the range of 12.8–58.0 and 5.09–22.8 mg/L, respectively (Table ). In order to produce cement, limestone as a major raw material undergoes calcination process. The process entails the decomposition of limestone to calcium oxide which reacts with silicate to form cement and carbon(IV) oxide that is given off. In the presence of this gas as a byproduct, a small quantity of limestone (CaCO3) can readily dissolve in moisture to produce soluble calcium bicarbonate. The soluble calcium of this salt forms about 38% of total hardness of effluent from the Obajana cement plant. The total hardness level of the effluent was 71 ± 32 mg/L ranging from 31 to 153 mg/L. The suspended solids of the effluent ranging from 20 to 1,590 mg/L exceeded NESREA standard limit of 0.75 mg/L for effluent discharge into surface water in Nigeria. This indicates that cement production releases significant amount of solid waste materials not only to the atmosphere, but to surface water as well. The effluent from Sistan cement plant originating principally from cooling operations contained low suspended solids of 5.4 mg/L in comparison to 20–1,590 mg/L observed in this study (Table ).
The effluent was observed to have turbidity ranging from 7.5 to 804 FTU. Turbid effluent can interfere with Onyi River by reducing sunlight penetration which may affect food supplies and growth of aquatic organism (Mackie & Walsh, Citation2012). The possibility of microbial pollution in water bodies is often accelerated by high turbid effluent due to high number of foreign microbiota supported by the turbidity (Karikari & Ansa-Asare, Citation2006).
The chloride (18.0 ± 7.9 mg/L) and sulphate (3.8 ± 1.9 mg/L) contents of the effluent were within the regulatory limits. This suggests that the chloride concentrations of the effluent may not have a discernible impact on the water quality of the river. Nearly all water bodies contain chloride and sulphate, and their levels vary greatly depending on the underlying composition of the river bed. The concern for chloride level, if higher than the background concentration, is that it can corrode metal reinforcement such as bridge that is erected along the water way (Kelly et al., Citation2007). Sulphate has also been implicated as a corrosive agent in water bodies (Bowell, Citation2004). The concentrations of chloride and sulphate in cement effluent at Obajana were much less compared with the corresponding concentrations of 3,458 and 2,455 mg/L reported for cement effluent discharged to Surma River in Bangladesh (Table ).
The phosphate (29± mg/L) and nitrate (141 ± 106 mg/L) levels exceeded the respective NESREA regulatory limits of 3.5 and 40.0 mg/L. Detergents used for washing during sanitation are major sources of phosphate and nitrate in the effluent from cement plant (Lee & Jones, Citation1986). In spite of water bodies requiring some nutrients such as phosphorus and nitrogen to be healthy, excessive levels of the nutrients can be harmful (George et al., Citation2010). The eutrophication process on the Onyi River can thus be accelerated with excessive levels of phosphate and nitrate from the effluent.
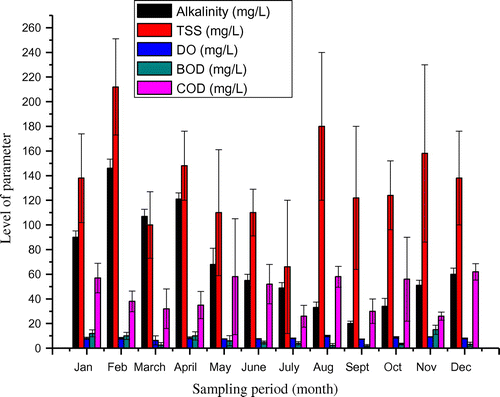
Biochemical oxygen demand (BOD) and COD are major indicators of the environmental health of effluent receiving water bodies (Patil, Sawant, & Deshmukh, Citation2012). The level of BOD (5.3 ± 3.7 mg/L) ranging from 3.1 to 12.2 m/L was below the regulatory limit of 6.0 mg/L, though high level of BOD for effluent was observed for some months (Figure ). On the other hand, the level of COD (63 ± 43 mg/L) was above 30 mg/L set as standard for effluent discharge into surface water. This is an indication of gross chemical load of the effluent, discharging into the Onyi River. The COD concentration of 63 ± 43 mg/L observed in this study compared well with COD of 60 mg/L reported by Alam et al. (Citation2007). The average levels of heavy metals in the effluent as shown in Table were Co (0.01 ± 0.01 mg/L), Cd (0.002 ± 0.002 mg/L), Cr (0.1 ± 0.1 mg/L), Cu (0.01 ± 0.01 mg/L), Ni (0.01 ± 0.01 mg/L), Pb (0.03 ± 0.03 mg/L) and Zn (0.06 ± 0.03 mg/L). These levels of metals were within the regulatory limits for effluent discharge into surface water.
7. Characteristics of the Onyi River surface water
The status of water quality at the discharge point, upstream and downstream locations of the river are shown in Table . The discharge point is a junction along the Onyi River where outflow effluent mixes with river water. The water quality parameters for the upstream were compared with that for the downstream to evaluate the impact of the effluent. It was observed that after the mixing, alkalinity, total hardness, Ca2+, Mg2+, solids, Cl−, ,
,
, COD, BOD, Cd and Cr levels were increased significantly (Table ). This is temporal indicating that effluent discharges from cement plant have impacted negatively the water quality status of the Onyi River. The effluent was alkaline having pH of 8.32–9.05, but its influx into the Onyi River had no significant impact on the water pH. The alkalinity levels at upstream (51.0 ± 1.8; 71.0 ± 4.0 mg/L) and downstream (58.0 ± 2.5; 81.0 ± 8.4 mg/L) were not also significantly different.
Table 2. Average levels of water quality parameters at discharge point, upstream and downstream of Onyi river during rainy and dry season
8. Temporal and seasonal variations of water quality Onyi River
The water quality of Onyi River varied with the sampling periods (Figures and ). Effluent from cement plant showed variation in terms of pollution load from wet season to dry season taking cue from the production rate of cement. There seemed to be low production turn out in wet season than in the dry season. A rainfall during placement of concrete work can pose challenges to achieving a quality concrete, thus making cement demand decreases during wet season. This could result in lower cement production during wet season than dry season and consequently reduces the influx of effluent into the Onyi River. The water quality parameters at discharge point between the wet season and dry season were significantly different as shown in Table (p < 0.05). The only exception was the TS of the effluent whose contents varied between 496 ± 208 mg/L for wet season and 493 ± 123 mg/L for dry season. The concentrations of heavy metals at discharge point were higher during the dry season in comparison to the wet season (Table ). This is probably owing to the low flow of water during dry season. In wet season, much dilution of the effluent would have taken place. In like manner, the water quality upstream and downstream varied significantly between the wet season and dry season. The few parameters that were not affected by seasonal changes were pH, DO and COD for upstream and downstream. The turbidity level of downstream water was not equally affected by seasonal variation. DO levels at discharge point were lower in comparison with the corresponding levels for either upstream or downstream locations (Table ). The DO of 6.8 ± 0.4 and 7.4 ± 1.4 mg/L were observed for wet and dry seasons respectively. These were lower than the levels at upstream (8.1 ± 0.5; 9.1 ± 1.5 mg/L) and downstream water (8.1 ± 0.4; 8.0 ± 1.1 mg/L). The depression in available DO level of the river is an indication of the presence of oxygen demand substances such as suspended materials in cement effluent. When this occurs the DO becomes a limiting factor for aquatic life to survive in Onyi River. However, certain species of fish can resist or tolerate low DO if decline is not abrupt (Vinson & Levesque, Citation1994).
Figure 2. Monthly variations in pH, turbidity, calcium, magnesium and TS levels.
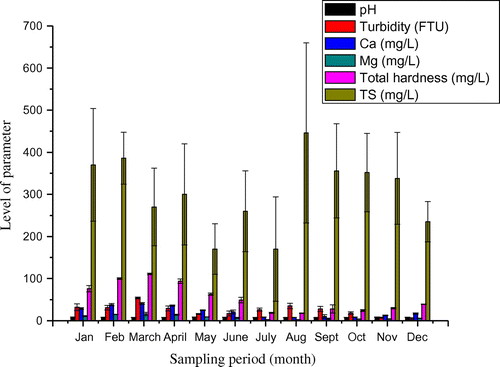
Figure 3. Monthly variations in alkalinity, TSS, DO, BOD and COD levels.
9. Comparison of water quality of Onyi river with some water quality standards
The average levels of water quality parameters for upstream and downstream are shown in Table . No significant differences were found between the average values of pH, temperature, DO and zinc for upstream and downstream. Except temperature, DO, cadmium and lead, the levels of water quality parameters for downstream were above the corresponding levels for upstream. This trend has implication on the aquatic system. For instance, the environmental effects of alkaline wastewater on the receiving river can be severe (Roadcap et al., Citation2005). The impacts include increased water pH, high COD and oxygen depletion in the water, high sulphate loading and increase in metal concentration (Mayer, Younger, & Aumonier, Citation2008).
Table 3. Comparison of average water quality of Onyi river with some water quality standards
In spite of alkaline nature of cement effluent as observed in this study the downstream water pH could only increase by 0.1 units in comparison with the upstream water pH. The water pH for upstream was within the pH range of 6.5–9.0 for drinking water and aquatic life (Table ). The total hardness level of 54.4 ± 2.4 mg/L for upstream was not above 500 mg/L set as a limit by WHO for drinking water. There is no adverse effect associated yet with water hardness in the WHO guidelines; however undesirable roles of hard water in heart disease and domestic utility have been mentioned by Schroeder (Citation1960). Based on the classification in terms of degree of hardness, the Onyi River water is soft as total hardness level is less than 75 mg/L being mentioned for soft surface water (El-Sayed & Salem, Citation2015). The low level water hardness could be attributed to cement kiln dust that possibly flowed along with effluent as part of by product from cement plant. This dust is a significant resource material for lime substitute that can be utilised as a chemical addition for stabilising wastewater receiving river. The dust is known to contain high CaO content that can act as a precipitant. TSS as low as 134 ± 34 mg/L was observed possibly owing to the presence of CaO, which could have enhanced settling of much of suspended solids from the effluent. The total dissolved solid level of the downstream water was well below the WHO limit of 600 mg/L (Table ).
10. WQI for classification of Onyi River water quality
There was a need to determine the water quality of Onyi River downstream in view of its utilisation for domestic purpose. On this basis, a single index of pollution established by Prati et al. (Citation1971) for the classification revealed that Onyi river water downstream fell in the class of slightly polluted water (Table ).
Using WQI and metal PI approaches for classification of water quality (Table ), Onyi River can be classified on the basis of degree of metal contamination. The values obtained for Qi, Wi and Ci/Si variables are shown in Table . The values for the variables were obtainable because of the availability of WHO limits for the selected parameters. The WQI for the Onyi River was 85.2 with respect to drinking and domestic purposes. This indicates that the water quality of the river is very poor for such purposes. The metal PI of 3.46 was obtained showing that the river was strongly contaminated with heavy metal.
Table 4. Classification of surface water using water quality and metal pollution indeces
Table 5. Measured quality rating (Qi), weight unit (Wi) of each parameter and metal index variables
11. Proposed potential mitigating actions
Process for the manufacture of cement should include provision not only for ensuring a standard product, but also for avoiding the release of treated effluent into surface water. Nigeria is a temperate region with insufficient natural water resources especially in the dry season. Reuse of adequate treated cement effluent for irrigation is necessary to compensate for the shortage. Much of this practice should be embraced worldwide. Reuse of wastewater is a usual practice in Israel where 65–70% of wastewater of industrial origin is reused in agriculture after biological treatment (Icekson-Tal, Avraham, Sack, & Cikurel, Citation2003).
The inorganic load of the effluent will be greatly reduced by installing equipment for precipitation. In this case, sodium sulphate can be added to aid precipitation of most metals. It is necessary to increase the number of septic tank systems to sufficiently remove TSS from the effluent by sedimentation, flocculation and skimming. These processes are expected to also reduce organic load.
12. Conclusions
The Onyi river water was vulnerable to pollution by the discharge of cement effluent of inadeqauate quality. The effluent contained high load of suspended solid and COD substances. The magnitude of nitrate and phosphorus in the effluent were above the allowable limits and may allow for algal growth in the river. With upstream dilution of the effluent the Onyi River water at downstream location is still very poor and remains unfit for drinking and domestic purposes. Hence, the Onyi River water has potential to impact humans’ health negatively if ingested. The river was strongly impacted with metal pollution. Intense treatment is therefore required for the effluent prior to discharges and regular monitoring of the Onyi river is equally recommended. More research is still needed particularly to determine the characteristic of sediments and assess the impact of the effluent on the sediments of the Onyi river.
Additional information
Funding
Notes on contributors
A.R. Ipeaiyeda
A.R. Ipeaiyeda is a senior lecturer at the Department of Chemistry, University of Ibadan, Ibadan, Nigeria.
G.M. Obaje
G.M. Obaje is a lecturer at the Department of Chemistry, Kogi State College of Education, Kogi, Nigeria. He is currently a PhD student in the Department of Chemistry, University of Ibadan.
References
- Adejoh, I. P. (2016). Assessment of heavy metal contamination of soil and cassava plants within the vicinity of a cement of a cement factory in north central Nigeria. Advances in Applied Science Research, 7, 20–27.
- Alam, J. B., Hossain, A., Khan, S. K., Banik, B. K., Islam, M. R., Muyen, Z., & Rahman, M. H. (2007). Deterioration of water quality of Surma river. Environmental Monitoring and Assessment, 134, 233–242.10.1007/s10661-007-9612-7
- Ali, S. M., Sabae, S. Z., Fayez, M., Monib, M., & Hegazi, N. A. (2011). The influence of agro-industrial effluents on River Nile pollution. Journal of Advanced Research, 2, 85–95.10.1016/j.jare.2010.08.008
- American Public Health Association, American Water Works Association and Water Environmental Federation. (1998). Standard methods for the examination of water and waste water (20th ed., pp. 7–15). Washington, DC: Author.
- Bai, X., Zhang, X., Sun, Q., Wang, X., & Zhu, B. (2006). Effect of water source pollution on the water quality of Shanghai water supply system. Journal of Environmental Science and Health, Part A, 41, 1271–1280.10.1080/10934520600656711
- Bowell, R. J. (2004). A review of sulfate removal options for mine waters. Proceedings of Mine Water, 75–88.
- Brown, R. M., McCleihand, N. J., Deiniger, R. A., & O’Conor, M. F. A. (1972). Water quality index—Crossing the physical barrier. In S. H. Jenkis (Ed.), Proceeding in International Conference on Water Pollution Research Jerusalem (Vol. 6, pp. 787–797).
- Caeiro, S., Costa, M. H., Ramos, T. B., Fernandes, F., Silveira, N., Coimbra, A., … Painho, M. (2005). Assessing heavy metal contamination in Sado Estuary sediment: An index analysis approach. Ecological Indicators, 5, 151–169.10.1016/j.ecolind.2005.02.001
- Canadian Council of Ministers of the Environment. (1999). Canadian environmental quality guidelines. Winnipeg, MB: Author.
- Chaturvedi, M. K., & Bassin, J. K. (2010). Assessing the water quality index of water treatment plant and bore wells, in Delhi, India. Environmental Monitoring and Assessment, 163, 449–453.10.1007/s10661-009-0848-2
- Czop, M., Motyka, J., Sracek, O., & Szuwarzyński, M. (2011). Geochemistry of the hyperalkaline Gorka pit lake (pH > 13) in the Chrzanow region, Southern Poland. Water, Air and Soil Pollution, 214, 423–434.10.1007/s11270-010-0433-x
- El-Sayed, M., & Salem, W. M. (2015). Hydrochemical assessments of surface Nile water and ground water in an industry area—South West Cairo. Egyptian Journal of Petroleum, 24, 277–288.10.1016/j.ejpe.2015.07.014
- Gaharwar, A. S., Gaurav, N., Singh, A. P., Singh, H., & Gariya, B. (2016). A review article on manufacturing process of cement, environment attributes, topography and climatological data station: 1MD, Sidhi M. P. Journal of Medicinal Plants Studies, 4, 47–53.
- George, J., Thakur, S. K., Tripathi, R. C., Ram, L. C., Gupta, A., & Prasad, S. (2010). Impact of coal industries on the quality of Damodar river water. Toxicological & Environmental Chemistry, 92, 1649–1664.10.1080/02772241003783737
- Goher, M. E., Hassan, A. H., Abdel-Moniem, I. A., Fahmy, A. H., & El-sayed, S. M. (2014). Evaluation of surface water quality and heavy metal indices of Ismailia Canal, Nile River, Egypt. The Egyptian Journal of Aquatic Research, 40, 225–233.10.1016/j.ejar.2014.09.001
- Icekson-Tal, N., Avraham, O., Sack, J., & Cikurel, H. (2003). Water reuse in Israel-the Dan Region Project: Evaluation of water quality and reliability of plant’s operation. Water Science and Technology: Water Supply, 3, 231–237.
- Imbabi, M. S., Carrigan, C., & McKenna, S. (2012). Trends and developments in green cement and concrete technology. International Journal of Sustainable Built Environment, 1, 194–216.10.1016/j.ijsbe.2013.05.001
- Islam, J. B., Sarkar, M., Rahman, A. K. M., & Ahmed, K. S. (2015). Quantitative assessment of toxicity in the Shitalakkhya River, Bangladesh. The Egyptian Journal of Aquatic Research, 41, 25–30.10.1016/j.ejar.2015.02.002
- Kannel, P. R., Lee, S., Lee, Y. S., Kanel, S. R., & Khan, S. P. (2007). Application of water quality indices and dissolved oxygen as indicators for river water classification and urban impact assessment. Environmental Monitoring and Assessment, 132, 93–110.10.1007/s10661-006-9505-1
- Karikari, A. Y., & Ansa-Asare, O. D. (2006). Physico-chemical and microbial water quality assessment of Densu River of Ghana. West African Journal of Applied Ecology, 10(1).
- Kelly, V. R., Lovett, G. M., Weathers, K. C., Findlay, S. E., Strayer, D. L., Burns, D. J., & Likens, G. E. (2007). Long-term sodium chloride retention in a rural watershed: Legacy effects of road salt on streamwater concentration. Environmental Science & Technology, 42, 410–415.
- Khammar, S., & Darvishi, A. (2016). The dispersion of heavy metals in the air, soil and wastewater of sistan cement factory, South East of Iran. The Caspian Sea Journal, 10, 114–117.
- Khan, A. A., Paterson, R., & Khan, H. (2003). Modification and application of the CCME WQI for the communication of drinking water quality data in newfoundland and labrador. In 38th, Central Symposium on Water Quality Research, Canadian Association on Water Quality (pp. 10–11).
- Kunal, Rajor, A., & Siddique, R. (2016). Bacterial treatment of alkaline cement kiln dust using Bacillus halodurans strain KG1. Brazilian Journal of Microbiology, 47, 1–9.10.1016/j.bjm.2015.11.001
- Lee, G. F., & Jones, R. A. (1986). Detergent phosphate bans and eutrophication. Environmental Science Technology, 20, 330–331.10.1021/es00146a003
- Mackie, A. L., & Walsh, M. E. (2012). Bench-scale study of active mine water treatment using cement kiln dust (CKD) as a neutralization agent. Water Research, 46, 327–334.10.1016/j.watres.2011.10.030
- Makinde, O. O. (2014). Housing delivery system, need and demand. Environment, Development and Sustainability, 16, 49–69.10.1007/s10668-013-9474-9
- Mayer, W. M., Younger, P. L., & Aumonier, J. (2008). Hydrogeochemistry of alkaline steel slag leachates in UK. Water Air Soil Pollution, 195, 35–50.
- National Environment Standards and Regulations Enforcement Agency. (2011). Federal Republic of Nigeria Official Gazette, Nigeria; Lagos. 98, 693–727. Retrieved March 20, 2017, from http://extwprlegs1.fao.org/docs/pdf/nig145947.pdf
- Nyaruai, M. N., Kinyua, R., & Gathu, R. (2016). Factors affecting management of safety and health in the building construction industry in Nakuru County, Kenya. International Journal of Innovation and Applied Studies, 18, 83–89.
- Pandey, M., Dixit, V. K., Katiyar, G. P., Nath, G., Sundram, S. M., Chandra, N., … Upadhay Ganga, V. K. (2005). Water pollution and occurrence of enteric diseases in Varanasi City. Indian Journal of Community Medicine, 30, 115–120.
- Patil, P. N., Sawant, D. V., & Deshmukh, R. N. (2012). Physico-chemical parameters for testing of water—A review. International Journal of Environmental Sciences, 3, 1194–1207.
- Prati, L., Pavanello, R., & Pesarin, F. (1971). Assessment of surface water quality by a single index of pollution. Water Research, 5, 741–751.10.1016/0043-1354(71)90097-2
- Roadcap, G. S., Kelly, W. R., & Bethke, C. M. (2005). Geochemistry of extremely alkaline (pH > 12) ground water in slag-fill aquifers. Ground Water, 43, 806–816.10.1111/(ISSN)1745-6584
- Schroeder, H. A. (1960). Relations between hardness of water and death rates from certain chronic and degenerative diseases in the United States. Journal of Clinical Epidemiology, 12, 586–591.
- Sutadian, A. D., Muttil, N., Yilmaz, A. G., & Perera, B. J. C. (2017). Using the Analytic Hierarchy Process to identify parameter weights for developing a water quality index. Ecological Indicators, 75, 220–233.10.1016/j.ecolind.2016.12.043
- Tripaty, J. K., & Sahu, K. C. (2005). Seasonal hydrochemistry of groundwater in the barrier spit system of the Chilika Lagoon, India. Journal of Environmental Hydrology, 13, 1–9.
- USEPA. (1999). Environment fact sheet: Management standards proposed for cement kiln dust waste. Retrieved October 20, 2014, from http://www.epa.gov/fed.gstr/EPA-AIR/199/some/Day-14/a12893.htm
- Vinson, M., & Levesque, S. (1994). Redband trout response to hypoxia in a natural environment. Great Basin Naturalist, 54, 150–155.
- Wang, X., Zhang, F., Ghulam, A., Trumbo, A. L., Yang, J., Ren, Y., & Jing, Y. (2017). Evaluation and estimation of surface water quality in an arid region based on EEM-PARAFAC and 3D fluorescence spectral index: A case study of the Ebinur Lake Watershed, China. CATENA, 155, 62–74.10.1016/j.catena.2017.03.006
- World Bank. (1995). Industrial pollution prevention and abatement: Industrial estates. Draft technical background document. Washington, DC: Author.
- World Health Organisation. (2006). Guidelines for Drinking Water Quality: Incorporating first addendum (Vol. 1, Recommendations 2). Geneva: Author.
- Yadav, A., Rajhans, K. P., Ramteke, S., Sahu, B. L., Patel, K. S., & Blazhev, B. (2016). Contamination of industrial waste water in central India. Journal of Environmental Protection, 7, 72–81.10.4236/jep.2016.71007