
 ?Mathematical formulae have been encoded as MathML and are displayed in this HTML version using MathJax in order to improve their display. Uncheck the box to turn MathJax off. This feature requires Javascript. Click on a formula to zoom.
Abstract
Solid waste management remains a serious problem in most developing nations, even although it consumes a larger portion of the municipal budget. This article examines factors that might influence solid waste generation and solid waste management behavior of households in Bahir Dar city. Stratified and systematic random sampling techniques were employed to select 196 households for primary data collection. The data were subjected to both descriptive and econometric technique of analysis. Multiple linear regression analysis was used to identify households’ solid waste generation dominant factors. The result shows that mean weight waste generation by sample households was 0.22kg per capita per day (0.28kg in the core zone, 0.17kg in the outer zone and 0.20kg in the middle zone). About 112(57%) of the households are served by door-to-door solid waste collection service. Only 53(27%) households received solid waste management services by municipality waste collectors weekly but 18(9%), 29(15%), and 12(6%) households received solid waste management services within 15 days, 21 days and once in a month, respectively. About 84(43%) households never received solid waste collection, transportation and final disposal in to landfill services until this interview was made. Among the sample households, only 139(69%) of households having separate bins for storage of different types of waste and the remaining households do not have any separate bins. The multiple linear regression results showed that the quantity of solid waste generation of households in Bahir Dar city was significantly affected by household size and household aggregate income.
Public Interest Statement
Currently in Ethiopia, solid waste management is growing beyond the capacity of the municipal governors. The increasing volume of waste pushes a high demand on the waste retrieval services. These challenges are reflected in most cities of the country. Due to population growth and urbanization difficulties are created to respond to the required demand in waste management. Hence, the country (Ethiopia) has started to organize and participate in micro and small enterprises in solid waste management activities. Bahir Dar is a fast growing and center of tourism regional city in Ethiopia that also embarked on solid waste collection service through micro and small enterprises. They work in a public private partnership that aims solutions for solid waste collection and disposal. Since 2010, micro and small enterprises have delivered a waste collection, transportation and dispose in to landfill site services to the residential and commercial sites to minimize the problem. But still most residents dispose their waste on open spaces which may cause social, economic, political and environmental problems for living organisms.
1. Introduction
Economic growth in developing countries has led to the massive movements of people from rural areas to urban areas for searching better life (Lichter & Brown, Citation2011). As a result, the number of persons added to the urban population in developing countries increase challenges faced by governments, urban planners, non-governmental service providers and urban residents (Baqui, Citation2009). Due to this, there is increasing solid waste generation in urban centers (Alam & Ahmade, Citation2013). Solid waste is not only rising in quantity but also changing in composition (from less organic matter to more paper, packing materials, plastics, glass, metal and other substances), which is exacerbated by low collection rates (Solomon, Citation2011). A survey by the United States Agency for International Development (USAID) in 2009 purged the rate of solid waste generated in Africa at approximately 0.5 kg per person per day. From these only a small amount of these solid wastes are properly disposed of in designated landfills. The rest are either dumped openly without recourse to treatment systems or left in public dumpsters with no one to properly dispose them (Pradhan, Citation2009). To overcome these problems implementation of effective waste management practices has been identified as essential for economic development in low income countries in particular (Zerbock, Citation2003).
In developing countries, improper handling and disposal of solid wastes contribute to high level of mortality and morbidity even if produce less per capita solid waste (Medina, Citation2002), because of cities and municipalities cannot cope up with the accelerated rate of waste production and composition in terms of technology, institutional arrangement and cost effectiveness of solid waste management (Modak et al., Citation2010; Zurbrügg et al., Citation2004). Due to these, improper municipal solid waste disposal and management causes all types of pollution, i.e. air, soil and water pollution (Alam & Ahmade, Citation2013). This indicated that human health and ecosystem service is threatened by improper solid waste management system (Pradhan, Citation2009). Even though the overall goal of urban solid waste management is to collect, treat and dispose of solid waste generated by all urban dwellers, 30%–60% of all the urban solid wastes are uncollected, and less than 50% of the population is served (Monyoncho, Citation2013). As a result, inefficient municipal solid waste management system increase disease transmission, contaminate ground and surface water, create greenhouse gas emissions, damage ecosystem services, discourages tourism and other business activities (Alam & Ahmade, Citation2013; Chinasho, Citation2015; Ejaz et al., Citation2010; Fenta, Citation2017).
In line with this, solid waste management is becoming a major public health and environmental concern in urban areas of Ethiopia that only 2% of the population received solid waste collection, transportation and landfill disposal services (Kassa, Citation2010). Accordingly, Bahir Dar city is one of the highly expanding and rapidly growing cities in Ethiopia (Chinasho, Citation2015; Unep, Citation2010). With the current annual population growth rate of 6.6% continues, the city population will double within 11 years and increase pressure on municipal solid waste management in order to outbreak disease (Alam & Ahmade, Citation2013; Lohri et al., Citation2014). Thus the need for adequate solid waste management is unquestionable (Abate & Goshu, Citation2017; Lohri et al., Citation2014). A total of 98.8 tons per day solid waste was generated from Bahir Dar city. But the city municipality collects and disposes only 58% of the total municipal solid waste and the 42% disposed to the environment (Fikreyesus et al., Citation2011; Unep, Citation2010). This implies that small proportions of the urban dwellers are served and large quantity of solid waste left uncollected.
Only few studies in the area of solid waste management and generation are done in Bahir Dar city. Some of these studies include: “assessment of liquid waste management” (Fesseha, Citation2012); “Financial sustainability in municipal solid waste management cooperatives”(Lohri et al., Citation2014); “plastic bag waste generation rate”(Ababa, Citation2007); “sustainability of solid waste collection and transport services by micro and small enterprises”(Edmealem, Citation2003); “solid waste characterization and quantification for the development of an integrated solid waste management” (FFE, Citation2010; UNEP, Citation2010b), and “household demand for improved solid waste management services”(Endalew & Tassie, Citation2018). But such studies do not guarantee to discus households’ solid waste generation and management behavior in different zones in the study area.
2. Objectives
The general objective of this study was to estimate households’ solid waste generation and management behavior in the case of Bahir Dar city, Amhara National Regional state, Ethiopia and the following specific objectives:
To assess households solid waste generation and management behavior in the study area.
To identify the determinate factors of households’ quantity of solid waste generation in the case of Bahir Dar city.
3. Methodology
3.1. Study area description
Bahir Dar city is located in the north western part of Ethiopia as shown on the Figure , and is faster growing city in the country (UNEP, Citation2010a). It has a total population of 96,140 in 1994 and 230,344 in 2007 (CSA, Citation2007), and estimated 297,749 in 2014 (FFE, Citation2010). Currently the city is serving as a regional capital of Amhara National Regional State (ANRS) in the Federal Democratic Republic of Ethiopia. It has become one of the major tourist destinations of the country with a variety of attractions in the nearby Lake Tana (Ethiopia’s largest lake and famous for churches and monasteries on the lake’s 37 Islands) and Blue Nile river (FFE, Citation2010). A global position of the city is between 15.620 N latitude and 37.420 E longitude, and enjoys tropical type of climate with an average annual temperature of 19.60C and the average elevation of the city is estimated 1801 m above sea level.
Figure 1. Map of the study area.
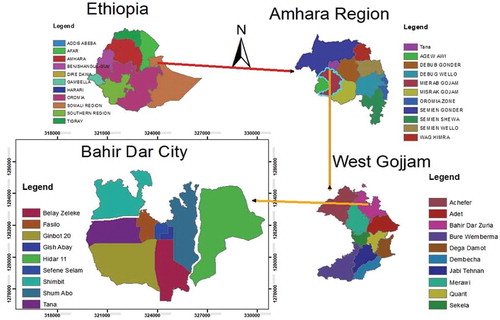
The city has expanded rapidly throughout the 20th century. Today, waste discharges into Lake Tana have become a serious and highly visible problem (FFE, Citation2010).
In Bahir Dar city, urbanization is increasing at an alarming rate (287,756) in 2014 and it is 301,425 in 2015) (CSA, Citation2007). It is putting immense pressure on municipal services. One of the problems of the urbanization and increasing population is the increased generation of waste (Table ). Solid waste generation per day continuously increase and estimated to be 212.2 tones solid waste will be generated in 2022, and which is greater than when it compared with Mekele and Awassa cities. Therefore, this calls for urgent need for an appropriate need of determinant factors of quantity solid waste generation by assessing households’ solid waste management behavior in Bahir Dar city.
3.2. Data sources
All required data were collected from both primary and secondary data sources. The study was conducted primary data sources from sample households using a structured questionnaire by applying face to face interview to reduce non response rate and incompleteness of data. Secondary data were collected from published and unpublished materials.
3.3. Sampling techniques and sample size
A researcher selected the study area purposely having the information from officials of city municipality office of ANRS (Appendix 1). The sample size would be determined by considering resource constraints & representativeness of sample. A list of households was generated from Kebelle administrations to form the sampling frame. The choice of sampling technique (probability or non-probability) depends on purpose of the study. So, the objective of this study is to estimate households’ solid waste generation and management behavior in the case of Bahir Dar city. For such a quantitative research, probability sampling technique is appropriate as compared to non-probability sampling technique because of it gives for every sample household equal chance of being interviewed.
3.3.1. First stage: selection of sample rural kebele administrations
The study area divided in to 17 administrative KebellesFootnote1 and after 2007 reforms these Kebelles arranged with a total of 52 zones (smallest legal administrative units). So, for the purpose of this study all zones categorized into three main groups, i.e. Core, Middle and Outer depending on population density, settlement, geographical location and land use pattern to make homogenous for primary data collection from sample units. Thus it employed a multi-stage sampling technique to make sample representative and reduce heterogeneity characteristics of study population, and to made conclusion and recommendation for study area population. To make the sample representative, sample zones were randomly from each stratum (i.e. core, middle and outer zones).
3.3.2. Second stage: selection of households
Sample households are the main primary data sources of this study. From the total of 5353 households of from six samples zones, a total of 196 households, which was proportionally allocated for the respective sample zones, were included in the sampling frame population (Table ). Then to maintain the representativeness of the study, respondents were picked systematically at a distance of every ith household/. Where, “N” is the total number HHs in the sampling frame list adopted from kebele administrative offices and “n” is the number of sample households determined by using scientific formula. A critical component of sample size formulas is the estimation of variance in the primary variables of interest in the study (Cochran, Citation2007). Two ways of estimating population variances for sample size determinations, (1) use pilot study results and (2) use data from previous studies of the same or a similar population. For categorical dependent variable, 5% margin of error is acceptable, and for continuous dependent variable 3% margin of error is acceptable (Krejcie & Morgan, Citation1970). The formula that we used for determining sample size is the following:
Table 1. Municipal solid waste generation projection per day of Bahir Dar city
Table 2. Summary of household sample size from each stratum
Where: n = sample size of housing units; Q = 1-P; N = Total numbers of housing units; P = residential housing unit variable; Q = housing units used for commercial activities, offices public centers, etc. Z = Standardized normal variable and valued that corresponds to 95% confidence interval equal to 1.96; d = Allowable error (0.05).
According to data obtained from city housing development office, there are total of 52,386 legal housing units (N): Out of these, more than 85% (P = 0.85) are residential and the rest 15% (Q = 0.15) are used for commercial activities, offices and for others (Report, Citation2017). Therefore, based on the above specified formula the required sample size becomes:
Therefore, n = 196 was the minimum sample size of households for reliable results. Finally, by using proportional allocation method the researcher was decided to take sample households from selected zones. These sample households was drawn for data collection using simple random sampling method.
3.4. Data collection method
The name and number of the household head was collected from the sample frame list of 2016 for 6 selected zones that government administrative offices used for distribution of basic consumption goods (sugar, palm oil, wheat flour, etc). After preparing the list of the household head sample households were selected randomly using the random Table. Two survey instruments were developed to gather the necessary information (i.e. checklist and questionnaire). The major objective of the checklist was to get a general overview of the existing solid waste management system in operation and also helped to identify problems related to solid waste management in the city. The questionnaire was finalized after a pre-test. To minimize strategic bias, an introductory statement was included for respondents. The questions were on demographic characteristics of the households, information on waste generation by types, waste disposal practices, and door-to-door collection systems, Family total income, sources of income, education level and possession of domestic amenities were also among the questions asked. The questions were filled by visiting the selected households door-to-door from September—October 2017. The households were visited twice to complete the questionnaire. On the first day socioeconomic information were collected and households requested to deposit the wastes in different plastic bags and the next day the wastes were weighted.
3.5. Data analysis methods
The data were entered in the computer and analyzed using different statistical tools. Data were grouped for the Core, Middle and Outer zones. Some of the information were analyzed using simple statistical tools such as mean, percentage and also analyzed econometrically by using STATA version 13. The multiple linear regression econometric models were used for the analysis of household solid waste generation determinant factors.
3.6. Determinant factors of households’ solid waste generation
This section, mainly discusses the empirical analysis of the relationships of quantity and composition of household solid waste to selected social and economic variables. The analysis is based on data for components of household wastes, by type of material judged having recycling potential.
3.6.1. Specification of econometric model
Households’ quantity of solid waste generation and composition will depend upon a number of important determinants factors. In this study HH’s quantity of waste generated is treated as the dependent variable, and it is taken as continuous variable. Normally, waste is a function of consumption. The relationship between waste and consumption activities may be expressed as (Richardson et al., Citation1978):
W = βC(2)
Where,
W = vector of components of solid waste
β = Vector of technical waste transformation coefficients relating the types and quantities of solid waste to each consumption activity
C = is a vector of consumption activities selected by the household.
Any particular waste may be generated by the consumption of more than one commodity. Here no attempt is made to identify the technical waste transformation coefficients associated with the individual products. It mainly tries to compare the relationship between different types of waste generation and socioeconomic variables affecting the quantity of waste generated.
The major determinants of household consumption activities are assumed to be household monthly total income (TOTI), size of the household (TOTPOP), educational status of the household (GRAD); and extra land area in the house compound (EXTLA), solid waste management services availability in the area (SER).
The choice of econometric model depends on the nature of the dependent variable, i.e. nominal, ordinal, interval and/ratio scale. Since the dependent variable quantity of waste generated per household per day (TOTW) is continuous, the appropriate econometric model is multiple linear regression models. The model specified as follows:
Where:
TOTW = quantity of waste per household per day (Kg)
TOTI = Monthly income of the household in Ethiopian Birr (EBR.)
TOTPOP = Household size (numbers of persons within family)
GRAD = Educational status (number of college graduates)
EXTLA = Extra land area within the compound of the selected household (ha.)
SER = solid waste management services availability in the area
AGE = age of the households(year)
Here household is assumed as a production unit producing solid wastes.
The hypothesis is as follows:
Increase in income (TOTI) is expected to increase the demand for convenience factors and services embodied in commodities. The sign of the coefficient is expected to be positive for total quantity of waste generated. Consumption increases as income increase and so does waste generated. (
Where C = household consumption, α = autonomous consumption, ɸ = slope of consumption function and Y = income).
A larger household size (TOTPOP) is expected to generate higher quantity of waste since more households are included in the unit; thus, the sign is also expected to be positive.
Educated household members (GRAD) work in the office and stay outside of the house for a long time. So the waste generation will be low. However, the generation of packing waste may be higher in case of a fully employed family as they have less time to prepare food. As such, they consume more packed food. So, number of educated households has positive relationship with total quantity of waste generated.
It is assumed that higher the extra land area within the compound (EXTLA) less the waste generated by the household. It is also assumed that the household with extra land area may dispose some of the waste in their land, which may not be counted in the total volume of waste generated. Thus extra land area and the total quantity of waste are inversely related and the sign of the coefficient of extra land area will be negative.
Solid waste management services availability (SER) in the area is expected to generate higher quantity of waste since the quantity of waste disposed properly by collectors in case they increase demand that results waste.
Age of households (AGE) is expected to have a positive relation with quantity of waste generated because when age increase consumption becomes so does due to demand increases.
4. Result and discussion
4.1. Households solid waste generation
The Table shows that average waste generation by households is 0.22kg/capita/day (0.28kg in the core zone, 0.17kg in the outer zone and 0.20kg in the middle zone). Waste generation is higher in the core zone and lower in the outer zone. This may be due to more economic activities such as trade and public services like transport are common in the core zone. In the core zone, people have no space even though they generate more wastes per household per day than other zones.
Table 3. Per capita waste generation by the households
From the above table, average waste generated/household/day in kilogram column (2) gains when total waste generated column (6) divided by the total number of sample (column (8)). The same way for each zones gaining average waste generated/day/household.
Table shows about the types and proportion of solid waste generated in the city. Kitchen waste is the dominate type of waste generated in the area and it accounts for nearly 82.2% of the total waste. Packing waste 9% is next to kitchen waste. Plastic waste is account 3.2%; whereas paper waste is 2.4% only. The remaining 3.2% are accounts other types of wastes, which include battery, dust, can, electronics wastes, etc. The type of waste generated across different zones are different because of factors might increase quantity of solid waste generated. In general 0.32 kg of solid waste and 4.5 kg waste was generated in minimum and maximum respectively. But there is a difference for each type of wastes generated in the city.
Table 4. Types of waste and their proportion in all zones
4.2. Existing waste management practices
4.2.1. Solid waste separation practice
Table shows solid waste separation practices of sample households. Some of solid wastes that are separated by households are agricultural waste and food wastes for the purpose of using it as home garden; grass, leaf, waste of sugarcane, waste of cattle’s (after dried by sun), wood scrap to use them as fuel and used papers are reused as toilet paper by family. As the researcher tried to observe households solid waste separation activities, only solid wastes that are sellable to quraleos,Footnote2 exchangeable to liwachFootnote3 and to some extent organic wastes. Among the sample households, only 61(31%) of the households reported having separate bins for storage of different types of waste and the remaining households do not have any separate bins. Among the zones the households having separate bins is the highest 37(61%) in the middle zone, lowest 11(18%) in the outer zone and moderate 13(21%) in core zone.
Table 5. Separation practices of the households
From the survey result presented in the Table , 45(23%) of households have been done solid waste separation practice. Out of the total sample, 151(77%) households did not practice solid waste separation because of different reasons in the study area. Some of these are, lack of spaces, cannot see the importance, cannot afford separated bins, separation consuming time, no ready market for recyclables’ materials, etc. The separation practice is highest in the middle zone 22(49%), moderate in the core zone 15(33%) and lowest in the outer zone 8(18%).
4.2.2. Door-to-Door collection
About 112(57%) of the households are served by the door-to-door solid collection, transportation and final landfill disposal services. The majority of them receive this service by paying the fee and few are receiving the service not because of the fee but because of the location of their house along the road. Municipal solid waste collectors provide the service without receiving any bonus since they are the employees of the municipality. Door to door solid waste collection system of the city is insignificant both in spatial coverage and efficiency.
The perception of the households towards the present collection system was also captured through the questionnaire. The cleanliness of environment of an area depends on the regularity in the collection of waste by the municipality.
As expected the majority of respondents are not satisfied with the existing solid waste management in Bahir Dar city. Table shows that most households 158(80.6%) were not satisfied with the present door-to-door collection system. Only 38(19.4%) households were satisfied and also that households who gates solid waste management services are not satisfied by the current solid waste management services. Only 18(9%) households feel that the disposal of such collected waste is environmentally safe, 51(26%) households feel that the disposal of such collected waste is not environmentally safe, and the remaining 127(64.8%) households could not explain whether it is environmentally safe or not. Table also shows the zone-wise details regarding the knowledge on the disposal of the collected waste. The percentage of unsatisfied households is higher in the middle zone relative to the core and outer zones. This may related with spatial coverage of service provision of the municipality who gives more focus for core and in some extent middle zones of the city because of its economic activities related to transport, trade and other public services.
Table 6. Door-to-door collection and disposal of waste
4.2.3. Waste collection and collectors
Table shows the detail regarding the waste collection and collectors in the study area. Among the sample zones, municipal collectors collect solid waste from resident households from door-to-door collection by using hand carts and the collect one site which is called collection site for transportation purpose to land fill site. A city municipality gives responsibility for small scale enterprises to collect, transport and disposes into landfill. But these enterprises hire labor because of the volume and composition of waste increase over time due to population, urbanization, economic activities and other factors.
Table 7. Waste collectors and collection frequency
Ethiopia has Environmental policy and solid waste management proclamation, SWM proclamation (No. 513/Citation2007). The bases for the Environmental Policy of Ethiopia (EPE, Citation1998) are articles 92.1 and 92.2 of the constitution of the Federal Democratic Republic of Ethiopia (FDRE). These articles enshrine the following rights: Article 92.1“government shall endeavor to ensure that all Ethiopians live in a clean and healthy environment” and Article 92.2 “government and citizens shall have the duty to protect the environment. Some of the articles of the EPE directly or indirectly address solid waste management issues. However the regional state has not yet proclaimed any law or act on environmental issues. It is rather using the federal laws but facing difficulty on enforcement and monitoring at regional level (FFE, Citation2010). Even though there are laws and regulations at federal level and also applied by the regional state, their implementations and enforcements are very weak.
As we explained above the municipality planed to provide services for resident once per week in regular by small scale enterprises and dream light Plc. But the result shows only 53(27%) households received solid waste management services weekly. While 18(9%) households, 29(15%) households, 12(6%) households received solid waste management services within 15 days, 21 days and once in a month, respectively, and 84(43%) residents never received solid waste collection, transportation and final disposal in to landfill services until this interview was made. These indicate a huge faillarity of environment protection from pollution. In general solid waste management services provided by the municipality waste collectors is not fair even in waste management frequency.
4.2.4. Solid waste management methods when no service supply
Table shows the detail regarding management practices of sample households. Households that are not received door-to-door collection are managing their waste in different ways. The only solid waste disposal option of household is restricted to two choices. The first one is simply burning, burying, or dumping of solid waste in their compounds. While the second option is throwing of solid waste at roadsides, open fields, nearby rivers, bridges and gullies. Even households who received solid waste management services practice illegal wastes disposal because of they did not get the services up on the plan of the municipality (once a week for residents; per day for star hotels; and per 3 days for cafe and restaurants). Hence in order to assess the routine method of solid waste disposal practices of households and to know the destination of uncollected solid wastes, the researchers asked sample respondents about their common disposal system.
Table 8. Waste management in households, which have no Door-to-Door collection system
From the total sample, 130(66.3%) households practice illegal solid waste disposal, and only the rest 63(32.1%) households wait until solid waste collectors come. This indicates even households who receive service from the municipality disposed wastes illegally. It has been observed and concluded that still open dumping of waste is the most prevailing activity practiced by residents of Bahir Dar city and these makes high probability of environmental pollution, breeding grounds of insects, pests and infectious diseases and also produce toxic gases, which spread odor around the dumping places and block drainage channels.
From Table , it is clear that 48(25%) of households practiced burning of the waste to get exonerate the collected waste and 22(11%) of households practice burry inside the compound and simply dispose the waste in the compound. Such practice poses high risk on the local environment. These result shows even households who have been get such solid waste management services from municipality practice illegal solid waste disposal because of service provision period with in long period interval and irregular.
Table also shows the zone-wise details regarding residents’ solid waste management methods. The percentage of waste throwing into the road is higher in the core zone relative to them middle and outer zones. This may related with absence of open spaces and rivers for waste disposal options. When we seen throwing waste in to the river outer zones is higher than other zones.
It has been observed and concluded that still open dumping of waste is the most prevailing activity practiced by residents of Bahir Dar city and these makes high probability of environmental pollution, breeding grounds of insects, pests and infectious diseases and also produce toxic gases, which spread odor around the dumping places and block drainage channels. Therefore, the participation of the whole community in the municipal solid waste management program of the city is very essential and highly expected to bring changes on the existing low status of municipal solid waste management.
4.2.5. Econometric results
The estimation result of waste generation and socioeconomic model has been shown in Table . It mainly tries to compare the relationship between households’ quantity of solid waste generation and socioeconomic variables affecting the quantity of waste. Econometric analysis may provide better information and clearer focus on the factors that affect households quantity of solid waste generation responses such that policy recommendations can be made based on result conclusions. Before estimation was done, data exploration is an important step.
Table 9. Factors affecting households’ solid waste generation
To start with, to check whether multicollinearity is present or not a simple correlation coefficient matrix was conveyed. Multicollinearity is a serious problem when correlation coefficient is 0.8 and above (VIF exceeds 10) which is based on rule of thumb (Gujarati & Porter, Citation1999). There is no problem of multicollinearity (VIF = 2.7). The goodness of fit for the model has been tested in this study with some diagnostic tests which fulfill the following criteria of good results. First, the a R2 value (which is a measure of goodness of fit of the estimated regression model) of 0.51 depicts a good fitting of the model, which defines that 51% of the variation in change of the waste generation of the households could be explained by the independent variables in the model. The F-test shows that the estimated regression is quite meaningful in the sense that the dependent variable is related to each of the specified explanatory variables. The linear relation of the model is highly significant (the p value for the F-test is less than 0.0001). Second, the signs for the estimated coefficients are consistent.
This study result shows that income and household size were positive and highly significant. The positive coefficient on income variable (TOTI) at 5 percent level of significance, indicates that holding all other variables constant, higher income people are generating more waste than the lower income people. The positive relationship between these two variables is generally supported by the previous literature (ining and Ebreo, Citation1992; Mohai, Citation1985; Owens et al., Citation2000). This result seems reasonable since increase in income is expected to increase the demand for convenience factors and services embodied in commodities. The positive coefficient on households size, at 5 percent level of significance, indicates that holding all other variables constant, large family are generating more waste than the small family. A larger household size is expected to generate higher quantity of waste since more households are included in the unit; thus, the sign is also expected to be positive. The coefficient of education variable is positive but it is not significant. This related with educated households have an opportunity to leave more time out of home for field work. This result supported by, a number of other studies found that the effect is positive but statistically not significant (ining and Ebreo, Citation1992., Rafia et al., Citation2008; Owens et al., Citation2000.). Extra land area has positive but insignificant effect is consistent with (Owens et al., Citation2000) . In the study area, there are very few households with extra land area; because of urbanization growth, high population density and have high economic value of houses in the city.
The regression coefficient of the household size is higher relative to the coefficient of the total income in all the zones except middle zone. However, the coefficient of income is higher than the coefficient of the household size in the middle zone. Extra land area has positive but insignificant effect in all the zones. A variable family size is significant in both core and middle zones but not in the outer zone. Level of education is significant and has a negative effect on quantity of waste generated only in the core zone.
5. Conclusion and recommendation
Households in the study area do not receive adequate solid waste management services and they are adversely affected by improper solid waste collection. The per capita waste generation was 0.22 kg/person/day in all the zones of the city. The per capita waste generation is found to be the lowest in the outer zone and highest in the core zone. Thus, the low per capita waste generation in the outer zone may be due to the household sorting of waste more intensively in the outer zone than in other zones. Most households feel that the lack of stiff penalty and non-execution of law is the basic problem for the effective management of waste. Thus, provision of strong penalties and effective execution of the law will be the major tool to reduce the problem of solid waste management in Bahir Dar city. It is found that environmental awareness is very low among the residents of the city. Thus, stringent regulations with environmental awareness programs for household sorting and composting can reduce the volume and quantity of waste for land filling. The waste component relationship shows that size of the household and income are the major factor determining the total quantity of the waste in all the zones. It was also found that education has a negative effect on waste generation. Based on our research findings, the following points are recommended:
There is no any type Biogas plants used by many factories in and around Bahir Dar city to generate electricity from solid wastes generated from resident households. Government could make it mandatory for factories/poultries/farms generating a certain amount of solid waste to have biogas plants. Certain tax incentives could also be given to those complying with these new regulations.
The study also revealed a strong positive relationship between household family size and quantity of waste generated. It is recommended that measures be embarked upon to encourage people especially the younger generation who are yet to have children of their own to have smaller family sizes rather than larger ones.
As pointed out several times in the discussion above the present solid waste management system in Bahir Dar city is less than adequate. Organizational strengthening, better management of the conservancy section would certainly help to change this gloomy condition of solid waste management and bring it to acceptable standards. Manpower, number of vehicles, tricycles and rickshaw vans could be increased.
Competing interests
The author declares no competing interests.
Citation information
Cite this article as: Households solid waste generation and management behavior in case of Bahir Dar City, Amhara National Regional State, Ethiopia, Kassahun Tassie Wegedie, Cogent Environmental Science (2018), 4: 1471025.
Cover image
Source: Author.
Additional information
Funding
Notes on contributors

Kassahun Tassie Wegedie
Kassahun Tassie Wegedie holds bachelor’s degree in natural resource Economics and management/NREM/from Mekelle University, Ethiopia in July/2010. After this he was done in different agriculture and trade development and regulation offices in Amhara National Region State. After two years experience he got in country scholarship in Bahir Dar University and now he holds masters degree in developmental economics in October/2016. The author joined Department of Agricultural Economics in Agriculture and Environmental Sciences College of Bahir Dar University since 2016. Economic valuation, food security, livelihood analysis, impact analysis, choice experiment, poverty analysis and determinates of adoption are the author’s interest areas of research.
Notes
1. “Kebele” refers a legal administrative area includes different smaller administrative areas such as zones which is the lowest legal administrative area.
2. “Quraleos”- persons who practice exchange of recycled wastes in other goods .
3. “Liwach”- exchange recycled solid waste in terms of goods used for different purposes.
References
- Ababa, A. (2007). Ayana yehuala, Addis Ababa University.
- Abate, B., & Goshu, G. (2017). Waste management in lake tana basin—Case of rapidly urbanizing Bahir Dar City. In Social and ecological system dynamics (Vol. 6, pp. 581–18). Siena: Springer.
- Alam, P., & Ahmade, K. (2013). Impact of solid waste on health and the environment. International Journal of Sustainable Development and Green Economics (IJSDGE), 2(1), 165–168.
- Bahir Dar city office report (2017). Bahir Dar city house construction and development office annual report of 2008/2009 fiscal year.
- Baqui, A. (2009). Global urbanization: Trends, patterns, determinants, and impacts. Maryland: Bloomberg Publishing.
- Chinasho, A. (2015). Review on community based municipal solid waste management and its implication for climate change mitigation. American Journal of Scientific and Industrial Research, 6(3), 41–46.
- Cochran, W. G. (2007). Sampling techniques. John Wiley & Sons.
- CSA. (2007). (Central Statistical Authority of Ethiopia) Summery and statistical report of the population and housing censes result of Ethiopia.
- Edmealem, B. (2003). Assessment of the sustainability of solid waste collection and transport services by MSEs, in the case of Bahir Dar city, Ethiopia.
- Ejaz, N., Akhtar, N., Hashmi, H., & Naeem, U. A. (2010). Environmental impacts of improper solid waste management in developing countries: A case study of Rawalpindi city. The Sustainable World, 379–388.
- Endalew, B., & Tassie, K. (2018). Urban households’ demand for improved solid waste management service in Bahir Dar city: A contingent valuation study. Cogent Environmental Science, 4, 1426160.
- EPE. (1998). Environmental policy of Ethiopia.
- Fenta, B. A. (2017). Waste management in the case of Bahir Dar City near Lake Tana shore in Northwestern Ethiopia: A review. African Journal of Environmental Science and Technology, 11(8), 393–412.
- Fesseha, H. M. (2012). Liquid waste management: The case of Bahir Dar, Ethiopia. Ethiopian Journal of Health Development, 26(1), 49–53.
- FFE. (2010). “Forum for environment assessment of solid waste management system of Bahir Dar city, for the development of an ISWM Plan.
- Fikreyesus, D., Mika, T., Getane, G., Bayu, N., & Mahlet, E. (2011). Ethiopia solid waste and landfill: Country profile and action plan. Community Development Research Sponsored by Global Methane Initiative. Retrieved from https://www.globalmethane.org/documents/landfills
- Gujarati, D. N., & Porter, D. C. (1999). Essentials of econometrics application 5th edition.
- Ining and Ebreo. (1992). Predicting recycling behavior from global and specific environmental attitudes and changes in recycling opportunities. Journal of Applied Social. Psychology, World Resources Institute, United Nations, 22, 1580–1607.
- Kassa, Z. (2010). The challenges of solid waste management in urban areas, the case of Debre markos town. Ethiopia: Addis Ababa University.
- Krejcie, R. V, & Morgan, D. W. (1970). Determining sample size for research activities. Educational and Psychological Measurement, 30(3), 607-610.
- Lichter, D. T., & Brown, D. L. (2011). Rural America in an urban society: Changing spatial and social boundaries. Annual Review of Sociology, 37, 565–592.
- Lohri, C. R., Camenzind, E. J., Zurbrügg, C. (2014). Financial sustainability in municipal solid waste management–Costs and revenues in Bahir Dar, Ethiopia. Waste Management, 34(2), 542–552.
- Medina, M. (2002). Globalization, development, and municipal solid waste management in third world cities. Institute of Advance Studies, Mexico, 1–23.
- Modak, P., Jiemian, Y., Hongyuan, Y., Mohanty, C.R. (2010). Municipal solid waste management: Turning waste into resources. Shanghai Manual–A Guide for Sustainable Urban Development in the 21st Century.
- Mohai, P. (1985). Public concern and elite involvement in environmental conservation issues. Social Science, 66, 820–838.
- Monyoncho, G. (2013). Solid waste management in urban areas Kenya: A case study of Lamu town. Department of Real Estate and Construction Management, University of Nairobi, Kenya.
- Owens, J., Dickerson, S., Macintosh, D. L. (2000). Demographic covariates of residential recycling efficiency. Environment and Behavior, 32, 637–650.
- Pradhan, U. M. (2009). Sustainable solid waste management in a mountain ecosystem. Darjeeling, West Bengal, India.
- Rafia A., Hanaki, K., Kurisu, K. H. (2008). Factors affecting waste generation and willingness to recycle: A study in a waste management program in Dhaka city, Bangladesh.
- Richardson, A., & Havlicek Jr, R. J. (1978). Economic analysis of the composition of household solid wastes. Journal of Environmental Economics and Mangement, 5, 103–111.
- Solomon, C. (2011). Assessment of municipal solid waste management service in Dessie town.
- SWM proclamation (513/2007). Ethiopia has Environmental policy and solid waste management proclamation.
- Tegegne, G. (1999). Willingness-to-pay for environmental protection: An application of contingent valuation method (CVM) in Sekota district, northern Ethiopia. Ethiopian Journal of Agricultural Economics, 2, 1.
- UNEP. (2010a). Assessment of the solid waste management system in Bahir Dar Town and the Gaps identified for the Development of an ISWM Plan.
- UNEP. (2010b). Solid waste characterization and quantification of Bahir Dar City for the development of an integrated solid waste management Plan.
- Unep, J. (2010). Assessment of the solid waste management system in Bahir Dar town and the gaps identified for the development of an ISWM plan. Forum for Environment.
- Zerbock, O. (2003). Urban solid waste management, waste reduction in developing countries. USA: School of Forest Resource and Environmental Science, Michigan Technological University.
- Zurbrügg, C., Drescher, S., Patel, A., Sharatchandra, H. C. (2004). Decentralised composting of urban waste – An overview of community and private initiatives in Indian cities. Waste Management, 24(7), 655–662.
Appendix 1
Bahir Dar city was purposively selected for this research for the following reasons
Bahir Dar is one of faster growing; and commercial, social and trade activities taking place cities in the country where solid waste problem has an increasing trend because of factors which increase composition and volume of waste in the city. These include unplanned construction of houses, uncontrolled location of industries and factories, rapid population growth caused by natural increase and migration from rural and other urban areas, and most importantly, of course, is the inability of the government to find efficient ways to manage and finance environment needs of the people.
There is no background information about determinant factors of households’ solid waste generation and management behavior in the study area. This will help the service providers, i.e., the municipality to understand households’ solid management behavior to get better solid waste management services.
Bahir Dar is the capital city of Amhara regional state with a total population of 220,344 and an annual growth rate of 6.6% (CSA, 2007), with more people migrates to Bahir Dar city from rural areas in all directions, and these increases pressure to manage waste effectively in order to avoid outbreaks of disease (Tegegne, Citation1999). Thus, the need for adequate solid waste management system is unquestionable.
Since the city has different historical places in the nearby Lake Tana and Blue Nile River (locally called Abay), many tourists make a tour to this place. Therefore, it is required to manage solid wastes generated from the city in order to make ‘green and clean’ city so as to attract and extend tourists period of duration.