
 ?Mathematical formulae have been encoded as MathML and are displayed in this HTML version using MathJax in order to improve their display. Uncheck the box to turn MathJax off. This feature requires Javascript. Click on a formula to zoom.
Abstract
This present study is aimed at evaluating the level of environmental degradation and potential ecological risk in soils around an active (tantalum-niobium) mining site of Iludun-Oro, southwestern Nigeria. A total of 18 topsoil samples were randomly collected from different parts of the study area and analysed using the inductively coupled plasma-mass spectrophotometry. The concentrations of Pb, Zn, Fe, Cu, Cr and Ni varied between 0–678, 7–222, 1.64–8.87, 8.8–145, 1.4–81 and 1.6–93.1 ppm, respectively, with an average concentration of 107.72, 48.17, 5.17, 45.28, 14.76 and 21.53 ppm, respectively. The order of abundance of these heavy metals analysed in the soils is as follows: Pb > Zn> Cu> Ni> Cr> Fe. The concentration values of Pb, Fe, Cu, Ba and Sr are higher than the background values indicating that mining activities have an adverse impact on the study area.
On accessing the soil quality in the study area, the results of the geo-accumulation, contamination factor (CF) and pollution load indices (PLIs) indicated high concentrations of Pb in the soils. Likewise, most of the Igeo values reported uncontaminated to moderately contaminated for all elements except for Pb. This study has further provided the background information for a vulnerability assessment of the study area as well as for future impact assessment and proper planning of the mining site. These findings have provided useful information for making appropriate environmental management strategies to mitigate the influence of heavy metal pollution generated from an active mining site in Nigeria and other similar areas.
PUBLIC INTEREST STATEMENT
The impacts of mining activities through the expulsion of mine wastes pose a serious threat to human life, vegetation and animals across the globe. This perspective research describes some of the distribution of these heavy metals, their pollution level, ecological threat and potential sources of these hazardous metals around an active mining site in southwestern Nigeria. It was found that these metals range from moderately contaminated to contaminated for most of the elements. The presence of these toxic elements has adverse effects on the immediate environment. Understanding these effects can provide useful information for appropriate environmental laws and mitigate the influence of pollution on the environment in this study area and other similar places.
Competing Interest
The authors declare no competing interests.
1. Introduction
The discoveries and exploitation of natural and mineral resources in Nigeria and Africa as a whole have led to the development of the most sectors of their economy and their people’s livelihood (Boakye, Dessus, Foday, & Oppong, Citation2012; Fayiga, Ipinmoroti, & Chirenje, Citation2017; Wilson, Wang, Kabenge, & Qi, Citation2017). The exploitation of these resources (gold, copper, tin, tantalum, columbite, niobium, natural oil and gas) has negatively impacted the environment. Several factors such as population growth, urbanization, mining, agricultural activities, and industrialization have contributed to the present pollution in the world. These global trends in environmental pollution possess a challenge, but the levels of these contaminations vary in different parts of the world, especially in developing economies.
The environmental impacts of mining activities have similar effects worldwide. These effects on the environment are determined by the chemical attributes of the ore, the method of extraction and the environmental conditions (Adriano, Citation2001; Higueras et al., Citation2004; Hsu et al., Citation2016; Khan, Yusoff, Bakar, Bakar, & Alias, Citation2016; Lupankwa, Love, Mapani, Mseka, & Meck, Citation2006; Mierzwa‐Hersztek, Gondek, Klimkowicz‐Pawlas, Baran, & Bajda, Citation2018; Oelofse, Citation2009; Potra, Dodd, & Ruhl, Citation2017; Yan, Liu, Zhong, Guo, & Wu, Citation2018). The mobility and bioavailability of these elevated heavy metals in the environment primarily depend on some physicochemical characteristics of the depositional environment such as pH, textural characteristics, organic matter content, speciation or chemical form, and electrical conductivity (Adewuyi & Osobamiro, Citation2016; Chukwu, Citation2011; Equeenuddin, Tripathy, Sahoo, & Panigrahi, Citation2013; Lu, Liu, Wang, & Wu, Citation2017; Sarapulova, Dampilova, Bardamova, Doroshkevich, & Smirnova, Citation2017; Zhang, You, & Hu, Citation2016). Higher concentrations of heavy metals in soils have been documented at a variety of sites associated with Pb–Zn mining in the southeast Missouri, USA (Potra et al., Citation2017). These have adverse effects on the floristic quality where no other human activities are obvious. Trace elements’ (As, Cu, Zn and Pb) concentration has also been documented around a gold mine in Ghana (Antwi-Agyei, Hogarh, & Foli, Citation2009) with As concentrations in soils significantly higher than the Netherlands intervention value of 55 mgkg−1. An anomalous abundance of rare earth elements in surface soils has also been reported in Bayan Obo Mine that was influenced by the exploitation of these minerals around the mining site (Wang & Liang, Citation2016).
The natural soil is not only a geochemical habitat for the contaminants, but also serves as a natural buffer for transportation of elements in the air, water, and biomass (Benhaddya & Hadjel, Citation2014; Nsenga Kumwimba et al., Citation2017; Wang, Deng, Yin, & Tang, Citation2018). Due to the high elevated values of heavy metals in soils, they have posed an adverse effect on human health and aquatic environment, which can be easily inhaled into human bodies from suspended dust or by uptake in plants (Benson, Anake, Adedapo, Fred-Ahmadu, & Ayejuyo, Citation2017; Jan et al., Citation2015; Madrid, Dı́az-Barrientos, & Madrid, Citation2002; Mortazavi, Mortazavi, & Paknahad, Citation2016; Wang & Yong, Citation2005). Mining activities, as the hazardous sources of toxic elements, relatively affect localized areas. The tailings, gangue minerals and subsequent smelting operations have caused noticeably significant environmental concerns (Mwesigye, Young, Bailey, & Tumwebaze, Citation2016; Okang’Odumo et al., Citation2014). The fine-grained particles of mine tailings or the ore may be blown or diffused into adjacent areas. Acid-mine drainage contamination has been reported in the Abuja leather mine in Komu, southwest Nigeria (Oyebamiji, Odebunmi, Ruizhong, & Rasool, Citation2017), which has led to the contamination of nearby aquatic habitats.
Previous studies on the distribution of these heavy metals in our immediate environments have not only become a local phenomenon, but also a global one as well (Harikrishnan et al., Citation2017). Hence, geochemical studies of the mining sites using sample media like soils, stream sediments and waters are fundamental in determining the dispersion pattern of these trace elements.
In order to better understand the pollution level, ecological risk level and potential sources of heavy metals in soils of Iludun-Oro mining district, the main objectives of this study were to: (i) determine the spatial distribution of heavy metals in soils; (ii) identify their sources by using the principal component analysis (PCA); (iii) assess the contamination level using various risk assessment indices such as; CF, geoaccumulation index (Igeo), degree of contamination (CD), PLI, ecological risk index (ERI) and potential ecological risk index (PERI).
2. Materials and methods
2.1. Study area
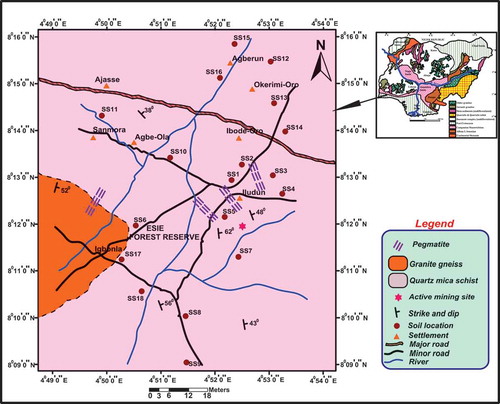
The Iludun-Oro mining district is located in the southwestern part of Nigeria, lies between longitude 08°09ʹ00”N to 08°16ʹ00”N and latitude 004°49ʹ00”E to 004°54ʹ00”E and extends 12.5 km from east to west and 15.8 km from south to north. The study area is surrounded by several towns namely Okerimi-Oro, Agberun, Ajasse, Sanmora, Agbe-Ola, Ibode-Oro and Igbonla (Figure ). This district is well accessible with the presence of major and minor roads created by miners and farmers during their quest to find means of livelihood. The study area is located within the tropical rainforest belt characterized by an alternation of dry and wet seasons. The rainy season runs from April through October when the effect of the southwest monsoon wind overwhelms that of the northeast trade wind, which commonly causes dry seasons from November to April. The wet season is characterized by heavy rainfall with corresponding low temperatures whilst the dry season comes with high temperature and little or no rain. Annual rainfall varies from 1150 mm to 2000 mm in the northern and southern areas, respectively. Annual mean temperature ranges from 21 to 29°C whilst the relative humidity ranges from 27.5 to 98.2% (Ogunrayi, Akinseye, Goldberg, & Bernhofer, Citation2016). The soil types mainly include reddish-brown and brown-black loam. Land use is predominantly controlled by agriculture and mining activities. The elevation of the study area varies from 90 to 165 m above sea level as shown in Figure . The peak of the elevation is located on the north-west flank of the study area. The area is drained by several tributaries of river running in the north-south direction. The geology of the study area is underlain by the Precambrian basement complex rocks, younger granite of Jurassic age, and the Cretaceous to Recent sediments (Obaje, Citation2009). The study area is one of the major production sites for tantalite, tin, niobium, columbite and gemstones, which are mined from mineralized pegmatite veins hosted within the quartz-mica schist and granite gneiss (Figure ). These pegmatites occur as coarse-grained rocks and mainly trend in the NNW-SSE direction.
Figure 1. Location map of the study area showing sampling points.
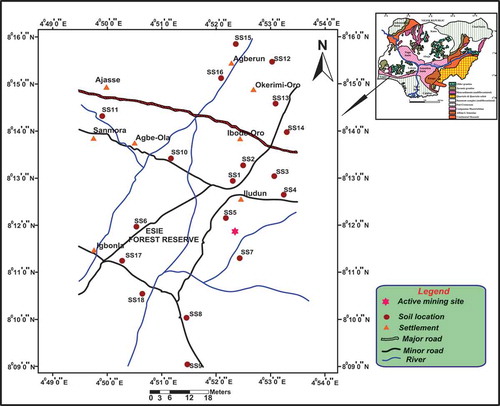
Figure 2. Geomorphological view of the study area showing the peaks and nadirs above sea level.
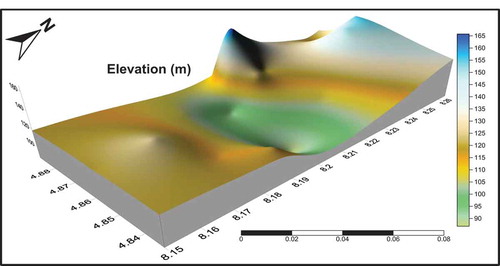
Figure 3. Location map showing sampling pattern superimposed on the geologic map.
2.2. Sample collection and preparation
In this study, a total of 18 topsoil samples (0–20 cm) were randomly collected from the different parts of the study area. Composite samples were also collected in dug pits at a depth interval of 1 m, 2 m, and 3 m. These samples were carefully collected; freshly accumulated soils were avoided. A representative soil sample about 1 kg was subjected to pulverization, air-dried and later passed through a 200-mesh nylon sieve to remove unwanted materials. Proper delineation of the mining sites was done during the reconnaissance survey, which was followed by a systematic sampling pattern. The coordinates of the sample location were recorded with the aid of a GPS. All collected samples were stored in a clean polythene bags to avoid contamination before the laboratory analysis.
2.3. Sample analysis procedure and accuracy
The dried fine-grained soil particles were digested in aqua regia using a mixture of 25% HNO3 and 75% HCl. After a near-total absorption by hydrofluoric-perchloric acid, the major and trace elements were analysed using the inductively coupled plasma-mass spectrophotometry (ICP-MS) in a certified commercial laboratory in Canada (Bureau Veritas Mineral Laboratories). The accuracy of the analytical methods was monitored by the repeated analysis of a standard reference material done together with a batch of soil samples according to the technique of Dulski (Citation2001). These data give satisfactory results, with accuracy values within ± 1–10% for various elements. The recovery rate for the analysis ranges from 95 to 110%. The minimum detection limits for Fe, Pb, Zn, Cu, Cr, Ni, Ba, Sr, Th, Nb, Zr, Y, Sc and Mn were 0.04, 0.1, 1.0, 0.1, 0.1, 0.1, 1.0, 0.5, 0.2, 0.1, 0.1, 0.1, 1.0 and 0.01, respectively.
2.4. Statistical analysis and spatial distribution maps
PCA was used to distinguish the different groups of heavy metals and classify heavy metals from different sources based on similarities in their chemistry. The location and spatial distribution maps of heavy metals were produced with the method of kriging interpolation technique using the software package SURFER version 15.0 (Golden Software Inc., CO, USA).
2.5. Methods of heavy metal pollution assessment
2.5.1. Contamination factor (CF)
CF is a quantitative evaluation of the level of contamination and sources of pollution. The CF makes use of conservative elements as the reference element (Cabrera, Clemente, Barrientos, López, & Murillo, Citation1999). CF is expressed as follows:
where Ci is the content of metal i instead of mean content from at least five sample sites; Cri is the reference value, baseline level of metal i. The degree of heavy metal pollution of CF is divided into four classes.
2.5.2. Geoaccumulation index (Igeo)
Igeo index as depicted by Eq. (ii) is used to classify identification of environmental influences by anthropogenic activities, also used to quantify the extent of heavy metal contamination associated with soils. Igeo is expressed as follows (Vural, Citation2015; Zhao, Feng, Yang, Niu, & Shen, Citation2012):
where Cn is the measured concentration of metal n, Bn is the geochemical background value and constant 1.5 is used to represent the natural fluctuations and minor anthropogenic influences. The Igeo was distinguished into seven classes.
2.5.3. Contamination degree (CD)
This is expressed by the summation of all the CFs for each metal in the sequence. CD is expressed as follows:
where n is the number of metals, i is the baseline level of the metal and Cf is the CF. The CD is divided into four classes.
2.5.4. Pollution load index (PLI)
PLI is used to determine the magnitude of heavy metal contamination in soils. It is a potent tool in heavy metal pollution evaluation (Tomlinson, Wilson, Harris, & Jeffrey, Citation1980). The PLIs are calculated for all the metals. PLI is expressed as follows:
where Cf1 is the CF and n is the number of metals. The degree of heavy metal risk assessed by PLI is mainly divided into three classes (Chakravarty & Patgiri, Citation2009).
2.5.5. Ecological risk index (ERI)
The ERI is used to evaluate heavy metal pollution in soil to associate ecological and environmental effects with their toxicology and the toxic-response factor (Tri) of Cu, Zn, Cd, Cr, Ni and Pb is 5, 1, 30, 2, 5 and 5 (µg/g), respectively (Hakanson, Citation1980). ERI is expressed as follows:
where is the toxic-response factor for a given substance and Cfi is the CF. The degree of heavy metal risk assessed by ERI is mainly divided into five classes.
2.5.6. Potential ecological risk index (PERI)
PERI is employed to determine the semi-quantitative evaluation of regional pollution level. It can be expressed as follows (Wang et al., Citation2015):
where is the ecological risk factor of element i. The degree of heavy metal assessment by PERI is categorized into four classes.
3. Results and discussion
3.1. Heavy metals concentration in soils
The statistics of heavy metals are presented in Table . Concentrations of Pb, Zn, Cu, Cr, Ni, Ba, Sr, Th, Zr, Y, Sc and Mn in the soils, as well as the background values of heavy and trace metals, are presented. The concentrations of Pb, Zn, Fe, Cu, Cr and Ni varied between 0–678, 7–222, 1.64–8.87, 8.8–145, 1.4–81 and 1.6–93.1 ppm, respectively, with average concentrations of 107.72, 48.17, 5.17, 45.28, 14.76 and 21.53 ppm, respectively. The order of abundance of these heavy metals analysed in the soils followed this pattern Pb > Zn> Cu> Ni> Cr> Fe. The values of Pb, Fe, Cu, Ba and Sr are higher than the background values (samples collected 3.5 km away from the mining site) indicating that mining activities had influence in the study area. The concentrations of Pb, Cu, Ba, Sr, Nb and Zr varied greatly across the study area. Mn is relatively low and slightly homogenous in all the soil samples analysed. The coefficient of variation (CV) is a measure of relative variability and used to compare the degree of variation from one data series to another. Fe, Th and Zr had the lowest CV of 42.9, 42.25, and 48.93%, respectively, followed by Cu, Mn and Y having CVs of 86.15, 80 and 67.67%, respectively. Pb, Zn, Cr, Ni, Ba, Sr and Nb had their CV more than 90% (161.64, 130.97, 126.15, 146.37, 156.43 and 180.52%, respectively). This indicates that the (CV < 90%) values of heavy metals are dominated by anthropogenic sources are generally high compared to (CV > 90%) dominated by geogenic sources. Several other factors could be responsible for the large coefficient variation across the study area and these might include the following: sampling methods, sample preparation methods and analytical techniques. However, these variations could be further separated into direct and indirect contributions to the total variation with the use of PCA. Therefore, Pb, Zn, Cr, Ni, Ba, Sr and Nb concentrations in the soil samples tend to be high and introduced by anthropogenic activities whilst Fe, Th and Zr are associated with natural sources. The high concentration of Pb, Cu and Sr (Table ) in the soisls posed a serious threat to vegetation and animal rearing and ultimately affecting the overall quality of human health through consumption. Moderately high concentrations of Fe, Zn, Cu and Cr indicate an evidence of leaching of mine waste under acidic conditions. In general, different sample points showed varied soil heavy metal concentrations, indicating influence of human activities from mineral exploitation and processing.
Table 1. The summary of chemical parameters of the soil samples of the study area
Table 2. Geochemical data of selected elements in the soil samples of the study area
3.2. Spatial distribution of heavy metals
The spatial distribution of heavy metals concentrations is a veritable tool used to access the possible sources of enrichment and identify likely hotspot regions with high metal concentration (Li, Lu, Zhang, Liu, & Hou, Citation2008). In this study, the concentration variability maps of Zn, Pb, Ni, Mn, Fe, Cu, Cr and Sr were made with the method of kriging interpolation using the Surfer (version 15.0) software package. The spatial distribution maps of the study area are presented in Figure . The distribution patterns of Zn, Ni, Mn, Fe, Cu, Cr and Sr were decreasing in concentrations away from the active mining site to the adjacent non-active mining region. They peaked close to the mining site.
Figure 4. a-h: Spatial distribution maps of Zn, Pb, Ni, Mn, Fe, Cu, Cr and Sr in study area.
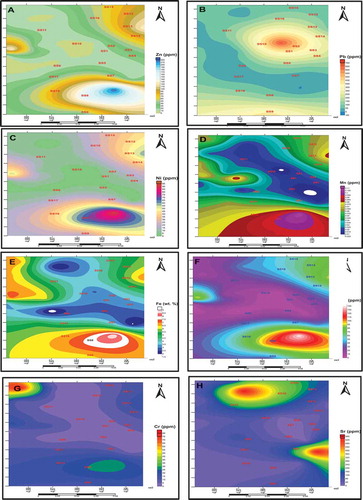
The spatial distribution of Zn, Ni, Mn and Cu vary slightly from other metals. They peaked at two points located in the northwestern part of the study area, associated with increased agricultural activities and high traffic density. The second peak is located in the southeastern part of the study area, related to the presence of active mining of tantalum-niobium concentrates. Pb distribution across the study area showed high spatial variability. Only one hotspot is visible, and it is located close to the central area of the study area around the mines. The spatial distribution of Fe is quite different from other heavy metals. A single peak around the mine with relatively low spatial variability is shown. The mean concentration is comparable to the background value, suggesting that Fe concentrations in the soils have not been altered by anthropogenic activities. The spatial distribution of Cr showed relatively low spatial variability across the study area. A single hotspot is shown at the extreme northwestern region indicating the presence of intense agricultural activities. Cr may also be inputted into the soil by the parent material.
Also, the spatial distribution of Sr concentrations showed very high spatial variability with two distinct peaks around the mining area and the agricultural land space. The mean concentrations of Sr are higher compared with the background values, suggesting that Sr concentrations in the soils of the study area have been affected by anthropogenic activities or derived mainly due to the input of weathered parent material.
3.3. Indices of pollution assessment
3.3.1. Assessment using CF, CD, Igeo and PLI
Based on the monitoring data of soil quality in the study area, a quantitative analysis of heavy metal pollution assessment around the tantalum-niobium mining area was undertaken to determine the environmental effects. The evaluation was done using the CF and geoaccumulation index as presented in Tables and .
Table 3. Contamination factor for metals in the soil samples of the study area
Table 4. Geoaccumulation index for metals in the soil samples of the study area
The CF was calculated by comparing the observed heavy metal concentration with the background values for soil taken in an undisturbed location about 3.5 km away from the mining site. The CF values followed the descending sequence: Pb > Sr> Cu> Fe> Sc> Ba> Nb> Ni> Y> Cr> Zn> Zr> Th (Figure ). Pb and Sr had the higher CF values of 35.68 ± 0.1 and 9.05 ± 0.05, indicating that the soils were considerably contaminated to highly contaminated. The values of the CF of various trace and heavy metals in the soils are summarized in Table is as follows; Zn (0.10–3.08), Cu (0.43–5.00), Cr (0.08–4.50), Ni (0.07–3.88), Ba (0.11–5.27), Th (0.16–0.80), Nb (0.19–1.11), Zr (0.15–1.19), Y (0.24–2.16), Sc (0.46–2.77) and Fe (0.40–2.18). The values derived from these metals indicate that their mode of occurrence was a natural process (geogenic). Zn, Cu, Cr, Ni and Ba showed low-to-considerable CF (Cf < 1: 3 ≤ Cf < 6), whilst Th, Nb, Zr, Y, Sc and Fe showed low-to-moderate CF (Cf < 1: 1 ≤ Cf < 3) as presented in Table .
Table 5. Summary of the pollution indices calculated for the study area
Figure 5. Indices of CF for metals in soil samples of the study area.
The Igeo values for each heavy metals are Pb (−1.25 to 4.57), Zn (−3.32 to 1.62), Cu (−2.32 to 2.59), Cr (−4.32 to 1.58), Ni (−4.64 to 1,37), Ba (−3.84 to 1.82), Sr (−2.40 to 2.59), Th (−3.32 to −0.92), Nb (−2.94 to 2.37), Zr (−3.32 to −0.32), Y (−2.64 to 0.53), Sc (−1.69 to 0.89) and Fe (−1.69 to 0.55). The Igeo values followed the descending order: Pb > Cu> Fe> Sc> Sr> Y> Nb> Zr> Ba> Zn> Th> Cr> Ni (Figure ). Most of the values indicate uncontaminated to moderately contaminated, except for Pb that indicates uncontaminated to heavily contaminated. Based on the average values, the soils of the study area are mostly slightly contaminated by almost all elements and more pronounced for Pb. Zn, Cu, Cr, Ni and Ba showed uncontaminated (Igeo < 0) to moderately contaminated (1 < Igeo < 2) of the class 1 order. Also, Th, Nb, Zr, Y, Sc and Fe showed uncontaminated (Igeo < 0) to moderately contaminated (1 < Igeo< 2) of the class 2 order (Table ).
Figure 6. Indices of geoaccumulation for metals in soil samples of the study area.
The degree of contamination, which is expressed by the summation of all the CFs for each metal, varies from moderate degree of contamination to very high degree of contamination; indicating an alarming anthropogenic influence. Zn, Cr, Ni, Ba, Nb, Y, Sc and Fe showed a considerable degree of contamination for all the soil samples, whilst Pb, Cu and Sr indicate a very high degree of contamination depicting alarming anthropogenic input due to mining activities and increased agricultural activities.
The values of the PLI in Table were found to be generally (<1) in most of the sampled points except for three sites which is slightly higher than 1. The PLI provides a simple, comparative means to determine the magnitude of heavy metals in a site. A value of PLI = 0 indicates perfection, PLI = 1 indicates only baseline levels of pollutants, whilst PLI > 1 indicates progressive deterioration of site (Chakravarty & Patgiri, Citation2009).
3.3.2. Assessment using potential ecological risk
The PERI was introduced to determine the semi-quantitative evaluation of regional pollution level (Wang et al., Citation2015), according to the toxicity of heavy metals and the response of the environment. Based on the standardized heavy metal toxic factor expressed by Hakanson (Citation1980), the toxic response factor (Tri) of Cu, Zn, Cd, Cr, Ni and Pb is 5, 1, 30, 2, 5 and 5 (μg/g), respectively. The ecological risk indices of Pb (0–178.4), Zn (0.1–3.08), Cu (1.5–18.45), Ni (0.6–13.6) and Cr (0.16–9.0) with an average of 28.35, 0.67, 7.81, 4.49 and 1.64, respectively, in all the sampling sites indicate low risk (Eri < 30). The highest ecological risk can be found in two sites with values (120, 178.4) indicating high risk. The main donation of the potential ecological risk comes from Pb, which indicates a significantly high risk with a value greater than 440.
3.4. Multivariate analysis
3.4.1. Pearson’s correlation analysis
Pearson’s correlation coefficient of heavy metals in the soil samples is presented in Table . There are varying levels of correlation between the metals in the soils. The inter-elemental relationship in the soils suggests different geochemical pathways are responsible for the metal concentration. A positive correlation between heavy metals suggests that these metals have common sources, mutual dependence and identical behaviour during transport. On the other hand, negative correlations suggest that they do not share the previously mentioned metal traits with each other. The results showed a strong correlation between Cu–Zn, Ni–Zn, Ni–Cu, Sr–Ba, Y–Cu, Sc–Zn, Sc–Cu, Sc–Ni, Sc–Y, Fe–Zn, Fe–Cu, Fe–Ni, Fe–Sc, Mn–Zn, Mn–Cu, Mn–Ni, Mn–Y, Mn–Sc and Mn–Fe. This may indicate that elements have similar sources of input or are precipitated in the same media. Pb, Th and Nb correlate negatively with other elements indicating that they originated from different or mixed sources. These diverse sources can be; gangue minerals, atmospheric deposition, community sewage system, use of pesticide and fertilizers amongst others.
Table 6. Results of Pearson’s correlation matrix for soil samples
3.4.2. Identification of source
Using the multivariate statistical analysis, PCA can be used to identify the sources of pollution (Zheng-Qi, Shi-Jun, Xian-Guo, & Cheng-Jiang, Citation2008). The results of PCA for heavy metals concentration are presented in Table . Two rotated principal components (PCs) with eigenvalues of 6.401 and 2.859 accounted for 66.14% of the total variance (Figure ). These results showed two component models for all the data variation. PC1 accounted for 45.72% of the total variance with strong loadings of Zn and Cu (0.781 and 0.873, respectively), supported by the strong correlations between Zn and Cu (Table ) and their low Igeo and CF values. Hence, they may be contributed by geogenic sources. Coefficients of PC1 are supported by moderate loadings of Ni, Y, Sc, Fe and Mn (0.586, 0.635, 0.687, 0.629 and 0.643, respectively). These metals are siderophilic (having a strong affinity for metallic phase and usually depleted in the silicate portion of the earth) and were correlated well with one another.
Table 7. The result of principal component analysis for soils
Figure 7. Rotated principal components binary plot for PC1 and PC2.
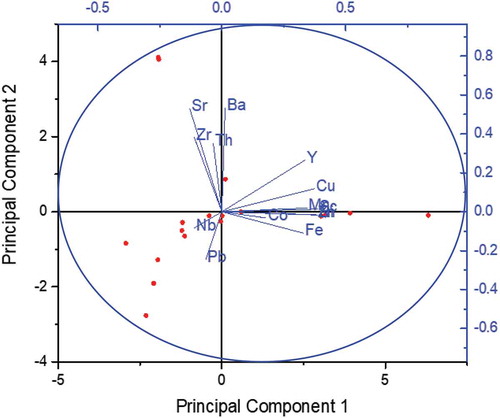
The second principal component (PC2) accounted for 20.42% of the total variance with moderate loadings of Ba and Sr. This is further supported by weak correlation of Ba and Sr with other elements. Pb was equivocally different in the two-rotated component matrix; this is supported by the negative correlation of Pb with other elements. Pb average was 5.6-fold higher than the background value, indicating that it was inputted by anthropogenic activities. This was further supported by its high Igeo and CF values.
4. Conclusions
Different veritable tools, methods and indices were employed for the contamination assessment of soils heavy metals and trace elements in a typical active mining site of Iludun-Oro and its environs, southwestern Nigeria. This study was aimed at determining the spatial variances of heavy metals and identifying the pollution level, ecological risk level and potential sources of heavy metals in the soils. A total of 18 topsoil samples were randomly collected across different part of the study area and analysed using the ICP-MS. The concentrations of Pb, Zn, Fe, Cu, Cr and Ni varied between 0–678, 7–222, 1.64–8.87, 8.8–145, 1.4–81 and 1.6–93.1 ppm, respectively, with an average concentration of 107.72, 48.17, 5.17, 45.28. 14.76 and 21.53 ppm, respectively. The sequence of occurrence of these heavy metals analysed in the soils followed this pattern Pb > Zn> Cu> Ni> Cr> Fe. The values of Pb, Fe, Cu, Ba and Sr are higher than the background values indicating that mining activities influenced the study area. Pb, Zn, Cr, Ni, Ba, Sr and Nb had their CV more than 90% (161.64, 130.97, 126.15, 146.37, 156.43 and 180.52%, respectively). This indicates that the (CV < 90%) values of heavy metals are dominated by anthropogenic sources are high compared to (CV > 90%) dominated by geogenic sources.
Results of the spatial distribution maps and multivariate statistical analysis of the heavy metals showed that mining activities, atmospheric deposition, poor community sewage system, and the use of pesticide and fertilizers represented the most important sources of heavy metal pollution. Accessing the soil quality in the study area, the results of the geoaccumulation, CF and PLIs indicated high concentrations of Pb in the soils of Iludun-Oro. Also, most of the values indicated uncontaminated to moderately contaminated for all elements except for Pb. This research suggested that the lessening of anthropogenic sources in the study area should be considered in further future control measures. Our study highpoints that multiple indices provide more reasonable assessments, which will be considered in the future studies on soils with heavy metals.
Conclusively, this paper has provided background information for a vulnerability assessment of the study area as well as for future impact assessment and proper planning of the mining site. Besides, this study would recommend a remediation plan for analysis of the quality of drinking water and soil quality for crop production in the study area. To sum up, there is the need for implementation and enforcement of environmental laws, which may be an aid to pollution control around the mining sites.
Authors’ contributions
All the authors contributed equally to the preparation of this manuscript. All authors read and approved the final manuscript.
Compliance with ethical standards
Yes
Additional information
Funding
Notes on contributors
Abiola Oyebamiji
The authors are a group of multidisciplinary scientific researchers, actively involved in the study of the ecological and geochemical study of the environments, most importantly the distribution and monitoring of elevated levels of heavy metals in soils, rocks, waters and vegetation. Their current study focuses on the assessment of heavy metals around an active mining site, its potential effects on human health using multiple indices. It provides background information for a vulnerability evaluation of the study area and recommends remediation plans for the control.
References
- Adewuyi, G. O., & Osobamiro, M. T. (2016). Chemical speciation and potential mobility of some toxic metals in tropical agricultural soil. Research Journal of Environmental Toxicology, 10, 159–165. doi:10.3923/rjet.2016.159.165
- Adriano, D. C. (2001). Trace elements in terrestrial environments biogeochemistry bioavailability and risk of metals (Vol. 2, 2nd ed., pp. 61–89). NewYork: Springer.
- Antwi-Agyei, P., Hogarh, J. N., & Foli, G. (2009). Trace elements contamination of soils around gold mine tailings dams at Obuasi, Ghana. African Journal of Environmental Science and Technology, 3(11), 353-359.
- Benhaddya, M. L., & Hadjel, M. (2014). Spatial distribution and contamination assessment of heavy metals in surface soils of Hassi Messaoud, Algeria. Environmental Earth Sciences, 71(3), 1473–1486. doi:10.1007/s12665-013-2552-3
- Benson, N. U., Anake, W. U., Adedapo, A. E., Fred-Ahmadu, O. H., & Ayejuyo, O. O. (2017). Toxic metals in cigarettes and human health risk assessment associated with inhalation exposure. Environmental Monitoring and Assessment, 189(12), 619. doi:10.1007/s10661-017-6348-x
- Boakye, D., Dessus, S., Foday, Y., & Oppong, F. (2012). Investing mineral wealth in development assets. Ghana: Liberia and Sierra Leone.
- Cabrera, F., Clemente, L., Barrientos, E. D., López, R., & Murillo, J. M. (1999). Heavy metal pollution of soils affected by the Guadiamar toxic flood. Science of the Total Environment, 242(1–3), 117–129.
- Chakravarty, M., & Patgiri, A. D. (2009). Metal pollution assessment in sediments of the Dikrong River, NE India. Journal of Human Ecology, 27(1), 63–67. doi:10.1080/09709274.2009.11906193
- Chukwu, E. (2011). Small scale mining and heavy metals pollution of agricultural soils: The case of Ishiagu Mining District, South Eastern Nigeria. Journal of Geology and Mining Research, 3(4), 87–104.
- Dulski, P. (2001). Reference materials for geochemical studies: New analytical data by ICP‐MS and critical discussion of reference values. Geostandards and Geoanalytical Research, 25(1), 87–125. doi:10.1111/ggr.2001.25.issue-1
- Equeenuddin, S. M., Tripathy, S., Sahoo, P. K., & Panigrahi, M. K. (2013). Metal behavior in sediment associated with acid mine drainage stream: Role of pH. Journal of Geochemical Exploration, 124, 230–237. doi:10.1016/j.gexplo.2012.10.010
- Fayiga, A. O., Ipinmoroti, M. O., & Chirenje, T. (2017). Environmental pollution in Africa. Environment, Development and Sustainability, 20(1), 1–33.
- Hakanson, L. (1980). An ecological risk index for aquatic pollution control. A sedimentological approach. Water Research, 14(8), 975–1001. doi:10.1016/00431354(80)90143-8
- Harikrishnan, N., Ravisankar, R., Chandrasekaran, A., Gandhi, M. S., Kanagasabapathy, K. V., Prasad, M. V. R., & Satapathy, K. K. (2017). Assessment of heavy metal contamination in marine sediments of east coast of Tamil Nadu affected by different pollution sources. Marine Pollution Bulletin, 121(1–2), 418–424. doi:10.1016/j.marpolbul.2017.05.047
- Higueras, P., Oyarzun, R., Oyarzún, J., Maturana, H., Lillo, J., & Morata, D. (2004). Environmental assessment of copper-gold–Mercury mining in the Andacollo and Punitaqui districts, northern Chile. Applied Geochemistry, 19(11), 1855–1864. doi:10.1016/j.apgeochem.2004.04.001
- Hsu, L. C., Huang, C. Y., Chuang, Y. H., Chen, H. W., Chan, Y. T., Teah, H. Y., … Tzou, Y. M. (2016). Accumulation of heavy metals and trace elements in fluvial sediments received effluents from traditional and semiconductor industries. Scientific Reports, 6, 34250. doi:10.1038/srep3425
- Jan, A. T., Azam, M., Siddiqui, K., Ali, A., Choi, I., & Haq, Q. M. R. (2015). Heavy metals and human health: Mechanistic insight into toxicity and counter defense system of antioxidants. International Journal of Molecular Sciences, 16(12), 29592–29630. doi:10.3390/ijms161226183
- Khan, A. M., Yusoff, I., Bakar, N. K. A., Bakar, A. F. A., & Alias, Y. (2016). Assessing anthropogenic levels, speciation, and potential mobility of rare earth elements (REEs) in ex-tin mining area. Environmental Science and Pollution Research, 23(24), 25039–25055. doi:10.1007/s11356-016-7641-x
- Li, C., Lu, F. Y., Zhang, Y., Liu, T. W., & Hou, W. (2008). Spatial distribution characteristics of heavy metals in street dust in Shenyang city. Ecology Environment, 17(2), 560–564.
- Lu, L., Liu, G., Wang, J., & Wu, Y. (2017). Bioavailability and mobility of heavy metals in soil in vicinity of a coal mine from Huaibei, China. Human and Ecological Risk Assessment: an International Journal, 23(5), 1164–1177. doi:10.1080/10807039.2017.1308816
- Lupankwa, K., Love, D., Mapani, B., Mseka, S., & Meck, M. (2006). Influence of the Trojan Nickel Mine on surface water quality, Mazowe valley, Zimbabwe: Runoff chemistry and acid generation potential of waste rock. Physics and Chemistry of the Earth, Parts A/B/C, 31(15–16), 789–796. doi:10.1016/j.pce.2006.08.030
- Madrid, L., Dı́az-Barrientos, E., & Madrid, F. (2002). Distribution of heavy metal contents of urban soils in parks of Seville. Chemosphere, 49(10), 1301–1308.
- Mierzwa‐Hersztek, M., Gondek, K., Klimkowicz‐Pawlas, A., Baran, A., & Bajda, T. (2018). Sewage sludge biochars management—Ecotoxicity, mobility of heavy metals, and soil microbial biomass. Environmental Toxicology and Chemistry, 37(4), 1197–1207. doi:10.1002/etc.4045
- Mortazavi, S. M. J., Mortazavi, G., & Paknahad, M. (2016). Levels of arsenic, mercury, cadmium, copper, lead, zinc, and manganese in serum and whole blood of resident adults from mining and non-mining communities in Ghana. Environmental Science and Pollution Research International, 23(21), 22220. doi:10.1007/s11356-016-7697-7
- Mwesigye, A. R., Young, S. D., Bailey, E. H., & Tumwebaze, S. B. (2016). Population exposure to trace elements in the Kilembe copper mine area, Western Uganda: A pilot study. Science of the Total Environment, 573, 366–375. doi:10.1016/j.scitotenv.2016.08.125
- Nsenga Kumwimba, M., Zhu, B., Dong, Z., Tang, J., Wang, T., Xiao, L., & Kavidia Muyembe, D. (2017). Assessing nutrient, biomass, and sediment transport of drainage ditches in the Three Gorges Reservoir Area. CLEAN–Soil, Air, Water, 45(1). doi:10.1002/clean.201501012
- Obaje, N. G. (2009). Geology and mineral resources of Nigeria (Vol. 120). Springer. doi:10.1007/978-3-540-92685-6_1
- Oelofse, S. H. (2009). Mine water pollution-acid mine decant, effluent and treatment: A consideration of key emerging issues that may impact the state of the environment. Department of Environmental Affairs & Tourism. The Icfai University Press.
- Ogunrayi, O. A., Akinseye, F. M., Goldberg, V., & Bernhofer, C. (2016). Descriptive analysis of rainfall and temperature trends over Akure, Nigeria. Journal of Geography and Regional Planning, 9(11), 195–202. doi:10.5897/JGRP2016.0583
- Okang’Odumo, B., Carbonell, G., Angeyo, H. K., Patel, J. P., Torrijos, M., & Martín, J. A. R. (2014). Impact of gold mining associated with mercury contamination in soil, biota sediments and tailings in Kenya. Environmental Science and Pollution Research, 21(21), 12426–12435. doi:10.1007/s11356-014-3190-3
- Oyebamiji, A., Odebunmi, A., Ruizhong, H., & Rasool, A. (2017). Assessment of trace metals contamination in stream sediments and soils in Abuja leather mining, southwestern Nigeria. Acta Geochimica, 1–22. doi:10.1007/s11631-017-0256-1
- Potra, A., Dodd, J. W., & Ruhl, L. S. (2017). Distribution of trace elements and Pb isotopes in stream sediments of the Tri-State mining district (Oklahoma, Kansas, and Missouri), USA. Applied Geochemistry, 82, 25–37. doi:10.1016/j.apgeochem.2017.05.005
- Sarapulova, A., Dampilova, B. V., Bardamova, I., Doroshkevich, S. G., & Smirnova, O. (2017). Heavy metals mobility associated with the molybdenum mining-concentration complex in the Buryatia Republic, Germany. Environmental Science and Pollution Research, 24(12), 11090–11100. doi:10.1007/s11356-016-8105-z
- Tomlinson, D. L., Wilson, J. G., Harris, C. R., & Jeffrey, D. W. (1980). Problems in the assessment of heavy-metal levels in estuaries and the formation of a pollution index. Helgoländer meeresuntersuchungen, 33(1), 566. doi:10.1007/BF02414780
- Vural, A. (2015). Contamination assessment of heavy metals associated with an alteration area: Demirören Gumushane, NE Turkey. Journal of the Geological Society of India, 86(2), 215–222. doi:10.1007/s12594-015-0301-9
- Wang, L., & Liang, T. (2016). Anomalous abundance and redistribution patterns of rare earth elements in soils of a mining area in Inner Mongolia, China. Environmental Science and Pollution Research, 23(11), 11330–11338. doi:10.1007/s11356-016-6351-8
- Wang, X., Deng, C., Yin, J., & Tang, X. (2018). Toxic heavy metal contamination assessment and speciation in sugarcane soil. IOP Conference Series: Earth and Environmental Science, 108(4), 042059. IOP Publishing. doi:10.1088/1755-1315/108/4/042059
- Wang, X. S., & Yong, Q. I. N. (2005). Correlation between magnetic susceptibility and heavy metals in urban topsoil: A case study from the city of Xuzhou, China. Environmental Geology, 49(1), 10–18. doi:10.1007/s00254-005-0015-1
- Wang, Z., Wang, Y., Chen, L., Yan, C., Yan, Y., & Chi, Q. (2015). Assessment of metal contamination in coastal sediments of the Maluan Bay (China) using geochemical indices and multivariate statistical approaches. Marine Pollution Bulletin, 99(1–2), 43–53. doi:10.1016/j.marpolbul.2015.07.064
- Wilson, S. T., Wang, H., Kabenge, M., & Qi, X. (2017). The mining sector of Liberia: Current practices and environmental challenges. Environmental Science and Pollution Research, 24(23), 18711–18720. doi:10.1007/s11356-017-9647-4
- Yan, X., Liu, M., Zhong, J., Guo, J., & Wu, W. (2018). How human activities affect heavy metal contamination of soil and sediment in a long-term reclaimed area of the Liaohe River Delta, North China. Sustainability, 10(2), 338. doi:10.3390/su10020338
- Zhang, W., You, M., & Hu, Y. (2016). The distribution and accumulation characteristics of heavy metals in soil and plant from Huainan coalfield, China. Environmental Progress & Sustainable Energy, 35(4), 1098–1104. doi:10.1002/ep.12336
- Zhao, S., Feng, C., Yang, Y., Niu, J., & Shen, Z. (2012). Risk assessment of sedimentary metals in the Yangtze Estuary: New evidence of the relationships between two typical index methods. Journal of Hazardous Materials, 241, 164–172. doi:10.1016/j.jhazmat.2012.09.023
- Zheng-Qi, X., Shi-Jun, N., Xian-Guo, T., & Cheng-Jiang, Z. (2008). Calculation of heavy metals’ toxicity coefficient in the evaluation of potential ecological risk index [J]. Environmental Science & Technology, 2(8), 31.