
 ?Mathematical formulae have been encoded as MathML and are displayed in this HTML version using MathJax in order to improve their display. Uncheck the box to turn MathJax off. This feature requires Javascript. Click on a formula to zoom.
Abstract
A narrative linking women and vulnerability has been overarching in vulnerability literature. However, this narrative has not been empirically proven aside from generalizations based on poverty-gender linkages. This study used primary data collected in 2016 from 735 randomly selected households in Eastern Uganda to construct a gender vulnerability index based on the livelihood vulnerability framework to determine the most vulnerable gender differentiated households. The results showed that single male-headed households were the most vulnerable to climate change, even worse than single female-headed households. Mixed gender households showed lowest vulnerability. Presence of a female spouse reduced the vulnerability of the traditionally “male headed” households. The results suggest that disparity in access to requisite resources mediates vulnerability among groups of households. It is concluded that the straight assumption that vulnerability is associated with female-headed households is misleading and could disenfranchise some male-headed households that are more vulnerable.
PUBLIC INTEREST STATEMENT
Identifying the most vulnerable sections of society is important in informing climate change adaptation policy. An assertion that women are more vulnerable to climate change has often been alluded to in climate change adaptation literature. In this paper, we interrogate the assertion that women are more vulnerable to climate change and that female-headed households are particularly disadvantaged using data from Eastern Uganda, our research demonstrates that over emphasizing that women are more vulnerable to climate change may disenfranchise some men or could fail to recognize the moderate status of certain women. Our results suggest that gender stereotypes can be counterproductive when identifying the most vulnerable people for adaptation planning.
Competing Interests
The authors declare no competing interests.
1. Introduction
Even the best efforts at mitigating climate change will fall short of stemming climate change due to historical emissions (Pielke, Prins, Rayner, & Sarewitz, Citation2007). This realization has shifted emphasis toward enabling societies to cope with the new biophysical conditions caused by climate change. The need to identify who will be most affected by climate change in planning for climate change responses cannot be overemphasized (Holand, Citation2014; Holand, Lujala, & Rød, Citation2011; O’Brien, Eriksen, Schjolden, & Nygaard, Citation2004). Those individuals, households, communities or countries likely to be most affected are considered vulnerable. Vulnerability here implies the degree of susceptibility to harm from a natural hazard (Lewis, Citation1999). But to identify the most vulnerable entities requires that vulnerability is measured in ways that make comparison of different contextual groups possible.
Different conceptualizations of vulnerability have been suggested (see Ribot, Citation2010). Following the integrative approach, vulnerability depends on both biophysical and human elements of a system. Society mediates climate vulnerability by deliberate action or unavoidable inaction to adjust their livelihoods. The resultant vulnerability is thus a function of not only the level of environmental stimuli but also the pre-existing economic, cultural and social situation that would make some sections of society fail to make the necessary adjustments to shield themselves from the climate stress. In fact according to Holand et al. (Citation2011), vulnerability is inherent to a system even before a potential threat. The integrative approach captures the connection between people and the biophysical environment by highlighting the fact that observed vulnerability is ultimately the interaction between the physical phenomenon and the human context within which it occurs (Vincent & Cull, Citation2010). Like Kousky and Cooke (Citation2009) noted, climate change does not occur in a vacuum. It is an additional constraint to already existing risks to livelihoods like poverty and gender inequality (Cannon, Citation2002). Climate change will lead to even more livelihood vulnerability as it places additional hardship on people who aspire to maintain their livelihoods.
Social vulnerability expresses the totality of factors that make people more susceptible to harm from specific threats. These factors can be external and/or internal characteristics of a person or group that influence their capacity to anticipate, cope with, resist and recover from the impact of a natural hazard (Blaikie, Cannon, Davis, & Wisner, Citation1994). Social vulnerability intricately connects to entitlements and endowment of people, by focusing on the need to have the requisite resources to cope with climate-related stress as a major driver for vulnerability rather than the magnitude of the stress itself. Social vulnerability in a common-sensical way highlights the role of gender in determining vulnerability and specifically suggests that women are more vulnerable since they are poorer than men (Arora-Jonsson, Citation2011; Rahman, Citation2013) because of low economic opportunities (Johnsson-Latham, Citation2007; O’Sullivan, Rao, Banerjee, Gulati, & Vinez, Citation2014). Since vulnerability to climate change is transformed into differentiated outcomes via social structure (Ribot, Citation2010), it is expected to reflect differently on female and male-headed households due to disparity of heads of households in access to resources needed to safeguard their livelihoods from climate-related stress (Sharmin & Islam, Citation2013).
This study investigates the a priori determination that female-headed households are by implication more vulnerable to climate change (see Waite, Citation2000) and assesses whether blanket statements about gender and vulnerability may disenfranchise even more vulnerable groups of people. The assertion that women are more vulnerable to climate change may be less definitive due to the heterogeneity of women. For instance, the marital status of a woman can have mediating effects on access to resources which would increase adaptive capacity. Misconstruing vulnerability as being linked with women has the undesirable consequence that vulnerability is thought to be confined to female-headed households and overlooks the situation of certain kinds of male-headed households. It also obfuscates the agency, knowledge and resilience of women (Dankelman, Citation2010), as they become the subject of study instead of contributors to knowledge. The objective of this study was to interrogate the gender stereotypes in climate change vulnerability particularly regarding the assertion that women are more vulnerable to climate change using gender differentiated household data collected from four districts in Eastern Uganda. It is anticipated that such a research is imperative in identifying the most vulnerable households to climate change, but could help to illuminate the merit in generalizations regarding gender and vulnerability.
2. Methodology
2.1. Description of the study area
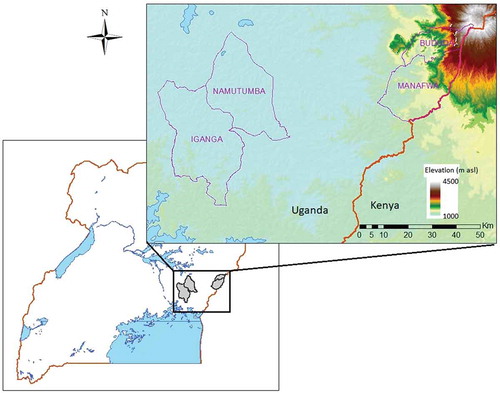
The study was conducted in four districts in Eastern Uganda (Figure ). Bududa and Manafwa (elevation of >1300 m above sea level) have wet tropical climate (Vlaeminck et al., Citation2016) with temperatures ranging from 18°C to 22°C (BDPU, Citation2012). They receive bimodal rainfall regime of approximately 1500–2000 mm pa with peaks in April–May and August–September (Kitutu, Poesen, & Deckers, Citation2011; Mbogga, Citation2012). Iganga and Namutumba are located at lower elevation (<1100 m above sea level) and have warm humid climate with mean temperature of 23°C and annual precipitation of 900–1200 mm over two rain seasons in March–May and August–October. Bududa and Manafwa have experienced heavy rainfall events in the last 10 years the worst being in 2010 which caused the infamous Bududa landslide (Staudt, Kuosmanen, Babirye, & Lugaizi, Citation2014). Majority of farmers in Bududa and Manafwa practice a predominantly coffee-banana system but also grow other bi-annuals and annuals like beans, maize and sweet potatoes. In Namutumba and Iganga, the major crops grown include maize, cassava and beans and sweet potatoes (UBOS, Citation2010). Like other parts of Uganda, the major livelihood activity is farming for both cash and subsistence using low input practices that make people very sensitive to climatic changes even over a short period of time.
Figure 1. Map of Uganda showing the location of the four districts in Eastern Uganda.
2.2. Research design
The study followed a cross-sectional research design. A descriptive cross-sectional household survey of 735 households was conducted during the first season of 2016 cropping year. The survey employed a 21-page pre-tested questionnaire administered in the local languages (Lusoga in Iganga and Namutumba or Lumasaba in Bududa and Manafwa) through a local translator. In the survey, farmers were asked questions about their perceptions on long-term (5–30 years) climatic changes based on temperature and precipitation patterns in the area. The household survey also collected data on socio demographics, asset ownership, livelihood activities, crops grown and the observed climate change impacts.
2.3. Sampling and subject selection
The districts were purposely selected to cover areas that have reported heavy rainfall and drought associated with climate change. Selection of respondents was done using multi-stage sampling with subcounty and household selection at different stages. At the first stage, a list of sub counties was acquired from a contact person at each of the four districts. From this list, eight sub counties were randomly selected (two from each District). The sub counties selected were Bukaye and Namungalwe in Iganga, Namutumba and Magada in Namutumba, Nalondo and Khabutoore in Manafwa and Bushika and Nakatisi in Bududa. For each of the sub counties selected, a local contact person was identified with the help of the district production office. The local person generated a list of households in any two adjacent villages. Respondents were selected from adjacent villages for logistical purposes to reduce the travel time for the respondents. Each household was given a number. The household list comprised the sampling frame from which a random sample was drawn by use of a table of random numbers. Where a sampled household could not be located, the nearest house was chosen to replace it. About 50 farm households were sampled from each village.
3. Constructing an index of vulnerability to climate change
Vulnerability to climate change comprises of both internal and external factors to a system. Accordingly, mere presence of a risk (e.g. high intensity rainfall and drought) does not imply vulnerability of the system but rather the potential for perturbation. Vulnerability occurs when the system cannot cope with the new set of biophysical conditions to maintain a given prior standard. The vulnerability of a system or group is ultimately driven by the intensity of the hazard (exposure), factors that predispose the group to climate hazards (sensitivity) and the capabilities available that mediate the group’s ability to adjust relative to the climate event (adaptive capacity). Exposure and sensitivity determine the potential impacts to a system but the ability to adjust determines its vulnerability. For this reason, vulnerability is intensified among the poor, marginalized and underrepresented people because of lack of access to requisite resources to make them more resilient to harm from climate change related vagaries (Ribot, Citation2010).
Vulnerability assessments need to answer the question on who is most vulnerable and how to assist them (Ribot, Citation2010). One way to do this is by constructing vulnerability indices. A vulnerability index integrates several indicators (Hahn, Riederer, & Foster, Citation2009) into a single numerical variable that can be used to compare contextual groups of households. The theoretical relationship between the indicators and vulnerability can be based on understanding of relationships (Wiréhn, Danielsson, & Neset, Citation2015) in an inductive or deductive manner (Adger, Brooks, Bentham, Agnew, & Eriksen, Citation2004; Hinkel, Citation2011), guided by literature review.
Each of the three dimensions of vulnerability, i.e. exposure, sensitivity and adaptive capacity was constructed using a set of indicators (Table ). The conceptual relationship between indicators and any of the dimensions of vulnerability was used to classify indicators as proxies of either adaptive capacity, sensitivity or exposure. All indicators of adaptive capacity show capabilities available to the household. This may be in terms of social networks, technology or livelihood options. Adaptive capacity indicators were all hypothesized to reduce vulnerability of the household to climate change. Sensitivity indicators describe aspects of the household that make it susceptible to even short-term variability. Such indicators include level to which the household is dependent on season crops and the lack of climate neutral livelihood options. In this study, exposure was constructed in terms of actual change realized within a household to the climate hazard (see Ionescu, Klein, Hinkel, Kumar, & Klein, Citation2009).
Table 1. Vulnerability indicators used to calculate values of major components for the GVI-IPCC index
4. Gender vulnerability index specification
In order to test the assertion on gender and climate change vulnerability, households’ data were categorized based on the gender of the household head. Households were grouped as being their single male headed (male headed), single female headed (female headed) or mixed gender households (where household head enjoys shared responsibility with a spouse).
Exposure, sensitivity and adaptive capacity are each constructed from n sub-components. The sub-components were first standardized using the min–max normalization method (Nardo et al., Citation2005).
The standardized values for each sub-component were given by
where , is the value of the indicator sub-component for each gender differentiated household,
and
and
are the minimum and maximum values, respectively, for each indicator sub-component determined using combined data for the whole sample.
Hahn et al. (Citation2009) illustrates how the index is calculated.
Diversity of crops, livelihood strategies, livestock assets, crop and livestock cash income and technology options were calculated following Shah, Dulal, Johnson, and Baptiste (Citation2013). The resulting index was subtracted from one such that a household with more crop choices had a higher diversity index.
The standardized sub-components were then averaged using the equation below
where Mg = one of the eight major components for gender gi [Human capacity (HC), Livelihood diversity (LD), Social Networks (SN), Land/use characteristics (LC), Food security (FS), Technology (T), Non-farm Income (NFI) or Climate change impact (CI)], represents the sub-components, indexed by i, that make up each major component, and n is the number of sub-components in each component.
The three components were segregated following the Intergovernmental Panel on Climate Change (IPCC) dimensions of vulnerability and each calculated as an index containing several sub-components.
The index for Adaptive capacity (Adpt), exposure (Exp), and sensitivity (Sen) were calculated as follows:
The index for adaptive capacity (Adpt) is determined by
where:
WHC,WLD, WSN and WT is the weight for human capacity, livelihood diversity, social networks and technology calculated from the number of indicators under the sub-components.
The index for exposure (Exp) was determined as follows:
where:
WCI the weight for climate change impact calculated from the number of indicators under the sub-component.
The index for sensitivity (Sen) was determined as follows:
WLC, WNFI and WFS is the weight for land characteristics, non-farm income and food security respectively calculated from the number of indicators under the sub-components
All sub-components contribute equally to the overall vulnerability index as they were given equal weights (Nardo et al., Citation2005).
The three contributing factors are combined to derive the GVI-IPCC index based on the IPCC framework by the IPCC (Parry et al., Citation2007) that encapsulates vulnerability for each gender differentiated household into a single value. The model specification for GVI-IPCC index is as shown in equation below
where GVI-IPCC is the Gender Vulnerability Index for gender differentiated household category gi expressed using the IPCC framework, is the calculated exposure score (equivalent to the Natural Disaster component),
is the calculated adaptive capacity score (weighted average of the human capacity, livelihood diversity, social networks and technology components) and
is the calculated sensitivity score (weighted average of the Food security, Land/use characteristics and Non-farm income sub-components).
An independent sample t-test was used to numerical sub-components and the Pearson chi square at 5% level of significance to compare non-numerical sub-components for gender differentiated household categories.
5. Results
5.1. Respondents’ socio-economic and demographic characteristics
The respondents were mainly from two ethnic groups i.e. basoga in Iganga and Namutumba and bagishu in Bududa and Manafwa. Majority (79%) of household heads were male. A sizeable number (23%) of households were female headed, these were mainly where the man was either deceased or continuously absent from the home for long periods of the year. The age of the respondents ranged between 18 and 91 years of age with an average at 48 years old. Most of the household heads had attained education mainly up to secondary level (13 years of school). Average farm size was 2.8 acres, but small parcels were mainly found in the high elevation districts with most of the respondents using all their land for production continuously without fallow.
5.2. Vulnerability indicator scores
There were more differences among household categories across adaptive capacity indicators than those of sensitivity and exposure. Differences in adaptive capacity were more between mixed gender households and female-headed households with 15 out of 18 indicators being significant. Mixed gender households differed from single male-headed households in 4 of 18 indicators of adaptive capacity, while single male and female-headed households only differed significantly in two of the 18 indicators. Differences between mixed gender and female-headed households were found in two of the eight indicators of sensitivity. Single male and female-headed households only differed significantly in one indicator of sensitivity. The GVI-IPCC contributing factors calculations are shown in Table and the individual indicator results are presented below.
Table 2. GVI-IPCC contributing factors calculations for mixed, male and female-headed households in Eastern Uganda
5.2.1. Adaptive capacity
There was disparity in many of the indicators of adaptive capacity among the three household categories (Figure ). Mixed gender households had the largest family size of 7.64 individuals followed by 6.82 in single male-headed households and only 5.57 individuals in single female-headed households. Family size in mixed gender households was significantly larger than both single male (t = 2.92, p = 0.004) and single female-headed households (t = 2.56, p = 0.011). Single female and single male-headed households did not differ with respect to family size. Compared to female-headed households, the heads in mixed gender households had attained 5.6 years of school which was not different from 5.58 years of school attained in single male-headed households but significantly higher (t = 2.099, p = 0.036) than the 4.9 years attained in single female-headed households. The oldest household heads were found in single female-headed households while the youngest were in mixed gender households (44.9). Age of the household head was significantly different between female headed and mixed gender households (t = 2.07, p = 0.039) but not different from single male-headed households (p = 0.895). Mixed gender and single male-headed households did not differ with respect to age of the household head. Thirty-nine percent of mixed gender households could hire labor for agricultural activities. This proportion was significantly higher (t = 8.616, p = 0.003) than 26.6% of single female-headed households but not different from 28% in single male-headed households.
Figure 2. Vulnerability spider diagram of major components for the gender vulnerability index for mixed gender, male and female-headed households in Eastern Uganda.
Mixed gender households had a higher index of information and communications technology than both single female-headed households (t = 5.646, p < 0.00) and single male-headed households (t = 0.2.435, p = 0.0.021). Single male and single female-headed households were not significantly different with respect to access to ICTs (t = 0.182, p = 0.856). Almost 75% of mixed gender households had access to weather forecast information which was significantly higher than the 61.5% of single female-headed households (χ2 = 10.644, df = 1, p = 0.001), but no difference with the single male-headed households (67.9%). While 59.8% of mixed gender households used improved seed, only 46.4% and 45% of male-headed and female-headed households, respectively did the same. Mixed gender households were only different from single female-headed households in the use of improved seed (χ2 = 11.497, p = 0.001).
More than half of mixed gender households (53.3%) had a member belonging to a local social group which was significantly higher than the 40.2% of single female-headed households (χ2 = 8.84, p = 0.003) but no difference with single male-headed households. Access to assistance from government in the event of climate change-related disaster was highest among single male-headed households (44%) followed by mixed gender households (41.3%) and single female-headed households (20.3%). Female-headed households performed significantly poorer than the other two household types with respect to access to government assistance for climate related stresses. Government assistance was reportedly in form of dry rations, agricultural seeds and clothing materials for affected families.
Mixed gender households owned 3.08 acres of agricultural land which was not different from 1.68 acres owned by single male-headed households but significantly different from 2.19 acres owned by single female-headed households (t = 3.587, p < 0.05). Single male and female-headed households did not differ from each other in the amount of land owned (t = 1.641, p = 0.108).
The diversity of income sources was similar between mixed gender and male-headed households but higher than for female-headed households (t = 5.316, p < 0.05). Single male and single female-headed households did not differ in diversity of income sources. The diversity of livestock types sold for cash was higher than for mixed gender households than for both single male headed (t = 2.283, p = 0.023) and single female-headed households (t = 4.565, p < 0.05). There was no significant difference in the diversity of income, crops sold for cash and livestock between mixed gender and single male-headed households.
5.2.2. Gender differentiated sensitivity and exposure to climate change
There was no significant difference among the different households across most of the sensitivity indicators considered in the analysis. However, a significantly larger proportion of single female-headed households did not practice agroforestry compared to mixed gender households (χ2 = 23.566, p = 0.000).
More households headed by single men reported having temporarily migrated due to climate change-related stress. Ten percent of single male-headed households had sought temporary migration which was significantly higher than 1.5% among mixed gender households (χ2 = 11.891, p = 0.001) and 1.8% among female-headed households (χ2 = 6.5, p = 0.011). Thirty-five percent of single male-headed households reported experiencing diseases to persons and livestock which was significantly higher than 15.2% of mixed gender (χ2 = 5.130, p = 0.024) and 16% of female-headed households (χ2 = 6.135, p = 0.013).
Overall the GVI-IPCC vulnerability index showed that single male-headed households were more vulnerable to climate change than either mixed gender or single female-headed households (Figure ).
Figure 3. GVI-IPCC Vulnerability index for mixed gender, male and female-headed households in Eastern Uganda.
6. Discussion
The heads of households were mainly male due to a patriarchal system followed in the study area. Women were household heads only when the man is away for long periods of the year or when widowed. The unexpected high number of female-headed households highlights an increasing trend where men move away from home seeking for other income opportunities. This probably explains why the percentage of households receiving remittance income was also high. Due to the large proportion of female-headed households, it is important to assess whether these households are disadvantaged on account of the gender of the household head. Many household heads had attained an education possibly due to opportunities for free primary and secondary education provided by the government of Uganda. High membership to social groups is characteristic of rural behavior where social groups are avenues for livelihoods support (Lahiri-Dutt & Samanta, Citation2006; Narayan & Pritchett, Citation1999). Socio-economic characteristics corroborate other studies in the area (e.g. Mubangizi, Kyazze, & Mukwaya, Citation2018) showing high potential for impact on local livelihoods given the high dependence on agriculture. But vulnerability of livelihood is not expected to be uniform across all households due to pre-existing conditions that affect their adaptive capacity (Holand et al., Citation2011).
The assertion on women vulnerability may be misleading especially if the conclusion is drawn from household surveys using the usual gender dichotomy. Comparing female and male-headed households is in effect comparing single and mixed gender households. This is because most male-headed households will also have a female adult, while female-headed households are comprised mostly by widows who are too old to remarry after the loss of their spouses. By further decomposing household headship, the results contest the a priori determination placed on women vulnerability and show that instead women are positive contributors to reducing vulnerability in their households. It is probably the reason why men without women (in single male-headed households) performed worse than women without men (in single female-headed households). In fact the results agree with Davids and Van Driel (Citation2001) that female household heads may benefit from being without a dominating male. The autonomy and ability to make independent decisions leads to better outcomes for female-headed households and compensate for the lack of an adult male.
The overall GVI-IPCC vulnerability index favored mixed gender households when compared with either single male or female-headed ones probably due to gender synergism within such households. Households with couples benefit from division of responsibilities between adult members. The men undertake off farm income generating activities as the women are entrusted in securing the food security of the household. This would increase the adaptive capacity of such households.
Few female-headed households hired additional labor probably because of cultural constraints hindering females from taping into the predominately male-dominated agricultural labour market (O’Sullivan et al., Citation2014). Culturally, women find it more comfortable to negotiate and hire fellow women to offer agricultural labor. Because few women work full-time as hired agricultural laborers, women have a smaller pool of hired labour to choose from. This could reduce ability of female-headed households to manage their cropping activities especially when the growing season is shortened by late onset or early cessation of rainfall as was reported.
The number of years of schooling attained by the household head was lowest among female-headed households probably because of gender bias that female children face in attaining education (Kabeer, Citation2005). Subsequently, these households have limited opportunities to engage in gainful employment or even to make good decisions regarding how to cope with or safeguard their livelihoods against climate change.
The small family size of single male-headed households could be due to the fact that these were mainly elderly men whose adult children had left to live independently. Single male-headed households therefore experience more acute labour shortages. Additionally, the absence of a spouse in the lone male/female-headed households deprived them of the contribution that the partner could have made toward household welfare in terms of labour of earned income.
All indicators of technology show that single female-headed households were particularly disadvantaged. For instance, use of irrigation requires manual power which may not be readily available in a household without a male adult. Use of agricultural inputs like improved cultivars and inorganic fertilizers require readily available cash which may disadvantage female-headed households because women usually concentrate on subsistence crop production (Palacios-Lopez, Christiaensen, & Kilic, Citation2017) and seldom have the money required to purchase agricultural inputs.
The livelihood diversity indicators showed mixed gender households outperforming both single male and female-headed households. Having two adults enables the household to diversify its livelihood options due to division of tasks (Boserup, Citation2007; Simiyu & Foeken, Citation2014). Mixed gender households in our study have an advantage of benefiting from the enterprise of a female partner, which explains why their income diversity index was higher than for lone male/female-headed households. In mixed households the division of tasks between male and female members probably creates labour idling which according to Ellis (Citation2000) forces members to venture into other income generating activities.
The big portfolio of livestock among mixed gender households could be as a result of “gendering livestock” whereby men tend to concentrate on large commercially more valuable livestock (Bravo-Baumann, Citation2000) while the women maintain the smaller livestock like goats and poultry (Kechero, Citation2008; Njuki & Sanginga, Citation2013). Moreover, different kinds of livestock serve different purposes, sale of small livestock easily caters for short-term needs like purchase of inputs, while large livestock are reserved for big shortfalls in household income. This array of possibilities improves the adaptive capacity of the households and reduces their sensitivity to disturbances related to climate change.
Low social networks among female-headed households echoes what Nelson, Meadows, Cannon, Morton, and Martin (Citation2002) reported that even government programs fail to adequately target female-headed households. Women from female-headed households are constrained by lack of time due to many responsibilities of looking after their homes to participate in social groups (Chant, Citation2004). Mixed gender households can afford to have one of the adults attend social group events while the other attends to the household chores. Issuance of government provided relief tends to be a male dominated activity which would greatly disadvantage those households without a male adult.
The high impact suffered by single male-headed households could be explained by these households having the lowest resource rich individuals. Men who could not get married are the poorest of the poor which explains why they were the more likely to take up temporary migration. In addition, male-headed households which had the smallest family size would find it logistically easier to temporarily migrate in the event of a climate stress.
7. Conclusion
A definite assertion that women and therefore female-headed households are more vulnerable to climate change without empirical proof could fail the process of determining those to be prioritized for adaptation assistance. The results show that the straight assumption that vulnerability is always associated with female-headed households is wrong and misleading. It is wrong because single male-headed households were the most vulnerable to climate change in Eastern Uganda. It is misleading because it fails to query the situation of women in male-headed households and obscures vulnerability often experienced by men in single male-headed households. Moreover, portraying women as the most vulnerable obscures the virtuousness of women and draws a veil over their contribution in mixed gender households. While denying that women are more vulnerable to climate change can potentially deprive them of adaptation assistance, emphasizing their vulnerability blurs over the moderate status of women in male-headed households or their contribution in reducing vulnerability in their households.
The results imply that vulnerability is not sex linked, but rather one of the symptoms of the lack of gender synergism. Gender synergism or the lack of creates big differences even within one gender category. There were differences in vulnerability among both men and women based on their marital status. As such, any vulnerability reducing intervention that would target women would not only disenfranchise a more vulnerable group of single men but also fail to identify the more vulnerable among women.
The main contribution to understanding vulnerability is that whereas the results do not dispel the common notion that women are more vulnerable to climate change, they show that the sex dichotomy of gender is not sufficient to identify the most vulnerable members of society, as there were differences within gender categories. In conclusion, it is imperative to sway the climate change vulnerability narrative away from stereotyping women as the most vulnerable (cf. Dankelman, Citation2010) and recommend that more research is done to reveal the inter household socio-economic characteristics other than gender which reveal greatest differences in vulnerability to climate change.
Additional information
Funding
Notes on contributors
Kenneth Balikoowa
Kenneth Balikoowa is a PhD candidate whose research interest is natural resources management. He conducts research on gender and climate change adaptation, forestry and environmental management in Uganda. This work is one of the outputs from the Regional Capacity Building for Sustainable Resource Management and Agricultural Productivity under Changing Climate (CAPSNAC) project covering three countries whose main goal is to strengthen research capabilities in climate change and to generate knowledge for policy formulation.
References
- Adger, W. N., Brooks, N., Bentham, G., Agnew, M., & Eriksen, S. (2004). New indicators of vulnerability and adaptive capacity (Vol. 122). Norwich: Tyndall Centre for Climate Change Research Norwich.
- Arora-Jonsson, S. (2011). Virtue and vulnerability: Discourses on women, gender and climate change. Global Environmental Change, 21(2), 744–751. doi:10.1016/j.gloenvcha.2011.01.005
- BDPU. (2012). Bududa district statistical abstract. Bududa: Bududa District Local Government.
- Blaikie, P., Cannon, T., Davis, I., & Wisner, B. (1994). At risk: Natural hazards, people’s vulnerability and disasters. London: Routledge.
- Boserup, E. (2007). Woman’s role in economic development. London: Earthscan.
- Bravo-Baumann, H. (2000). Livestock and gender: A winning pair: Capitalization of experiences on the contribution of livestock projects to gender issues: Implications of gender aspects for project design. Bern, Switzerland: Swiss Agency for Development and Cooperation.
- Cannon, T. (2002). Gender and climate hazards in Bangladesh. Gender & Development, 10(2), 45–50. doi:10.1080/13552070215906
- Chant, S. (2004). Dangerous equations? How female‐headed households became the poorest of the poor: Causes, consequences and cautions. IDS Bulletin, 35(4), 19–26. doi:10.1111/idsb.2004.35.issue-4
- Dankelman, I. (2010). Gender and climate change: An introduction. London: Routledge.
- Davids, T., & Van Driel, F. (2001). Globalisation and gender: Beyond dichotomies. Globalisation and Development Studies Challenges for the 21st Century, 1, 153–175.
- Ellis, F. (2000). The determinants of rural livelihood diversification in developing countries. Journal of Agricultural Economics, 51(2), 289–302. doi:10.1111/j.1477-9552.2000.tb01229.x
- Hahn, M. B., Riederer, A. M., & Foster, S. O. (2009). The livelihood vulnerability index: A pragmatic approach to assessing risks from climate variability and change—A case study in Mozambique. Global Environmental Change, 19(1), 74–88. doi:10.1016/j.gloenvcha.2008.11.002
- Hinkel, J. (2011). “Indicators of vulnerability and adaptive capacity”: Towards a clarification of the science–Policy interface. Global Environmental Change, 21(1), 198–208. doi:10.1016/j.gloenvcha.2010.08.002
- Holand, I. S. (2014). Lifeline issue in social vulnerability indexing: A review of indicators and discussion of indicator application. Natural Hazards Reviews, 16(3), 04014026. doi:10.1061/(ASCE)NH.1527-6996.0000148
- Holand, I. S., Lujala, P., & Rød, J. K. (2011). Social vulnerability assessment for Norway: A quantitative approach. Norsk Geografisk Tidsskrift-Norwegian Journal of Geography, 65(1), 1–17. doi:10.1080/00291951.2010.550167
- Ionescu, C., Klein, R. J., Hinkel, J., Kumar, K. K., & Klein, R. (2009). Towards a formal framework of vulnerability to climate change. Environmental Modeling & Assessment, 14(1), 1–16. doi:10.1007/s10666-008-9179-x
- Johnsson-Latham, G. (2007). A study on gender equality as a prerequisite for sustainable development. Retrieved from http://www.uft.oekologie.uni-bremen.de/hartmutkoehler_fuer_studierende/MEC/09-MEC-reading/gender%202007%20EAC%20rapport_engelska.pdf
- Kabeer, N. (2005). Gender equality and women’s empowerment: A critical analysis of the third millennium development goal 1. Gender & Development, 13(1), 13–24. doi:10.1080/13552070512331332273
- Kechero, Y. (2008). Gender responsibility in smallholder mixed crop–Livestock production systems of Jimma zone, South West Ethiopia. Livestock Research for Rural Development, 20(11), 12.
- Kitutu, M., Poesen, A. M. J., & Deckers, J. (2011). Farmer’s perception on landslide occurrences in Bududa District, Eastern Uganda. African Journal of Agricultural Research, 6(1), 7–18.
- Kousky, C., & Cooke, R. M. (2009). Climate change and risk management: Challenges for insurance, adaptation, and loss estimation. SSRN Electronic Journal. doi:10.2139/ssrn.1346387
- Lahiri-Dutt, K., & Samanta, G. (2006). Constructing social capital: Self-help groups and rural womens development in India. Geographical Research, 44, 285–295. doi:10.1111/ages.2006.44.issue-3
- Lewis, J. (1999). Development in disaster-prone places: Studies of vulnerability. London: ITDG Publishing.
- Mbogga, M. (2012). Climate profiles and climate change vulnerability assessment for the Mbale Region of Uganda. Retrieved from http://www.adaptation-undp.org/resources/assessments-and-background-documents/tacc-uganda-%E2%80%93-climate-profiles-and-climate-change
- Mubangizi, N., Kyazze, F. B., & Mukwaya, P. I. (2018). Smallholder Farmers’ perception and adaptation to rainfall variability in Mt. Elgon Region, Eastern Uganda. International Journal of Agricultural Extension, 5(3), 103–117.
- Narayan, D., & Pritchett, L. (1999). Cents and sociability: Household income and social capital in rural Tanzania. Economic Development and Cultural Change, 47(4), 871–897. doi:10.1086/452436
- Nardo, M., Saisana, M., Saltelli, A., Tarantola, S., Hoffman, A., & Giovannini, E. (2005). Handbook on constructing composite indicators. Paris: OECD Publishing.
- Nelson, V., Meadows, K., Cannon, T., Morton, J., & Martin, A. (2002). Uncertain predictions, invisible impacts, and the need to mainstream gender in climate change adaptations. Gender & Development, 10(2), 51–59. doi:10.2307/4030574
- Njuki, J., & Sanginga, P. C. (2013). Women, livestock ownership and markets: Bridging the gender gap in eastern and southern Africa. New York: Routledge.
- O’Brien, K., Eriksen, S. E., Schjolden, A., & Nygaard, L. P. (2004). What’s in a word? Conflicting interpretations of vulnerability in climate change research. Retrieved from
- O’Sullivan, M., Rao, A., Banerjee, R., Gulati, K., & Vinez, M. (2014). Levelling the field: Improving opportunities for women farmers in Africa. Washington DC.
- Palacios-Lopez, A., Christiaensen, L., & Kilic, T. (2017). How much of the labor in African agriculture is provided by women? Food Policy, 67, 52–63. doi:10.1016/j.foodpol.2016.09.017
- Parry, M. L., Canziani, O., Palutikof, J., Van der Linden, P., & Hanson, C. (2007). Climate change 2007-impacts, adaptation and vulnerability: Working group II contribution to the fourth assessment report of the IPCC. Cambridge, UK: Cambridge University Press.
- Pielke, R., Prins, G., Rayner, S., & Sarewitz, D. (2007). Climate change 2007: Lifting the taboo on adaptation. Nature, 445(7128), 597–598. doi:10.1038/445597a
- Rahman, M. S. (2013). Climate change, disaster and gender vulnerability: A study on two divisions of Bangladesh. American Journal of Human Ecology, 2(2), 72–82. doi:10.11634/216796221302315
- Ribot, J. (2010). Vulnerability does not fall from the sky: Toward multiscale, pro-poor climate policy. In R. Mearns & A. Norton (Eds.), Social dimensions of climate change: Equity and vulnerability in a warming world (Vol. 2, pp. 47–74). Washington, DC: The World Bank
- Shah, K. U., Dulal, H. B., Johnson, C., & Baptiste, A. (2013). Understanding livelihood vulnerability to climate change: Applying the livelihood vulnerability index in Trinidad and Tobago. Geoforum, 47, 125–137. doi:10.1016/j.geoforum.2013.04.004
- Sharmin, Z., & Islam, M. (2013). Consequences of climate change and gender vulnerability: Bangladesh perspective. SSRN Electronic Journal. doi:10.2139/ssrn.2200116
- Simiyu, R., & Foeken, D. (2014). Gendered divisions of labour in urban crop cultivation in a Kenyan town: Implications for livelihood outcomes. Gender, Place & Culture, 21(6), 768–784. doi:10.1080/0966369X.2013.810602
- Staudt, M., Kuosmanen, E., Babirye, P., & Lugaizi, I. (2014). The Bududa landslide of 1 March 2010. Geological Survey of Finland (Special Paper 56), 373-384
- UBOS. (2010, December). Uganda census of agriculture 2008/2009. Volume III: Agricultural household and holding characteristics report. Kampala, Uganda: Uganda Bureau of Statistics.
- Vincent, K., & Cull, T. (2010). A Household Social Vulnerability Index (HSVI) for evaluating adaptation projects in developing countries. Paper presented at the PEGNet Conference 2010: Policies to foster and sustain equitable development in times of crises: Midrand, 2-3rd September 2010, Midrand, South Africa.
- Vlaeminck, P., Maertens, M., Isabirye, M., Vanderhoydonks, F., Poesen, J., Deckers, S., & Vranken, L. (2016). Coping with landslide risk through preventive resettlement. Designing optimal strategies through choice experiments for the Mount Elgon region, Uganda. Land Use Policy, 51, 301–311. doi:10.1016/j.landusepol.2015.11.023
- Waite, L. (2000). How is household vulnerability gendered? Female‐headed households in the collectives of Suleimaniyah, Iraqi Kurdistan. Disasters, 24(2), 153–172.
- Wiréhn, L., Danielsson, Å., & Neset, T.-S.-S. (2015). Assessment of composite index methods for agricultural vulnerability to climate change. Journal of Environmental Management, 156, 70–80. doi:10.1016/j.jenvman.2015.03.020