
Abstract
Land use land cover (LULC) change detection based on remote sensing data is an important source of information for various decision support systems. Information derived from land use and land cover change detection is important to land conservation, sustainable development, and management of water resources. This purpose of this study is therefore concerned with identifying the change in land use and land cover detection of the Tana basin. To identify land cover changes detection; remote sensing data, satellite imagery and image processing techniques had done within three dates of 1986, 2002 and 2018 using Land sat TM 30 m resolution images. ENVI and Arc GIS soft wares had used to identify the changes. The classification had done using six land cover (water body, bushland, grassland, forestland, cultivated, and residential land) class. Preprocessing and classification of the images had analyzed carefully and accuracy assessment was tested separately using the kappa coefficient. The results showed that overall accuracy in the basin was 84.21%, 83.32% and 91.40% and kappa coefficient of 79.02%, 83.32%, 89.66% for the years 1986, 2002 and 2018 respectively. This study indicated that in the last 32 years period, agricultural land and residential areas had significantly increased by 15.61% and 8.05% respectively in the basin. Therefore, proper land management practices, integrated watershed management, and active participation of the local community should be advance to protect undesirable LULC change in the basin.
PUBLIC INTEREST STATEMENT
Human activities are one of the main driving forces of land use and land cover changes, and generally in natural environments. Land-use change affects the nature of the climate, cause natural hazards and socio-economic dynamics on a global and local scale. Therefore, defining the land-use change is an important issue considering global dynamics and their response to the water flow, forest, soil, and rainfall and runoff characteristics of the catchment or basins. In addition to that investigating land use, land cover change is important for effective sustainable land resource management, effective utilization of the natural resource, and use as a tool for policymakers and understanding the changes in hydrological processes. Therefore, this study is an important hint for decision-makers to understand the dynamic nature of the basin for the last decades and to take measures based on the finding.
1. Introduction
The land use and land cover change of an area is an outcome of natural and socio-economic aspects and their operation by the human in time and space. Land use land cover (LULC) changes are mostly influenced by increase and decrease in population growth in the system (Lambin et al., Citation2003), economic growth, and physical factors including topography, slope condition, soil type, and climate (Setegn et al., Citation2009; Yalew et al., Citation2016). Land-use change is a matter of historical process as relating to how people use the land. It modifies the availability of different resources including vegetation, soil, and water (Ahmad, Citation2014). Land-use change directly affects the amount of evapotranspiration, groundwater infiltration and overland runoff. Land use land cover change is an important issue considering global dynamics and their responses to environmental and socio-economic drivers (Akpoti et al., Citation2016; Bewket, Citation2002; Hurni et al., Citation2005). Land use land cover alterations, negatively affect the patterns of climate, natural hazards and socio-economic dynamics on a global and local scale (Chakilu & Moges, Citation2017; Hegazy & Kaloop, Citation2015; Sewnet, Citation2015). Information on land use/cover and potentials for their best use is essential for the selection, planning, sustainable land resource management and understanding the changes in hydrological processes to meet the increasing demands for basic human needs and welfare.
Change detection is valuable in many applications related to land use and land cover (LULC) changes detection including cultivation, urban expansion and landscape changes (Hegazy & Kaloop, Citation2015; Imbernon, Citation1999; Solaimani et al., Citation2010). Understanding landscape patterns, changes and interactions between human activities and natural phenomenon are essential for proper land management and decision improvement (Rawat & Kumar, Citation2015). Geographic Information Systems (GIS) and remote sensing (RS) are powerful and cost-effective tools for assessing the spatial and temporal change of LULC (Herold et al., Citation2003; Serra et al., Citation2008). Nowadays, remote sensing data are applicable and valuable for land use and cover change detection studies (Yuan et al., Citation2005). Remote sensing data is the most common source for detection, quantification, and mapping of LULC patterns due to its repetitive data acquisition, suitable for processing, and accurate geo-referencing (Chen et al., Citation2005; Jensen, Citation1996).
In most developing countries like Ethiopia, population growth has been a dominant cause of land use and land cover change (Geremew, Citation2013). Several studies were conducted in Ethiopia (Amsalu et al., Citation2007; Garedew et al., Citation2009; Zeleke & Hurni, Citation2001) related to LULC changes with a variety of drivers, which include demographic pressure and associated demand on the environmental resources (Belay & Mengistu, Citation2019). These studies showed that the pattern, direction, and degree of LULC change were heterogeneous from place to place. This study suggested that LULC change study is critical for environmental protection strategy and sustainable resource management of basins. Ethiopia is facing huge LULC change mostly change of natural resources to the farming system and human settlement (Birhane et al., Citation2019). The Lake Tana basin in Ethiopia, over the past decades, the physical Characteristics including the streamflow and land use land cover have adversely had changed (Chakilu & Moges, Citation2017). This change detection has a direct effect on the lake and the Tana Basin as well. Thus, timely monitoring of LULC dynamics and quantify landscape patterns for the Tana basin is essential to monitor and evaluate land-use dynamics.
Therefore, the aim of this study was to assess the trend of land use and land cover change in the Tana basin of Northwest Ethiopia. In this study, LULC changes had investigated using remote sensing data with the help of GIS and ENVI software. Therefore, we expect that the finding of this study could contribute information for decision-makers, land managers and planners for sustainable development and management of the natural resource.
2. Materials and methods
2.1. Description of the study area
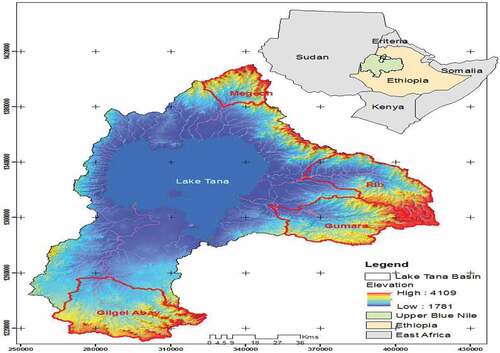
Lake Tana is the source of the Blue Nile River and the lake covers 3,060 km2 at elevation 1,786 masl. The lake is the largest in Ethiopia and the third-largest in the Nile Basin. The basin has minimum elevation at the flood plain of Fogera, Dembia, and Gilgel Abay while the maximum elevation is about 4109 masl in the mountainous area. It is located at 12°00ʹ Northing and 37°15ʹ Easting which is 564 km from the capital of Ethiopia, Addis Ababa (Figure ) (Zimale et al., Citation2018).
Figure 1. Location of Lake Tana Basin.
2.2. Materials
Landsat image is a special sensor onboard the Landsat Satellite platform and is capable of capturing multispectral imagery. Landsat multispectral images capture many bands of the electromagnetic spectrum, including visible, reflective infrared and thermal infrared energy. Understanding the strengths and weaknesses of different types of sensor data is essential for the selection of suitable remotely sensed data for image classification (Gomez et al., Citation2016; Lu & Weng, Citation2007). The selection of suitable sensor data is the first important step for a successful classification (Ward et al., Citation2000). It requires considering such factors as user’s need, the scale and characteristics of a study area, the availability of various image data and their characteristics, cost and time constraints, and the analyst’s experience in using the selected image (Lu & Weng, Citation2007). In this study LULC, change detection had analyzed using satellite images. Arc GIS and ENVI classic view software had employed in combination with automatic classification. Landsat satellite images of the basin had acquired for the periods of 1986, 2002, and 2018 years. Therefore, this study is interested to find out the LULC change detection in these periods using Landsat images.
2.3. Methodology
In remote sensing studies, a representative ground truth data is a prerequisite to associate this reflectance property to the object and the train classifiers and facilitate accurate automatic classification (Muzein, Citation2006). Investigate the trend changes in each land cover type, the entire image has classified by supervised classification method using maximum likelihood classifier (algorithm) environment. In this study, downloading Landsat images of the required years for the study area, random control points, ENVI 5.3 and GIS 10.1 software, Google earth images for further had used in the LULC classification. The image data files had downloaded in zipped files from the United States Geological Survey (USGS) website and extracted to Tiff format files. The downloaded images then converted to image format using ENVI 5.3 software in the pre-processing procedure.
3. Land use and land cover classification
To perform image classification, the raw data must be preprocessed and prepared properly so that error due to the geometry of the earth, radiometric and atmospheric effects could be accounted for. The general procedure in the preprocessing stage has included the detection and restoration of bad lines, geometric rectification or image registration, radiometric calibration, atmospheric correction, and topographic correction.
4. Supervised image classification
In this process, we select pixels that represent patterns we recognize, or that we could identify with help from other sources (Google earth) information. Knowledge of the data, the classes desired, and the algorithms to be used were required before we begin selecting training samples. By setting priorities to these classes, we had supervised the classification of pixels as they had assigned to a class value.
5. Accuracy assessment
A classified image or change detection map needs to be compared against reference data, assumed to be true, to assess its performance and quantify its accuracy (Foody, Citation2002). The process had used to estimate the accuracy of image classification by comparing the classified map with a reference map. Therefore, full accuracy assessment needs to include the report on Overall accuracy, User Accuracy, and Producer Accuracy had investigated using the Kappa coefficient.
6. Image processing
The procedure in the preprocessing stage was including the detection and restoration of bad lines, geometric rectification or image registration, radiometric calibration, atmospheric correction, and topographic correction. Accurate geometric rectification or image registration of remotely sensed data is a prerequisite for a combination of different source data in a classification process (Mahendra et al., Citation2015). The study had done using Landsat imageries to identify changes in LULC distribution in the basin over 32 periods of 1986 to 2018 years. To avoid a seasonal variation and to minimize the cloud cover, the selection of dates of the acquired data had made in the dry season and with the same annual season of the acquired years. To view and discriminate the surface features clearly, all the input satellite images had composed using the RGB colour composition. Furthermore, the images provided complete coverage of the study area and mosaicking, stacking of bands, sub-setting of the images had done using ENVI 5.3 software.
7. Change detection
The importance of change detection is to determine which land-use class is changing to the other. The most commonly used land change detection methods include image overlay, classification comparisons of land cover statistics, change vector analysis, principal component analysis, image rationing and the differencing of normalized difference vegetation index (NDVI) (Han et al., Citation2009). In this study, classification comparisons of land cover statistics had used. The areas covered by each land cover type for the various periods had compared. Then the directions of the changes (positive or negative) in each land cover type had determined.
8. Results and discussion
8.1. Land use and land cover analysis
To assess the classification accuracy, confusion matrix had used including overall accuracy, user’s accuracy, and producer’s accuracy. Classification is not complete until its accuracy is assessed using the known Kappa statistics (Forkuor & Cofie, Citation2011).
8.1.1. Overall accuracy
This accuracy gives the overall results of the confusion matrix. It is calculated by dividing the total number of correct pixels (diagonal values) by the total number of pixels in the confusion matrix. According to (Anderson, Citation1976), the minimum accuracy value for reliable land cover classification is 85 %. On the other hand, accuracy levels are accepted by users may not acceptable by other users for a certain task (Geremew, Citation2013).
8.1.2. Kappa coefficient (KC)
The Kappa statistic had used to measure the agreement between two sets of categorizations of a dataset (Table ). And used to estimate the accuracy of predictive models by measuring the agreement between the predictive model and a set of field surveyed sample points (Moriasi et al., Citation2007).
Table 1. Kappa coefficient agreement
In this study, 116, 139 and 162 number of ground control points had used to validate the classified images for 1986, 2002 and 2018 respectively using Global Positioning System (GPS) point from Google earth on the field in addition to the unchanged ground control point. The accuracy had performed separately for the year 1986, 2002 & 2018 images, respectively.
The results showed that the overall accuracy of 1986 (Table ) was 84.2% while the producer’s and user’s accuracy range from 75 to 95.83 % and 62.5 to 94.12 % respectively. Kappa statistics had calculated from the error matrix, and the coefficient of the classification for 1986 was 79.02%. Thus, according to the classification scale given by (Moriasi et al., Citation2007), the classification lies in a very good range.
Table 2. Confusion matrixes for the classification of 1986
Generally, the results (Table ) showed that the overall accuracies were 87.05 % and 90.36 % for the years 2002 and 2018 respectively. This result was fulfilled the minimum accuracy (Anderson, Citation1976) for land cover change and it was better than 1986 classified image. In this study, the producer’s and user’s accuracy ranges from 77.78 to 96.15 % and 73.08 to 96.15 % in the year 2002 while in 2018 it ranges from 86.36 to 96.55 % and 84.00 to 96.55 % respectively. The Kappa coefficient of the classification was 83.32 % and 89.66 % in 2002 and 2018 respectively. Thus, according to the classification scale given by (Moriasi et al., Citation2007), the classification lies in a very good range and excellent scale in 2002 and 2018 years respectively.
Table 3. Summary of accuracy assessment from 1986–2018 (%)
8.2. Land use and land cover maps
The spatial analysis had carried out to describe land cover change patterns and overall land-use changes with time. Forestland, bush/shrubland, Grassland, Cultivated land, and Residential area were the major land use and land cover classes of the basin. Land use land cover change (Figure ) and (Figure ) detection of the Tana basin showed that a change of most forestland to cultivated and residential land. This result was lies with (Belay & Mengistu, Citation2019) showed that nowadays the basin was shifted from forest land to cultivated land.
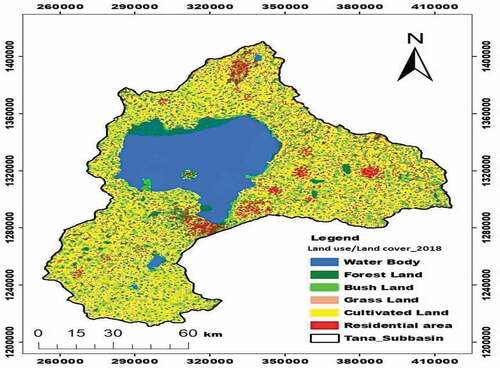
Analyses of the result indicated that bushland was the dominant land cover class of 19. 39 and 15.82 % next to Agricultural land 37.56 and 43.12 % in 1986 and 2002 respectively. This result reveals that the main source of income was agriculture during this period. Analysis of the 2018 image revealed that agricultural land constituted the largest proportion while bushland was the second dominant coverage of 9.56 % next to Agricultural land in the basin. This result is due to the expansion of population growth and the increments of human needs. Generally, the result indicates that forestland, bushland, and grassland had decreased while residential areas and cultivated land had increased this may be due to the increment of population growth and high demand for agricultural production.
Figure 2. Land use land cover map of 1986 and 2002 of the Tana basin.
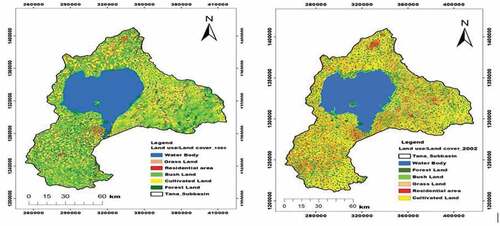
Figure 3. Tana basin land cover map of 2018.
LULC change detection in the basin revealed that agricultural land and settlement areas increased from 1984 to 2018 in the last 32 years (Table ) while forest, bush, and grazing lands had decreased. Water bodies had remained similar coverage this may be due to the construction of large reservoirs in the basin. This land use and land cover change may affect the hydrology of the catchment.
Table 4. Summaries of land cover classes in the Tana basin from 1986–2018
8.3. Change detection analysis
The land use and land cover change detection based on remote sensing images have been widely applied in research for LUCC, natural resource management and environment monitoring & protection (Zhang et al., Citation2014). The percentage area of each land cover class had derived from supervised classified images for each year separately using ENVI 5.3 Soft wares integrating with Arc GIS. The change detection indicted that the shifting of forestland (3.96%), bushland (5.23%), and grazing land (6.42%) had significantly changed to agricultural land. Moreover, the area of forestland (0.87 %), bushland (2.91 %) and grazing land (4.26 %) had changed slightly into a settlement area. This finding was similar to (Tekle, Citation2001) reported that there was the destruction of shrubs and small trees in Southern Wello, Ethiopia and (Yonas et al., Citation2013) reported that reduction of woodland cover in Northern Afar during the past decades. This shifting of forestland to agriculture and residential area is due to high population growth in the basin.
9. Conclusions
In this study, LULC detection of Lake Tana basin over the last three decades had analyzed. The result of the study showed that significant change detection had observed during the study period. Agriculture and residential/urban areas showed an increasing trend of 13 and 9.1 %, respectively, while forest, bushland, and grassland showed a decreasing trend of 2.3, 9.8 and 10 %, respectively. This result revealed that the change of forest, bushland, and grassland to agricultural and residential areas which may problems including change in streamflow, soil degradation, and hydrological system in the basin. These changes could have implications for sustainable resource management and the livelihood of the local society. Therefore, improved land management practices (soil and water conservation), improved agricultural inputs, integrated watershed management (land use planning and management), and active participation of local community should be advance to prevent undesirable LULC dynamics in the basin. In this study, the change detection analysis using GIS and remote sensing could deliver useful information to understand the seasonal patterns of land use dynamics for planners and decision-makers consequently sustainable land management planning is possible.
Competing interests
The authors declares no competing interests.
Additional information
Funding
Notes on contributors
Dires Tewabe
Dires Tewabe is aresearcher at Adet Agricultural Research Center, Ethiopia. He had done research activities in water resource management, water quality, irrigation agronomy, and related issues. He has the interest conduct research on water resource management and planning.
Temesgen Fentahun is a researcher at Pawe Agricultural Research Center, Ethiopia. He had researched conservation agriculture and water productivity and related issues. He has the interest to do research related to agricultural water management.
References
- Ahmad, S. (2014). Land use change detection using remote sensing and artificial neural network: Application to Birjand, Iran. Computational Ecology and Software, 4, 276. http://www.iaees.org/publications/journals/ces/onlineversion.asp
- Akpoti, K., Antwi, E. O., & Kabo-Bah, A. T. (2016). Impacts of rainfall variability, land use and land cover change on stream flow of the black Volta Basin, West Africa. Hydrology, 3(3), 26. https://doi.org/10.3390/hydrology3030026
- Amsalu, A., Stroosnijder, L., & De Graaff, J. (2007). Long-term dynamics in land resource use and the driving forces in the Beressa watershed, highlands of Ethiopia. Journal of Environmental Management, 83(4), 448–11. https://doi.org/10.1016/j.jenvman.2006.04.010
- Anderson, J. R. (1976). A land use and land cover classification system for use with remote sensor data. US Government Printing Office.
- Belay, T., & Mengistu, D. A. (2019). Land use and land cover dynamics and drivers in the Muga watershed, Upper Blue Nile basin, Ethiopia. Remote Sensing Applications. Society and Environment, 15, 100249. https://doi.org/10.1016/j.rsase.2019.100249
- Bewket, W. (2002). Land cover dynamics since the 1950s in Chemoga watershed, Blue Nile basin, Ethiopia. Mountain Research and Development, 22(3), 263–269. https://doi.org/10.1659/0276-4741(2002)022[0263:LCDSTI]2.0.CO;2
- Birhane, E., Ashfare, H., Fenta, A. A., Hishe, H., Gebremedhin, M. A., & Solomon, N. (2019). Land use land cover changes along topographic gradients in Hugumburda national forest priority area, Northern Ethiopia. Remote Sensing Applications: Society and Environment, 13, 61–68. https://doi.org/10.1016/j.rsase.2018.10.017
- Chakilu, G., & Moges, M. (2017). Assessing the land use/cover dynamics and its impact on the low flow of Gumara Watershed, Upper Blue Nile Basin, Ethiopia. Hydrol Current Res, 7, 2. doi: 10.4172/2157-7587.1000268
- Chen, X., Vierling, L., & Deering, D. (2005). A simple and effective radiometric correction method to improve landscape change detection across sensors and across time. Remote Sensing of Environment, 98(1), 63–79. https://doi.org/10.1016/j.rse.2005.05.021
- Foody, G. M. (2002). Status of land cover classification accuracy assessment. Remote Sensing of Environment, 80(1), 185–201. https://doi.org/10.1016/S0034-4257(01)00295-4
- Forkuor, G., & Cofie, O. (2011). Dynamics of land-use and land-cover change in Freetown, Sierra Leone and its effects on urban and peri-urban agriculture – A remote sensing approach. International Journal of Remote Sensing, 32(4), 1017–1037. https://doi.org/10.1080/01431160903505302
- Garedew, E., Sandewall, M., Söderberg, U., & Campbell, B. M. (2009). Land-use and land-cover dynamics in the central rift valley of Ethiopia. Environmental Management, 44(4), 683–694. https://doi.org/10.1007/s00267-009-9355-z
- Geremew, A. A. 2013. Assessing the impacts of land use and land cover change on hydrology of watershed: A case study on Gigel-Abbay Watershed. Lake Tana Basin, Ethiopia.
- Gomez, C., White, J. C., & Wulder, M. A. (2016). Optical remotely sensed time series data for land cover classification: A review. ISPRS Journal of Photogrammetry and Remote Sensing, 116, 55–72. https://doi.org/10.1016/j.isprsjprs.2016.03.008
- Han, J., Hayashi, Y., Cao, X., & Imura, H. (2009). Evaluating land-use change in rapidly urbanizing China: Case study of Shanghai. Journal of Urban Planning and Development, 135(4), 166–171. https://doi.org/10.1061/(ASCE)0733-9488(2009)135:4(166)
- Hegazy, I. R., & Kaloop, M. R. (2015). Monitoring urban growth and land use change detection with GIS and remote sensing techniques in Daqahlia governorate Egypt. International Journal of Sustainable Built Environment, 4(1), 117–124. https://doi.org/10.1016/j.ijsbe.2015.02.005
- Herold, M., Goldstein, N. C., & Clarke, K. C. (2003). The spatiotemporal form of urban growth: Measurement, analysis and modeling. Remote Sensing of Environment, 86(3), 286–302. https://doi.org/10.1016/S0034-4257(03)00075-0
- Hurni, H., Tato, K., & Zeleke, G. (2005). The implications of changes in population, land use, and land management for surface runoff in the upper Nile basin area of Ethiopia. Mountain Research and Development, 25(2), 147–154. https://doi.org/10.1659/0276-4741(2005)025[0147:TIOCIP]2.0.CO;2
- Imbernon, J. (1999). Pattern and development of land-use changes in the Kenyan highlands since the 1950s. Agriculture, Ecosystems & Environment, 76(1), 67–73. https://doi.org/10.1016/S0167-8809(99)00061-4
- Jensen, J. R. (1996). Introductory digital image processing: A remote sensing perspective. Prentice-Hall Inc.
- Lambin, E. F., Geist, H. J., & Lepers, E. (2003). Dynamics of land-use and land-cover change in tropical regions. Annual Review of Environment and Resources, 28, 205–241. https://doi.org/10.1146/annurev.energy.28.050302.105459
- Lu, D., & Weng, Q. (2007). A survey of image classification methods and techniques for improving classification performance. International Journal of Remote Sensing, 28(5), 823–870. https://doi.org/10.1080/01431160600746456
- Mahendra, H., Shivakumar, B., & Praveen, J. (2015). Pixel-based classification of multispectral remotely sensed data using support vector machine classifier. IJIREEICE. doi: 10.17148/IJIREEICE
- Moriasi, D. N., Arnold, J. G., Van Liew, M. W., Bingner, R. L., Harmel, R. D., & Veith, T. L. (2007). Model evaluation guidelines for systematic quantification of accuracy in watershed simulations. Transactions of the ASABE, 50(3), 885–900. https://doi.org/10.13031/2013.23153
- Muzein, B. S. (2006). Remote sensing & GIS for land cover, land use change detection and analysis in the semi-natural ecosystems and agriculture landscapes of the central Ethiopian Rift Valley. Verlag nicht ermittelbar.
- Rawat, J., & Kumar, M. (2015). Monitoring land use/cover change using remote sensing and GIS techniques: A case study of Hawalbagh block, district Almora, Uttarakhand, India. The Egyptian Journal of Remote Sensing and Space Science, 18(1), 77–84. https://doi.org/10.1016/j.ejrs.2015.02.002
- Serra, P., Pons, X., & Saurí, D. (2008). Land-cover and land-use change in a mediterranean landscape: A spatial analysis of driving forces integrating biophysical and human factors. Applied Geography, 28(3), 189–209. https://doi.org/10.1016/j.apgeog.2008.02.001
- Setegn, S. G., Srinivasan, R., Dargahi, B., & Melesse, A. M. (2009). Spatial delineation of soil erosion vulnerability in the Lake Tana Basin, Ethiopia. Hydrological Processes: An International Journal, 23, 3738–3750. https://doi.org/10.1002/hyp.7476
- Sewnet, A. (2015). Land use/cover change at infraz Watershed, Northwestren Ethiopia. Journal of Landscape Ecology, 8(1), 69–83. https://doi.org/10.1515/jlecol-2015-0005
- Solaimani, K., Arekhi, M., Tamartash, R., & Miryaghobzadeh, M. (2010). Land use/cover change detection based on remote sensing data (A case study; Neka Basin). Agriculture and Biology Journal of North America, 1(6), 1148–1157. https://doi.org/10.5251/abjna.2010.1.6.1148.1157
- Tekle, K. (2001). Natural regeneration of degraded hillslopes in Southern Wello, Ethiopia: A study based on permanent plots. Applied Geography, 21(3), 275–300. https://doi.org/10.1016/S0143-6228(01)00006-6
- Ward, D., Phinn, S. R., & Murray, A. T. (2000). Monitoring growth in rapidly urbanizing areas using remotely sensed data. The Professional Geographer, 52(3), 371–386. https://doi.org/10.1111/0033-0124.00232
- Yalew, S. G., Mul, M. L., Van Griensven, A., Teferi, E., Priess, J., Schweitzer, C., & Van Der Zaag, P. (2016). Land-use change modelling in the Upper Blue Nile Basin. Environments, 3(4), 21. https://doi.org/10.3390/environments3030021
- Yonas, B., Beyene, F., Negatu, L., & Angassa, A. (2013). Influence of resettlement on pastoral land use and local livelihoods in southwest Ethiopia. Tropical and Subtropical Agroecosystems, 16, 103–117.
- Yuan, F., Sawaya, K. E., Loeffelholz, B. C., & Bauer, M. E. (2005). Land cover classification and change analysis of the Twin Cities (Minnesota) Metropolitan Area by multitemporal Landsat remote sensing. Remote Sensing of Environment, 98(2–3), 317–328. https://doi.org/10.1016/j.rse.2005.08.006
- Zeleke, G., & Hurni, H. (2001). Implications of land use and land cover dynamics for mountain resource degradation in the Northwestern Ethiopian highlands. Mountain Research and Development, 21(2), 184–191. https://doi.org/10.1659/0276-4741(2001)021[0184:IOLUAL]2.0.CO;2
- Zhang, T., Zhang, X., Xia, D., & Liu, Y. (2014). An analysis of land use change dynamics and its impacts on hydrological processes in the Jialing River Basin. Water, 6(12), 3758–3782. https://doi.org/10.3390/w6123758
- Zimale, F. A., Moges, M. A., Alemu, M. L., Ayana, E. K., Demissie, S. S., Tilahun, S. A., & Steenhuis, T. S. (2018). Budgeting suspended sediment fluxes in tropical monsoonal watersheds with limited data: The Lake Tana basin. Journal of Hydrology and Hydromechanics, 66(1), 65–78. https://doi.org/10.1515/johh-2017-0039