
 ?Mathematical formulae have been encoded as MathML and are displayed in this HTML version using MathJax in order to improve their display. Uncheck the box to turn MathJax off. This feature requires Javascript. Click on a formula to zoom.
Abstract
Nowadays, the land use and land cover change and its impacts are revealing on different natural resource and man-made systems. This study attempted to examine the land use and land cover (LULC) dynamics on this using multi-spectral satellite imageries in Geographical Information System (GIS) in the Kesem sub-basin of the Awash River Basin, Ethiopia. It also attempted to assess the community perceptions on this using field observation. Three LULC maps were produced by analyzing remotely sensed images of Landsat satellite imageries within three periods of time from 1986 to 2013. Supervised image classification was used to map LULC classes and explain the drivers, and causes were linked to the changes. The result from LULC maps of 2013 showed nine major land use and land cover types. From 1986 to 2000, there were, among others, a dramatic expansion of agricultural land, massive settlement, and widespread eucalyptus plantation, all of which contributed to a dramatic decrement of shrub land and acacia in the sub-basin. The major driving forces for these changes were population density and over-use of land. The major consequences are the degradation of biodiversity, and loss of natural resources. The significant need of new and sweeping land use policy whose key tenets involve conservation and rehabilitation of land resources and appropriate land use planning is offered to policymakers.
PUBLIC INTEREST STATEMENT
Unprecedented pace and magnitude of land use and land cover (LULC) change in the Ethiopian highlands are considered to be part of the major problems threatening agricultural development and food security in the country. However, knowledge about the dynamics and drivers behind these changes at the watershed level is limited. Hence, the integration of remotely sensed data with socioeconomic information in GIS has broadly considered. Many research in the world has focused on linking census and survey-based socioeconomic data to remotely sensed land use data, particularly for modeling the drivers of deforestation in rural areas. According to several authors, Awash River basin is the most important, intensively utilized, and environmentally susceptible basin, but evaluation of LULC dynamics at the Kesem sub-basin with combined tools of remote sensing and social-economic study was not studied. Hence, this study provides valuable data and baseline information to develop sustainable adaptation mechanisms and strategies to respond of LULC change and dynamic in the study area and other similar region in the globe.
Competing Interests
The authors declare no competing interests.
1. Introduction
The natural processes, socioeconomic aspects, and land exploitation by human activities in time and space determine the global environments cover pattern (Bhagawat, Citation2011; Lambin et al., Citation2001; Haregeweyn et al., Citation2015; Rahdary, Citation2008; Shiferaw & Singh, Citation2011; Zewdu et al., Citation2016; Zubair, Citation2006). Driving forces which similarly referred as factors can be categorized as natural and human-induced (Bekele et al., Citation2018; Shiferaw & Singh, Citation2011). As indicated in Belay et al. (Citation2014), land use changes are often driven spatially and temporally by biophysical and human directions. Moreover, it also varies spatially depending on location-specific factors (Beilin et al., Citation2014; Kindu & Schneider, Citation2015). The natural factors like rainfall intensity, steep relief, and soil types as well as climate change are also driving forces for land use changes (Belay et al., Citation2014; Goldewijk, Citation2001; Lakew et al., Citation2000; Reid et al., Citation2000). Among the identified human multi-way factors affecting territory, intensification of land use, increasing of farm size, and land tenure status derived by the increase in population density (Hailemariam et al., Citation2016; Seiferling et al., Citation2012; Weinzettel et al., Citation2013).
Land cover change has occurred in the global environments and is a severe process taking place on the surface of the earth (Showqi, Citation2013). According to Güler et al. (Citation2007) and Williams (Citation1990) as cited in Shiferaw and Singh (Citation2011), conversion of grassland, woodland, and forest into cropland and pasture has risen dramatically in the tropics. For instance, Gete (Citation2000) found a significant increase in cultivated land at the expense of forest land in the Dembecha area, northwest Ethiopia. And grassland, woodland, and other vegetated areas have increasingly been transformed into cropland in recent years (Millennium Ecosystem Assessment Panel (MEAP), Citation2005). A dramatic decrease in woodlands resulting from the expansion of cultivable land in the Central Rift Valley was reported by (Garedew et al., Citation2009). Also, Tsegaye et al. (Citation2010) found a rapid reduction in woodland and grassland cover and an increment of cultivated land which may lead to more land degradation trends in rangelands in the eastern part of Ethiopia. On the other hand, in the Chemoga Watershed, deforestation trend was decline through appropriate interventions by promoting the planting of local tree species between 1957 and 1998 (Woldeamlak, Citation2003). Similarly, Aklilu (Citation2007) concluded that in the Beressa watershed, there were substantial land use changes in the area during the second half of the 20th century. Asmamaw et al. (Citation2011) likewise revealed as an expansion of forest land in northeastern Ethiopia.
Sambou et al. (Citation2015) and Suzanchi and Kaur (Citation2011) analyzes development plans effects on land-related policies at local level to understand the ultimate need of land use/cover (LULC) changes and its driving forces. This information is important in determining the status of land and ecosystem health, and to promote decision focused on actions related to environmental recuperation. Thus, knowledge on LULC and options for their optimal use are vital for the selection, planning, and application of numerous development programs to meet the increasing demands for basic human needs (Haregeweyn et al., Citation2015; Zewdu et al., 2016).
The integration of remotely sensed data with socioeconomic information in GIS has broadly considered (Fox et al., Citation2003). Many research in the world has focused on linking census and survey-based socioeconomic data to remotely sensed land use data, particularly for modeling the drivers of deforestation in rural areas (Dadhich & Hanaoka, Citation2010; Dongjie et al., Citation2008; Geoghegan et al., Citation2001; Dong et al., Citation2008; Zhang et al., Citation2011). However, with regard to understanding the relationship between the cause of change and their driving forces need to be fully addressed (Bekele et al., Citation2018; Kindu & Schneider, Citation2015). One of the major driving forces leading to changes in land cover characteristics is anthropic activity (Mao & Cherkauer, Citation2009). Studies of rates, extents, patterns, causes, and implications of LULC dynamics at basin level can then provide an opportunity to design appropriate land management practices, strategies, and policies and also to implicate the consequential hazards on the natural ecosystem. However, knowledge about the dynamics and driving forces behind these changes at the Kesem sub-basin in particular and Awash River basin, in general, is limited.
According to several authors (Bekele et al., Citation2018; Belay et al., Citation2014; Belete & Semu, Citation2013; Edossa et al., Citation2010; Kinfe, Citation1999), Awash River basin is the most important, intensively utilized and environmentally susceptible basins in Ethiopia, but evaluation of LULC dynamics at the Kesem sub-basin in particular and Awash River basin in general with combined tools of remote sensing and social-economic study was not studied. In the Awash River basin, Kesem sub-basin is one significant example where information gap subsists regarding LULC changes; however, the stream is the main watercourse to the hydrological processes of the river.
This study provides valuable data and baseline information in order to develop sustainable adaptation mechanisms and strategies to respond to the LULC change and dynamic in the study area. Hence, the objective of this study is to evaluate the extent and rate of LULC dynamics and to assess local people perception on LULC change and evaluates its causes and consequences in Kesem sub-basin of the Awash River basin in Ethiopia.
2. Material and methods
2.1. Study area
Kesem sub-basin is situated in the middle Awash River basin in the range of 39º58΄E to 8º55΄N in the Eastern part of Ethiopia. Its area coverage is about 2,325 km2 (Figure ). It is bordered by mountains and plateaus in its northern part. Higher mountains exist at the upper margin and depressed landform at the lower. The elevation ranges from 838 to 3537 m above sea level. According to the World Reference Base for Soil Resources (WRB) (Otto & Josef, Citation2000) soil classification system, six soil types are identified in the sub-basin, namely: chromic luvisols, eutric cambisol, eutric leptosols; eutric vertisols, lithic leptosols, and vertic cambisol. The lithic leptosols occupy the steep mountainous slopes while eutric cambisol and vertic cambisol are situated on flat and gentler slopes.
Figure 1. Location and elevation map of the study area.
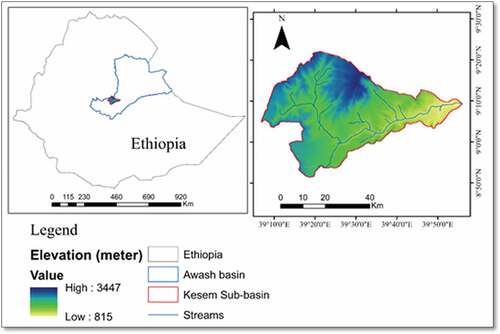
The climate system of the sub-basin is characterized by a semi-arid to sub-humid climates with the majority falling in the sub-humid zone in the northern and northwest and at semi-arid in the north and southeast with receiving a mean annual rainfall of 1009 mm and 534 mm, respectively. The mean annual maximum and minimum temperatures are 26.8°C and 10.56°C, respectively.
2.2. Methods
2.2.1. Data collection and image processing
The images with 30 m resolution and cloud-free were collected from US Geological Survey (USGS) Center for Earth Resources Observation and Science (EROS). Landsat images, Landsat-5 TM 1986, Landsat-7 ETM+ 2000, and Landsat-8 OLI_TIRS 2013 with Path 168, Row 053 were downloaded and used in this analysis. The images were selected by historical events such as physical environmental factors, resource donations, and availability of TM multi-temporal satellite images. Three bands of landsat imageries were used to detect changes in LULC distribution in the Kesem sub-basin for a period of 27 years. These sensors have a spatial resolution of 30 m for all bands (Campbell and Wynne (Citation2011)). For its classification, ground control points were collected by global positioning system (GPS) and assisted with topo sheet map of 1:50.000 scale as base map to register the geo-database environment and facilitate further analysis.
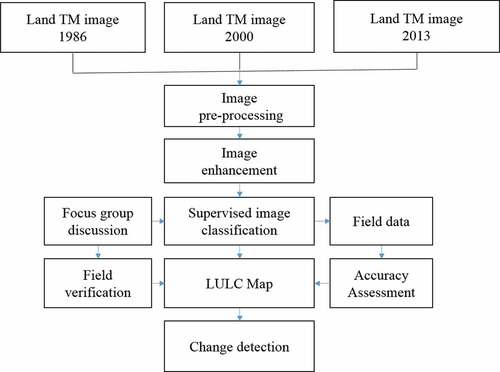
The image pre-processing was made using ArcGIS 10.5 and ERDAS IMAGINE 16.5 software. The area of study was masked using the boundary of the catchment. A bisect field study was conducted between May 2017 and July 2017 utilizing draft-classified maps derived from satellite images with reference years, topographic maps, and Google Earth as guides. Besides, supervised digital image classification technique was employed, complemented with field surveys that provided on the ground information regarding each site. The supervised classification method for land use and land cover dynamics analyses with spatio-temporal changes were monitored by analyzing multi-temporal remotely sensed images of three dates of Landsat satellite imageries. A combined procedure was developed to interpret, analyze, map, and quantify the collected data (Figure ).
Figure 2. Flow chart showing the general methodology of land use/cover evaluation (Source: Bekele et al., Citation2018).
Predefined sampling points within the selected area of the sub-basin were randomly assigned using Arc GIS 10.5 for accuracy assessment. The combined sub-basin shape file and predefined sampling points were converted to KML file to import the data to google earth. After importing to google earth, just by zooming out, LULC types were targeted and recorded. Hence, predefined sampling points falling LULC types were used for field data collection. Therefore, depending on this, a total of 120 sampling points covering all selected areas of sub-basin were generated for sample collection. During survey work, the pre-defined sample locations were surveyed in the field and the location were geo-referenced using the GPS receiver (GARMIN GPS 72TM) with Arc GIS 10.5. Once the sampling points are navigated and reached, description of the selected study basin was performed through LULC types and analysis of the confusion matrix was done as per Campbell and Wynne (Citation2011). These were done by classifying the selected area in three classes (higher, middle, and lower) depending on its topography, slope, agroecology, and soil heterogeneity.
The extent and trends of each LULC category changes were computed for the respective periods of the study. Lastly, transformation matrices of the three time periods (1986–2000, 2000–2013, and 1986–2013) were examined according to Braimoh (Citation2006) and Pontius et al. (Citation2004) from the three succeeding LULC maps of the sub-basin with ArcGIS by overlay analysis technique. LULC changes in percentage were calculated according to Braimoh (Citation2006) using Equation (Equation1(1)
(1) ).
Confusion matrix was used to assess the classification accuracy and indicates the nature of the classification error. The produced accuracy was figured by dividing the total number of correct pixels in a category to the total number of pixels to that group as derived from the reference data. These statistics values express the probability of reference pixel being correctly classified in the classified image and is a measure of omission error. The producer’s accuracy indicates how well a certain area can be categorized (Usman et al., Citation2015). Also, the user’s accuracy was computed by dividing the total number of correct pixels in a category to the total number of pixels that were actually classified in that category. We obtained kappa coefficient (EquationEquation 2(2)
(2) ) following the procedure by Usman et al. (Citation2015).
k = number of columns and rows, in error matrix
n = number of observations in error matrix
nii = main diagonal component in class i
ni+ = total number of observations in row i (right margin)
n+i = total number of observations in column i (bottom margin)
The result of the user’s accuracy represents the probability of a pixel classified on the map in a category existing on the ground-truthing information and is a measure of commission error (Lu et al., Citation2013).
A Focus Group Discussion (FGD) was used to obtain qualitative information from a limited number of community members in the area. Purposively, eight household heads of which six of them were female were selected for their longer years of experience of land use and land cover practices. The Focus Group Discussion was conducted in three phases. All focus groups had a skilled facilitator who directed the contestants through sets of prepared questionnaire. The indicated drives and causes for LULC change of the study area by focus group discussion were identified and categorized as drivers and causes based on literature (Bekele et al., Citation2018). For each indicated drives and causes, the total value was given using pair-wise status. Though focused on indicating the specific changes and causes, dialogues were flexible and considered mainly to identify associations to the LULC change. Related literature was also used to indicate the scale and possibility of the major drivers (e.g., Bekele et al., Citation2018; Sambou et al., Citation2015).
3. Results and discussion
3.1. Accuracy assessment
As it is presented in Table , the overall accuracy and kappa coefficient are 85.205% and 0.824%, respectively. This shows that 85.205% of the land use and land cover classes are correctly classified. The user accuracy of individual classes ranges from 100% for water body to 73.78% for grass land. Producer accuracy is also ranging from 96.50% for water body to 77.50% for Eucalyptus. The overall accuracies shown from the images process were greater than 85% minimum threshold set by Anderson et al. (Citation1976) and Thomlinson et al. (Citation1999) for existent LULC change analysis.
Table 1. Confusion matrix of land use/cover classification
3.2. Land use/cover dynamics
After accuracy assessment was checked, the geographical database was created, and all spatial datasets within a shaped corresponding to the three reference years were stored and temporal changes in land use and land cover were detected. Using the application of image classification methods, six (in 1986), seven (in 2000), nine (in 2013) major land use/cover types were identified in Kesem sub-basin. This includes Agricultural land, acacia, shrub, forest, grassland, bare land, eucalyptus, settlement, and water body, based on the characteristics of Landsat satellite images of the years 1986, 2000, and 2013 as described in Table .
Table 2. Description of each land use/cover type in the study area
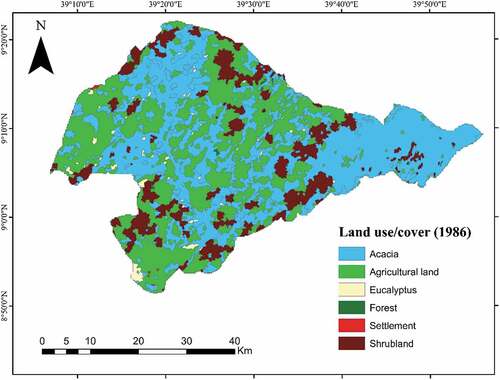
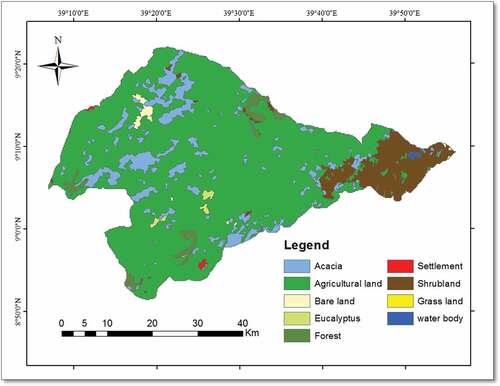
In the landsat images 1986, as shown in Figure , the greatest share of land use/cover from all classes is acacia, which covers an area of 1077 km2, contributes 46.32% of the total basin area. Agricultural land and shrub land cover an area of 870 km2 (37.42%) and 347 km2 (14.92%) respectively. The surface covered by eucalyptus, forest, and settlement was 26.00 km2 (1.12%), 3.00 km2 (0.13%), and 2 km2 (0.09) of the total area of the sub-basin. This shows that 62.373% of the total area of the sub-basin was covered by acacia, shrub land, forest, and eucalyptus in 1986 and the remaining 37.627% was covered by agricultural land and settlement, which indicates that much of the area was slightly covered by green plantation in 1986.
Figure 3. LULC map of the Kesem sub-basin in 1986.
Agricultural lands in the sub-basin have significantly increased in the year 2000 from all types, which covers an area of 1499 km2 (64.47%). Shrub land, acacia, and eucalyptus covered an aerial size of 277 km2 (11.91%), 497 km2 (21.38%), and 34 km2 (1.46%) respectively. The smallest aerial coverage was forest and settlement, which accounts for only 1 km2 (0.04%) and 3 km2 (0.13%) respectively, from the total area of the sub-basin. Bare land was created due to the serious decline of acacia and shrub land because of the severity of drought in the area in the time period between these years. The fast growth of agriculture up to 64.47% was due to the conversion of acacia and shrub land because of rapid population growth in the study area as explained by the Central Statistical Agency of Ethiopia (CSA, Citation2013).
From 1986 to 2000 (Figures and ) Agricultural land increased with a rate of 44.93 km2/year and further increased (Figure ) with a rate of change 22.85 km2/year (2000 to 2013) to totally 67.78 km2/year (1986 to 2013). The expansion of agricultural land was due to the areal reduction of acacia and shrub land, forest land, and grass land as it is explained in Table . Tekle and Hedlund (Citation2000) also suggested that the expansion of farmland and firewood harvesting must have contributed to the deterioration of shrub land.
Table 3. Land use/cover change in Kesem sub-basin from 1986 to 2013
Figure 4. LULC map of the Kesem sub-basin in 2000.
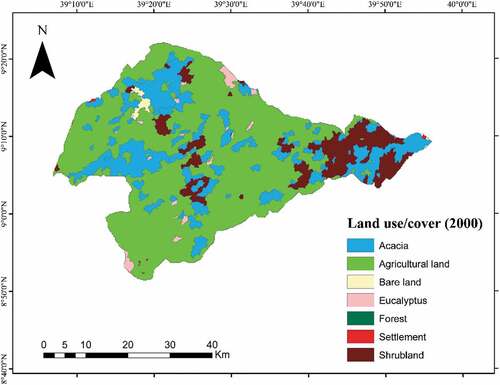
Figure 5. LULC map of the sub-basin in 2013.
As shown in Figure , from the year 1986 to 2000 shrub land, forest, and acacia had been changed to agricultural land. Also, between 2000 and 2013, acacia, eucalyptus, and shrub land had been changed to agricultural land. This shows that there was a dramatic expansion of agricultural land within the specified time period because of population pressure and poor land management. The expansion of agricultural land between 1986 and 2013 in the sub-basin, in general, could be directly related to rapid population growth. According to Desalegn et al. (Citation2014), Agricultural land expansion at the expense of shrub land mainly due to rapid population growth and their demand for diverse products and cultivable fertile soils. Indeed, Garedew et al. (Citation2009) suggested that some of the factors that determined cropland expansion were the rapidly increasing population pressure and declining soil productivity. Similarly, Asmamaw et al. (Citation2011) and Mao and Cherkauer (Citation2009) concluded that population growth and the farmers’ inability to pay for modern agricultural inputs largely contributed to cultivating land expansion.
On the contrary, acacia and shrub land had decreased from 1986 to 2000 with 35.5 and 19.79 km2/year rate with a further decrease in 2013 (Figure ) with rate of 19.62 and 5.46 km2/year. These changes were induced by the conversion of acacia and shrub land to agricultural land in the time period (1986 to 2000) and to bare land and agricultural land between 2000 and 2013 and even to rural and urban settlements, grass land, and forest. The massive reduction of acacia and shrub land particularly between 1986 and 2000 was due to lack of sustainable land management and population pressure for firewood, house construction, and selling.
Similarly, forest land was reduced in size between 1986 and 2000 with a rate of 0.14 km2/year but it increases between 2000 and 2013 with a rate of 3.70 km2/year. This is due to the emphasis of the Ministry of forest, environment, and climate change on environmental protection to reduce climate change implication on agriculture in the countryside after the mid-1980s. This also confirmed by Aklilu et al. (Citation2007) and Belay et al. (Citation2014) as forest land trend showed increasing in 2010s. Whereas eucalyptus was continuously increased with a rate of 0.57 km2/year from 1986 to 2000 and then further decreased with a rate of 3.10 km2/year from 2000 to 2013; this is due to firewood, house construction, and selling.
Grass land and water body slightly increased in the sub-basin during the study period. In 1986 to 2000, there was almost no grass land and water body cover in the sub-basin. However, 0.01 km2 (0.0004%) and 3 km2 (0.13%) grass land and water body were appeared in 2013, respectively (Tables and ). Probably, this was due to the decline of shrub and acacia and the construction of Kesem dam reservoir at downstream and other man-made pond formation in the sub-basin. The land use/cover trend analysis made for the two consecutive periods has indicated that the sub-basin was subjected to considerable land use changes (Figure ).
Table 4. Land use/cover transition matrix area in km2 and percent from 1986 to 2013
3.3. Causes of land use/cover dynamics and community perceptions on its change
LULC changes are manifested through conversion and modification, which are caused by interactions between climatic and anthropogenic forces owing to its inherently complex nature (Berakhi, Citation2013; Lambin et al., Citation2003). Even though LULC change is affected by climatic change, it is a primary cause for environmental and climatic changes (Janet & Simpson, Citation2003; Loveland, Citation2003). In the study area, LULC change drivers, causes, and its effects were debated by the focus group discussions.
Expansion of Agricultural lands, Eucalyptus, and settlement, decreasing of acacia, decreasing of shrub land and forest occurred in the study area because of different drivers as described in (Table ). The demographic driver is partly responsible for the expansion of Agricultural lands and settlement, decreasing of acacia and shrub land. The biophysical driver has a role in an expansion of Agricultural land and settlements and decreasing of acacia, decreasing of shrub land. Expansion of Agricultural lands and settlement, decreasing of acacia, decreasing of shrub land have also affected by economic and cultural drivers. Moreover, policy and institution drivers have accountable for improving plantation, expansion of Agricultural lands and settlement, decreasing of acacia and shrub land as stated by the focus group discussion.
Table 5. Land use/cover change drivers and effects as perceived by the local people
According to key informants and local administrators of the sub-basin, the main causes of LULC change revealed during focus group discussions were population growth. According to the Central Statistical Agency of Ethiopia (CSA, Citation2013), the total population size of the sub-basins “woreda” (local administrative unit) in the basin shows an increasing trend by 28.6% from 1986 to 2013. Besides population growth, lack of job opportunity (number of unemployment) for the young generation apart from agriculture in the study area, cultivation of extra land including marginal and incline area, results were deliberated as a cause of LULC change.
A recent study of long-term precipitation analysis in the study area indicated high variability trend (CV> 35%) especially for short growing season even though the amount of rainfall in the main season shows an increasing trend (Dame et al., Citation2020). Precipitation is the main source of agricultural water in the sub-basin. When rainfall is scarce, farmers be unsuccessful to produce crops since irrigation is not practiced popularly in the area. Therefore, many peoples are driven to exploit acacia and shrub land resources to increase income through the sale of firewood material and this often influences land use system. Deterioration of soil fertility is also considered as a cause because the population pressures and other causes forced farmers enormously to exploit their limited land without a fallow period and agricultural input leads to soil fertility degradation.
During a significant reduction of Agricultural products, farmers turn to search other land use types, especially to peripheral and sloppy land to cultivate. The communities in the study area are completely dependent on acacia products for firewood, that is, for cooking. As a result, deforestation of existing acacia, forests, and shrubs is enormous. Consequently, frequent flood, land degradation, loss of wildlife, decline in agricultural production, and subsequent reduction of farm-income are mentioned by the community members during focus group discussions. Also, numerous studies suggested that population pressure related problems are the main drivers for land use/cover changes in most developing regions of the globes (Asmamaw et al., Citation2011; Boakye et al., Citation2008; Brink & Hugh Douglas, Citation2011; Cadjoe Samuel, Citation2007; Desalegn et al., Citation2014; Monica et al., Citation2007; Mundia & Aniya, Citation2006; Musamba et al., Citation2011; Tolo et al., Citation2012; Wasige et al., Citation2013).
According to FAO (Citation2004), land use/cover has been changed due to livelihoods of the surrounding community by the state of land degradation and its causes. Land degradation that is caused by the community’s ways of land use/cover changes as well as the population density is a major driver for the land use/cover change. In the study area, the increment of poverty and migration toward the area increased over the past many decades. This, in turn, exacerbated the decline of productivity of the lands, the loss of biodiversity, deterioration of water cycle, and carbon storage capacity of the lands.
During the focus group discussions of the community members, the destruction of the acacia trees and shrubs was interpreted as a cause for the shortage of firewood and of woods for construction materials. This, in turn, caused them to use crop residues and organic manures for cooking and heating. The latter, sequentially, caused the loss of the fertility and productivity of the cropland because it led to the depletion of the organic matter in the soils. Such practices further engendered severe soil erosion and land degradation (Belay, Citation2002).
4. Conclusions and recommendations
This study attempted to examine LULC changes in Kesem sub-basin. The study has revealed that LULC conversions are taking place especially since the past few decades, which resulted in the increase in spatial extents of agricultural land, settlement, and eucalyptus while acacia, forest, and shrub land showed decrease in the sub-basin from 1986 to 2000. The period from 2000 to 2013 shows similar changes in agricultural land, settlement, shrub land, and acacia, but forest showed an expansion and eucalyptus showed a decrease in coverage. However, bare land was created due to the serious decline of acacia and shrub land in the sub-basin. In 2013, grassland and water body were created when compared to the year 2000. This was due to the decline of shrub and acacia and the construction of Kesem dam reservoir at downstream and other man-made pond formation in the sub-basin.
The study implies a significant decline of the natural ecosystem, leading to environmental hazards. As a result of focus group discussion, population pressure, lack of job opportunity, rainfall variability, deterioration of soil fertility, lack of firewood, and a shortage of fertile agricultural land are the main drivers and causes of LULC change in the sub-basin. Therefore, future efforts in addition to the ongoing sustainable land management approach are needed for the creation of new job opportunities for the young generation in other sectors apart from agriculture and reduce land pressure. Other areas of intervention are the start of affordable technologies to improve productivity and improving soil fertility, improved irrigation infrastructure, and environmentally sound soil, water, and natural ecosystem conservation practices.
All these suggestions imply that there is an urgent need of new and sweeping land use policy whose key tenets involve conservation and rehabilitation of land resources, use of monitoring and early warning system, commitment to international conventions on land use, investments in land and water resources and appropriate land use planning.
Acknowledgements
The authors would like to acknowledge the Ethiopian Ministry of Water Resources, Irrigation, and Electricity for providing the remote sensing data. We acknowledge two anonymous reviewers and the editor for their valuable comments on the manuscript clearer.
Disclosure statement
The authors declare no conflict of interest.
Additional information
Funding
Notes on contributors
Negash Tessema
Negash Tessema is a lecturer and researcher in Irrigation Engineer at Haramaya University having experience in project design and evaluation. His research interests lie in the field of Irrigation water management and design, remote sensing and GIS, hydrological modeling, and climate modeling.
Asfaw Kebede
Asfaw Kebede (PhD) is an associate professor in hydrology and water resource engineer at Haramaya University having experience in project evaluation and served as a member of the evaluating team for Land Use and Land Cover (LULC) dynamics, as a researcher, guiding postgraduate students and evaluating government interventions in LULC impacts through postgraduate research and government-funded project. Land use and land cover dynamics related research outcomes were published in scientific journals.
Dame Yadeta
Dame Yadeta is a lecturer and researcher in Irrigation Engineer at Samara University having experience in project design and evaluation. He is a reviewer for international and local journals. His research interest is on Irrigation water management and design, hydrological modeling, climate modeling, and remote sensing and GIS.
References
- Aklilu, A., Stroosnijder, L., & Graaff, J. D. (2007). Long-term dynamics in land resource use and the driving forces in the Beressa watershed, highlands of Ethiopia. Journal of Environmental Management, 83(4), 448–459. https://doi.org/10.1016/j.jenvman.2006.04.010
- Anderson, J. R., Hardy, E. E., Roach, J. T., & Witme, R. R. E. (1976). A land use and land cover classification system for use with remote sensor data (USGS professional paper 964). United States government printing office.
- Asmamaw, L. B., Mohammed, A. A., & Lulseged, T. D. (2011). Land use/cover dynamics and their effects in the Gerado catchment, northeastern Ethiopia. International Journal of Environmental Studies, 68(6), 883–900. https://doi.org/10.1080/00207233.2011.637701
- Beilin, R., Lindborg, R., Stenseke, M., Miguel, H., Llausàs, A., Slätmo, E., & Queiroz, C. (2014). Analysing how drivers of agricultural land abandonment affect biodiversity and cultural landscapes using case studies from Scandinavia, Iberia and Oceania. Land Use Policy, 36, 60–17. https://doi.org/10.1016/j.landusepol.2013.07.003
- Bekele, D., Alamirew, T., Kebede, A., Zeleke, G., & Melesse, A. (2018). Land use and land cover dynamics in the Keleta watershed, Awash River basin, Ethiopia, Environmental Hazards. 18(3), 246-265. https://doi.org/10.1080/17477891.2018.1561407
- Belay, S., Amsalu, A., & Abebe, E. (2014). Land use and land cover changes in Awash National Park, Ethiopia: Impact of decentralization on the use and management of resources. Open Journal of Ecology, 4(15), 950–960. https://doi.org/http://dx.doi.10.4236/oje.2014.415079
- Belay, T. (2002). Land-cover/land-use changes in the Derekolli catchment of south Wello zone of Amhara region, Ethiopia. Eastern Africa Social Science Research Review.
- Belete, B., & Semu, A. (2013). Background report: Hydro-meteorological trends analysis, coping with water scarcity the role of agriculture developing a national water audit for Awash Basin, Ethiopia.
- Berakhi, R. O. (2013). Implication of human activities on land use land cover dynamics in KageraCatchment, East Africa. [MSc. Thesis]. Geography and Environmental Resources. SouthernIllinois University Carbondale, Illinois.
- Bhagawat, R. (2011). Application of remote sensing and GIS, land use/land cover change in Kathmandu Metropolitan City, Nepal. Journal of Theoretical and Applied Information Technology, 23(2), 80–86.
- Boakye, E., Odai, S. N., Adjei, K. A., & Annor, F. O. (2008). Landsat images for assessment of the impact of land use and land cover changes on the Barekese catchment in Ghana. European Journal of Scientific Research, 22(2), 269–278.
- Braimoh, A. K. (2006). Random and systematic land-cover transitions in northern Ghana. Agriculture, Ecosystems & Environment, 113(1–4), 254–263. https://doi.org/10.1016/j.agee.2005.10.019
- Brink, B., & Hugh Douglas, E. (2011). The potential use of high resolution land satellite data for detecting land cover change in the Greater Horn of Africa. International Journal of Remote Sensing, 32(21), 5981–5995. https://doi.org/10.1080/01431161.2010.499382
- Cadjoe Samuel, N. A. (2007). Integrating remote sensing, GIS, census, and socioeconomic data in studying the population-land use/cover nexus in Ghana: A literature update. Africa Development, XXXII(2), 197–212. doi: 10.4314/ad.v32i2.57188
- Campbell, J. B., & Wynne, R. H. (2011). Introduction to remote sensing (5th ed.). Guilford Press.
- CSA. (2013). Population projection of Ethiopia for all regions at Wereda level from 2014–2017. Federal Democratic Republic of Ethiopia.
- Dadhich, P., Hanaoka, Sh. (2010). Remote sensing, GIS and Markov's method for land use change detection and prediction of Jaipur district. Journal of Geomatics, 4(1),9-15.
- Dame, Y., Asfaw, K., & Negash, T. (2020). Climate change posed agricultural drought and potential of rainy season for effective agricultural water management, Kesem sub-basin, Awash Basin, Ethiopia. Theoretical and Applied Climatology, 139(3–4), 653-666. https://doi.org/10.1007/s00704-020-03113-7
- Desalegn, T., Cruz, F., Kindu, M., Turrión, M. B., & Gonzalo, J. (2014). Land-use/land-cover (LULC) change and socioeconomic conditions of local community in the central highlands of Ethiopia. International Journal of Sustainable Development and World Ecology, 21(5), 406–413. https://doi.org/10.1080/13504509.2014.961181
- Dong, H., Yuri, K., Weile, W., Donald, W., Deering, Pauline, S., Nikolay, Sh., Bin, T., Ranga, B. Myneni. (2008). Stochastic transport theory for investigating the three-dimensional canopy structure from space measurements. Remote Sensing of Environment, 112, 35-50.
- Dongjie, G., Weijun, G., Kazuyuki, W., Hidetoshi, F. (2008). Land use change of Kitakyushu based on landscape ecology and Markov model. Journal of Geographical Sciences, 18, 455–468.
- Edossa, D. C., Babel, M. S., & Gupta, A. D. (2010). Drought analysis in the Awash River Basin, Ethiopia. Water Resources Management, 24(7), 1441–1460. https://doi.org/10.1007/s11269-009-9508-0
- FAO. (2004). Methodological framework for Land Degradation Assessment in Dry lands (LADA), FAo, land and water development division. Rome.
- Fox, J., Rindfuss, R. R., Walsh, S. J., & Mishra, V. (2003). People and the environment: Approaches for linking household and community surveys to remote sensing and GIS. Kluewer Academic Publishers.
- Garedew, E., Sandewall, M., Söderberg, U., & Campbell, B. M. (2009). Land-use and land-cover dynamics in the central rift valley of Ethiopia. Environmental Management, 44(4), 683–694. https://doi.org/10.1007/s00267-009-9355-z
- Geoghegan, J., Villar, S. C., Kelpeis, P., Mendoza, P. M., Ogneva-Himmel Berger, Y., Chowdhury, R. R., Turner, B. L., & Vance, C. (2001). Modeling tropical deforestation in the southern Yucatan Peninsular Region: Comparing survey and satellite data. Agriculture. Ecosystems and Environment, 85(1), 25–46. https://doi.org/10.1016/S0167-8809(01)00201-8
- Gete, Z. (2000). Landscape dynamics and soil erosion process modeling in the North- Western Ethiopian Highlands (African studies series A16). University of Berne. Geographical Bernesia.
- Goldewijk, K. K. (2001). Estimating global land use change over the past 300 years: The HYDE database. Global Biogeochemical Cycles, 15(2), 417–433. https://doi.org/10.1029/1999GB001232
- Güler, M., Yomralioğlu, T., & Reis, S. (2007). Using landsat data to determine land use/land cover changes in Samsun, Turkey. Environmental Monitoring and Assessment, 127(1–3), 155–167. https://doi.org/10.1007/s10661-006-9270-1
- Hailemariam, S. N., Soromessa, T., & Teketay, D. (2016). Land use and land cover change in the Bale Mountain Eco-Region of Ethiopia during 1985 to 2015. Land, 5(4), 41. https://doi.org/10.3390/land5040041
- Haregeweyn, N., Tesfaye, S., Tsunekawa, A., Tsubo, M., Tsegaye, D., Adgo, E., & Elias, A. (2015). Dynamics of land use and land cover and its effects on hydrologic responses: Case study of the Gilgel Tekeze catchment in the highlands of Northern Ethiopia. Environmental Monitoring and Assessment, 187(1), 2–14. https://doi.org/10.1007/s10661-014-4090-1
- Janet, G., & Simpson, C. (2003). Human contribution and responses to environmental change, in strategic plan for the U.S. climate change science program. A Report by the Climate Change Science Program andthe Subcommittee on Global Change Research, (p. 33).
- Kindu, M., & Schneider, T. (2015). Drivers of land use/land cover changes in Munessa-Shashemene landscape of the south-central highlands of Ethiopia. Environmental Monitoring and Assessment, 187(7), 1–17. https://doi.org/10.1007/s10661-015-4671-7
- Kinfe, H. (1999). Impact of climate change on the water resources of Awash River basin, Ethiopia. Climate Research, 12, 91–96. https://doi.org/10.3354/cr012091
- Lakew, D., Menale, K., Benin, S., & Pender, J. (2000). Land degradation and strategies for sustainable development in the Ethiopian highlands: Amhara Region (Socio-economic and policy research working paper 32). p. 122. ILRI.
- Lambin, E. F., Geist, H. J., & Lepers, E. (2003). Dynamics of land-use and land-cover change in tropical regions. Annual Review of Environment and Resources, 28(1), 205–241. https://doi.org/10.1146/annurev.energy.28.050302.105459
- Lambin, E. F., Turner, B. L., Geist, H. J., Agbola, S. B., Angelsen, A., Bruce, J. W., Xu, J., Dirzo, R., Fischer, G., Folke, C., George, P. S., Homewood, K., Imbernon, J., Leemans, R., Li, X., Moran, E. F., Mortimore, M., Ramakrishnan, P. S., Richards, J. F., Skånes, H., & Xu, J. (2001). The causes of land-use and land-cover change: Moving beyond the myths. Global Environmental Change, 11(4), 261–269. https://doi.org/10.1016/S0959-3780(01)00007-3
- Loveland, T. (2003). Land use and land cover. In Strategic plan for the US climate change science program (pp. 63–70). United States Geological Survey, Chapter 6.
- Lu, D., Li, G., Moran, E., & Hetrick, S. (2013). Spatiotemporal analysis of land-use and land-cover change in the Brazilian Amazon. International Journal of Remote Sensing, 34(16), 5953–5978. https://doi.org/10.1080/01431161.2013.802825
- Mao, D., & Cherkauer, K. A. (2009). Impacts of land-use change on hydrologic responses in the Great Lakes region. Journal of Hydrology, 374(1), 71–82. https://doi.org/10.1016/j.jhydrol.2009.06.016
- Millennium Ecosystem Assessment Panel (MEAP). (2005). Ecosystems and human well-being, ecosystems and human well-being: Synthesis. Island Press.
- Monica, G., Twine, W., & Vogel, C. (2007). Land cover change and human environment interactions in a rural cultural land scape in South Africa. The Geographical Journal, 173(1), 26–42. https://doi.org/10.1111/j.1475-4959.2007.00227.x
- Mundia, C. N., & Aniya, M. (2006). Dynamics of Land use/cover changes and degradation of Nairobi city, Kenya. Land Degradation and Development, 17(1), 97–108. https://doi.org/10.1002/ldr.702
- Musamba, B., Yonika, M., & Emmanuel, K. (2011). Boon and Richard, Giliba A. Journal of Human Ecology, 35(3), 143–154. https://doi.org/10.1080/09709274.2011.11906400
- Otto, C. S., & Josef, D. (2000). World reference base for soil resources. An introduction with special reference to soils of tropical forest ecosystems (Working paper and preprint, 95/14). ISSS-ISRIC-FAO.
- Pontius, R. G., Shusas, E., & McEachern, M. (2004). Detecting important categorical land changes while accounting for persistence. Agriculture, Ecosystems & Environment, 101(2–3), 251–268. https://doi.org/10.1016/j.agee.2003.09.008
- Rahdary, V. (2008). Land use and land cover change detection of Mouteh wildlife refuge using remotely sensed data and geographic information system. World Applied Sciences Journal, 3(1), 113–118.
- Reid, R. S., Kruska, R. L., Muthui, N., Taye, A., Wotton, S., Wilson, C. J., & Mulatu, W. (2000). Land use and land cover dynamics in response to in climatic, biological and sociopolitical forces: The case of Southern Ethiopia. Journal of Landscape Ecology, 15(4), 339–355. https://doi.org/10.1023/A:1008177712995
- Sambou, S., Lykke, A. M., Sambou, H., Guiro, I., Sambou, B., & Mbow, C. (2015). Land use-land cover change and drivers of deforestation in the Patako protected area (Center-West of Senegal). American Journal of Environmental Protection, 4(6), 306–317. https://doi.org/10.11648/j.ajep.20150406.17
- Seiferling, I. S., Proulx, R., Peres Neto, P. R., Fahrig, L., & Messier, C. (2012). Measuring protected area isolation and correlations of isolation with land use intensity and protection status. Conservation Biology, 26(4), 610–618. https://doi.org/10.1111/j.1523-1739.2011.01674.x
- Shiferaw, A., & Singh, K. L. (2011). Evaluating the land use and land cover dynamics in Borena Woreda of South Wollo Highlands, Ethiopia. Sustainable Development in Africa, 2(1), 87–107.
- Showqi, I. (2013). River Jhelum ecosystem: Land use land cover dynamics as a function of changing demography and hydrology. Geo Journal Spatially Integrated Social Sciences and Humanities, 79(3), 297-307. https://doi.org/10.1007/s10708-013-9494-x
- Suzanchi, K., & Kaur, R. (2011). Land use land cover change in National Capital Region of India: A remote sensing and GIS based two decadal spatial-temporal analyses. Procedia - Social and Behavioral Sciences, 21, 212–221. https://doi.org/10.1016/j.sbspro.2011.07.044
- Tekle, K., & Hedlund, L. (2000). Land cover changes between 1958 and 1986 in Kalu district, Southern Wello, Ethiopia. Mountain Research and Development, 20(1), 42–51. https://doi.org/10.1659/0276-4741(2000)020[0042:LCCBAI]2.0.CO;2
- Thomlinson, J. R., Bolstad, P. V., & Cohen, W. B. (1999). Coordinating methodologies for scaling land cover classifications from site-specific to global. Remote Sensing of Environment, 70(1), 16–28. https://doi.org/10.1016/S0034-4257(99)00055-3
- Tolo, C. U., & Enock, A. M., & Joseph pefect. (2012). Changing trends of natural resources degradation in kagera basin; Cast study of Kagera Sub-Basin, Uganda. Natural Resources, 3(3), 95–106. doi: 10.4236/nr.2012.33014
- Tsegaye, D., Moe, S. R., Vedeld, P., & Aynekulu, E. (2010). Land-use/cover dynamics in northern Afar rangelands, Ethiopia. Agriculture, Ecosystems & Environment, 139(1–2), 174–180. https://doi.org/10.1016/j.agee.2010.07.017
- Usman, M., Liedl, R., Shahid, M. A., & Abbas, A. (2015). Land use/land cover classification and its change detection using multi-temporal MODIS NDVI data. Journal of Geographical Sciences, 25(12), 1479–1506. https://doi.org/10.1007/s11442-015-1247-y
- Wasige, J., Goren, E., Thomas, A., Eric, S., & Victor, J. (2013). Monitoring basin scale land cover changes in Kagera Basin of Lake Victoria using ancillary data and remote sensing. International Journal of Applied Earth Observation and Geo Information, 21, 32–42. https://doi.org/10.1016/j.jag.2012.08.005
- Weinzettel, J., Hertwich, E. G., Peters, G. P., Steen-Olsen, K., & Galli, A. (2013). Affluence drives the global displacement of land use. Global Environmental Change, 23(2), 433–438. https://doi.org/10.1016/j.gloenvcha.2012.12.010
- Williams, M. (1990). Forests. In B. C. Turnnor II (Ed.), The Earth as transformed by human action: A global and regional changes in the biosphere over the past 300 years (pp. 179–223). Cambridge University press.
- Woldeamlak, B. 2003. Land degradation and farmer’s acceptance and adoption of conservation technologies in the Digil watershed, Northwestern highlands of Ethiopia (Social science research report series-no.29). OSSREA.
- Zewdu, Sh., Suryabhagavan, K. V., Balakrishnan, M. (2016). Land-use/land-cover dynamics in Sego Irrigation Farm, southern Ethiopia: A comparison of temporal soil salinization using geospatial tools. Journal of the Saudi Society of Agricultural Sciences, 15, 91–97. http://dx.doi.org/10.1016/j.jssas.2014.03.003
- Zhang, D. D., Harry, F. L., Cong, W., Baosheng, L., Qing, P., Jane, Z., Yulun, An. (2011). The causality analysis of climate change and large-scalehuman crisis. PNAS, 108(42). http://www.pnas.org/cgi/doi/10.1073/pnas.1104268108.
- Zubair, A. O. 2006. Change detection in land use and land cover using remote sensing data and GIS: A case study of Ilorin and its environs in Kwara State [Msc thesis]. University of Ibadan.