
 ?Mathematical formulae have been encoded as MathML and are displayed in this HTML version using MathJax in order to improve their display. Uncheck the box to turn MathJax off. This feature requires Javascript. Click on a formula to zoom.
Abstract
Tigray regional government has proposed land use land cover (LULC) change due to the 5-year growth and transformation plan (GTP). This LULC change could have an effect on hydrological flow. Hence, quantifying the hydrological flow coming due to the LULC change is important for decision making. Considering this, we set out to assess the impact of LULC change on hydrological flow of Gibe catchment using three LULC scenarios as compared to the base year (2010). The three scenarios were, increasing forest area, plantations/area closure and grass lands by 400, 200, and 200% from the base year, respectively. SWAT model was used to simulate the hydrological flow. The model was run on a daily time series for 7 years: calibrated during the 5 years (1998–2002), and validated during the 2 years (2003–2004). The simulated daily flow showed a good agreement to the observed flow with NSE = 0.81, R2 = 0.78 and PBIAS = −6.85 % for calibration, and NSE = 0.79, R2 = 0.75 and PBIAS = −7.52 for validation. The simulation result of the hydrological flow under the scenarios showed that increasing forest, plantation/area closure, and grass land have reduced the annual flow by 8.61, 4.65, and 1.45%, respectively. Reducing the hydrological flow could increase ground water potential and dry season base flow, which can be used for irrigation. Therefore, it is recommended that the government should strengthen the policy on natural resources management.
PUBLIC INTEREST STATEMENT
The Tigray regional government has set out the growth and transformation plan (GTP) to change the land use land cover (LULC) of Giba catchment. However, the impact of these LULC changes on hydrological flow is not quantified. To address this issue, three LULC change scenarios: increasing forest area, plantations/area closure and grass lands by 400, 200, and 200%, respectively, from the base year (2010) were used to simulate the hydrological flow using SWAT model. The simulation result of the hydrological flow under these scenarios showed that increasing forest, plantation/area closure and grassland have reduced the annual flow by 8.61, 4.65, and 1.45%, respectively. The proposed LULC changes have therefore a contribution to increase ground water potential and dry season base flow, which could ultimately be used for irrigation expansion. Therefore, it is recommended that the Tigray regional government should strengthen the policy on natural resources management and achieve the 5-year GTP.
Competing interests
The authors declare no competing interests.
1. Introduction
LULC and hydrological processes in a catchment are explicitly linked to each other (Brook et al., Citation2011; Costa et al., Citation2003; Hurni et al., Citation2005). LULC changes are believed to be one of the most essential factors that affects hydrological flow in a catchment (Da Silva et al., Citation2018). A continuous LULC change can alter the quantity of hydrological flow at a catchment outlet (Dos Santos et al., Citation2018; Fohrer et al., Citation2001). For example, a reduction in forest area increases the annual runoff (Guzha et al., Citation2018; Mao & Cherkauer, Citation2009). This is due to the low infiltration rate and high surface runoff volume ((Kavian et al., Citation2014; Mohammad & Adam, Citation2010). The higher surface runoff created in the catchment accelerates erosion; reduces water availability and affects the quality of the water (Alvarenga et al., Citation2016; Can et al., Citation2015). On the other way, increasing forest area and other vegetation cover in a catchment decreases surface runoff (Guzha et al., Citation2018; Li et al., Citation2009). Because, forest has the ability to improve organic matter and reduces surface runoff by increasing both infiltration rates and water-holding capacity of the soil (Pinto et al., Citation2016). This indicates that the hydrological flow in a catchment varies with LULC changes (Carlson & Arthur, Citation2000; Poff et al., Citation2006; Schilling et al., Citation2010). Hence, understanding the relationship between LULC change and hydrological flow, and quantifying the impact of LULC changes scenarios on hydrological flow is essential to improve both water and landscape management. In this regard, Giba catchment that found in the dry land areas of Tigray, Northern Ethiopia, has been taken as a model site to conduct the experiment on the effect of LULC change on hydrological flow using SWAT model.
Giba catchment experienced continuous LULC change over the last 2000–3000 years due to sever deforestation and removal of other vegetation cover (Nyssen, Citation2001). This is because of the intensive utilization of the land arising from the ever-increasing human and livestock population pressure and the poor agricultural policies of the previous governments on small holder agriculture (Gebremedhin, Citation1998). Consequently, land degradation has been a serious environmental problem and one of the main constraints of agricultural productivity in the catchment and in the high lands of Tigray in general. To reverse this situation, the current Ethiopian government has been trying to introduce watershed-based land management interventions since the last two decades. Accordingly, large area of land was rehabilitated, and the forest coverage of the country was increased from 4.1 to 8.8 million hectare during the 5 years (2005–2010) Plan for Accelerated and Sustained Development to End Poverty (PASDEP) (MoFED, Citation2010). Nyssen (Citation2001) has supported the government report, and found that land degradation in the highlands of Tigray was slowed down or reversed over the last two decades.
The success stories gained during the PASDEP was the foundation for the design of the 5-year national growth and transformation plan (GTP). The national GTP stated that intensive watershed management is among the pillars of the plan that is intended to retain sufficient water (MoFED, Citation2010). The Tigray regional GTP that was adopted from the national GTP was also targeted to implement integrated watershed management practices such as reforestation, plantation/area closure and zero gazing across watersheds (BoARD, Citation2010).
The proposed LULC change that will be implemented in Giba catchment as a result of the regional GTP will have therefore an effect on hydrological flow. Hence, estimating the quantity of hydrological flow coming as a result of the proposed LULC changes in Giba catchment is important for decision makers to evaluate the potential of the GTPon water conservation and to develop water management strategies (Arnold & Allen, Citation1996; Santhi et al., Citation2008).
Zenebe (Citation2009) assessed the spatial and temporal variability of river discharge and sediment yield in Giba catchment, and found that there was a strong correlation between seasonal rainfall and runoff depths. Nyssen et al. (Citation2010) studied the impact of soil and water conservation measures on hydrological responses in Giba sub-catchment by calculating the runoff curve number (CN) for various land uses and land management techniques and found a reduction in runoff and a rise of ground water after catchment management.
The proposed regional GTPindicated that forest land, plantation/area closure and grass land areas would be increased by 400, 200, and 200%, respectively, from the base year (2010) (BoARD, Citation2010). However, the effect of these proposed future LULC changes on hydrological flow in this catchment is not predicted. Consequently, there is less understanding on the quantitative impact of the proposed LULC change on hydrological flow. Thus, this study provides quantitative information to the decision makers on how the GTP will influence hydrological flow and to set water development and management strategies. The objective of this study was therefore to investigate the impact of the base year (2010) LULC condition on hydrological flow, and to determine how the hydrological flow responds to the LULC changes proposed by the 5-year regional growth and transformation plan.
2. Materials and methods
2.1. Study area description
This study was undertaken in Giba catchment, located in the highlands of Tigray regional state, Ethiopia (Figure ). Geographically, it extends from 13°17ʹ49” to 14° 14ʹ 04” N latitude and from 39° 2ʹ 27” to 39° 48ʹ12” E longitude. It originates from the high mountains of Migulat near Adigrat and flows toward south west and then westward to join Tekeze River. It is one of the biggest tributaries of Tekeze river basin, and drains an area of 4019 square kilometers.
Figure 1. Geographic location of Giba catchment.
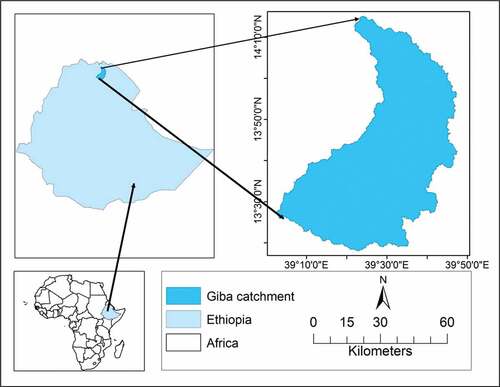
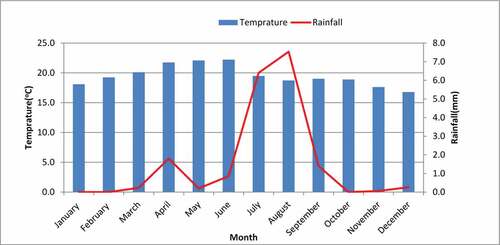
Giba catchment goes to the African dry lands, and has tropical mountain climate with prolonged dry period of about 9 months, and a maximum effective rainy season of 50 to 60 days (Hunting, Citation1976). Giba catchment owns a bimodal rainfall pattern (Figure ) with relatively smallest amount of rainfall in the month of April (locally called, “Belg”) and sufficient amount of rainfall (main rain season) showers in months of July, August, and September. The catchment receives an annual rainfall ranging from 580 to 750 mm (Yirga et al., Citation2011). Spatial variability and erosivity is the main characteristics of the rainfall in the catchment (Nyssen et al., Citation2005). According to the 2017 Ethiopian National Metrological agency (NMA) report, the mean annual temperature of the study area is 22.9 oC, whereas the mean monthly temperature ranges from 19.9 to 25.6 °C.
Figure 2. Mean monthly rainfall and temperature of Giba catchment (ENMA, Citation2010).
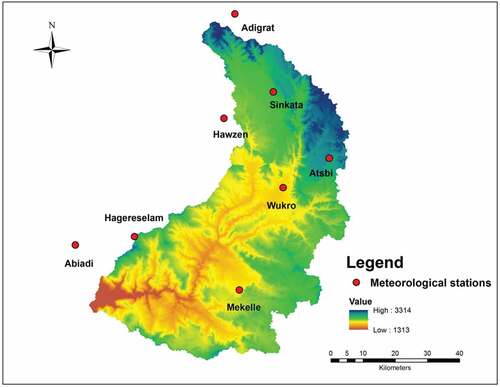
Its topography is composed of highlands in the eastern hills and mountains in the central, and lowlands in the southern part of the catchment. Tadesse and Bheemalingeswara (Citation2010) described the topography of Giba catchment as undulating surface, flatlands, and mountains characterized by gentle to steep slopes. They have classified into five slope classes: 0–15% (flatland), 15–30% (gentle), 30–45 (intermediate), 45–60% (slightly steep), and 60 − 75% (steep). Its elevation ranges from 1313 m at the outlet to 3314 m above sea level at the origin of the catchment. Soils of the catchment are dominated by leptosols and Eutric Vertisols on the level lands; Eutric Leptosols, Eutric Vertisols, Eutric and Calcric Cambisols and Haplic Luvisols on the sloping lands; Eutric Leptosols on the steep lands; and Leptosols on composite landforms (Zenebe, Citation2009). Land uses in Tigray and Giba catchment in particular are complex and changing frequently as the consequence of human innervations and other natural disasters (Nyssen, Citation2001). Land use shifting is still going on in Giba catchment as a result of the socio-economic factors and governmental policies and strategies. The land use system in the study area is mixed type, involves livestock husbandry and crop production simultaneously (Yirga et al., Citation2011). The inhabitants of the study area also irrigate and produce market-oriented vegetables such as onion, cabbage, tomato, potato, and others during dry season using ground water obtained from private and communal hand dug wells. The dominant rain fed crops grown in the area are Teff (Eragrostis), Barley, wheat, beans, finger millet, and maize. The community use traditional ox plowing usually up to 20 cm depth to prepare the land for both irrigated and rain fed cop production.
2.2. Input data
SWAT model data requirements are: digital elevation model (DEM), land use map, soil map, hydrological data and meteorological data to simulate the hydrological flow in a given watershed (Neitsch et al., Citation2005). Raster data sets include the DEM, soil map, and land use maps each with 30 m resolution were used as an input data. Accordingly, Shuttle Radar Topography Mission (SRTM) was used to generate topographic information, whereas, FAO (Citation1998) soil map was used to generate soil properties information occurring in the catchment. Land use map of the study area was prepared from multi-temporal MODIS NDVI images of the year 2010 to generate vegetation cover and land management information occurring in in the catchment. A total of 7 years (1998–2004) daily observed discharge data from the outlet of the catchment was collected from the Ethiopian Ministry of Water and Energy. Eight years of meteorological data covering eight meteorological stations within and around the catchment (Figure ) were collected from the Ethiopian Meteorological Agency (EMA).
Figure 3. Meteorological stations and elevation of Giba catchment.
SWAT model requires meteorological data including: daily rainfall, minimum and maximum temperature, relative humidity, solar radiation, and wind speed (Neitsch et al., Citation2005). However, due to data scarcity, rainfall, and maximum and minimum temperature, data were used to run the model. Simulating SWAT model using measured rainfall and maximum and minimum temperature can generate relative humidity, solar radiation, and wind speed (Winchell et al., Citation2009). Moreover, the Hargreaves method, which only requires air temperature (Neitsch et al., Citation2005), was used in this study to estimate the potential evapotranspiration. Accordingly, 8-year daily rainfall and maximum and minimum temperature data were collected to run the model.
2.3. Proposed land use scenarios
The direction of the national and regional policy is to change the existing land use through different land management interventions. The 5-year regional GTP (GTP), launched in 2010 (base year), is the one that intends to change the existing LULC through watershed-based land management interventions (BoARD, Citation2010). The implementation of this regional GTP in Giba catchment will have a direct relationship with the hydrological flow by the end of the 5- plan. The land use scenarios proposed by the 5-year regional GTP is given in Table .
Table 1. Land use scenarios and the land use change
2.4. Model description
Soil and water assessment tool (SWAT) model is a physically-based, deterministic, and continuous GIS interface, which runs on daily time step to study the impact of land use and climate change on water, sediment, and agricultural chemical yields on a large complex watershed (Arnold et al., Citation1998; Neitsch et al., Citation2005). SWAT divides the basin into sub-basin and more the sub-basin in to hydrological response units (HRUs) based on soil type, land use and management practices and slope. HRUs are a unique combination of land use, soil, and slope class. The assumption for each HRU is the variation of hydrologic dynamics within the HRU is smaller (Arnold et al., Citation1999). SWAT allows a number of physical processes to be simulated in a watershed. Whatever a study is conducted by SWAT, water balance is the driving force that happens in the watershed. SWAT has been developed from various distinct models over a period of 30 years, and has been tested for a wide range of regions, conditions, practices, and time scales (Gassman et al., Citation2007). SWAT model has many advantages. It is an open source tool with detailed documentation of tutorials and user groups that enabled the model to be a user-friendly and used widely to simulate hydrological flow at watershed level (Refsgaard, Citation1997). The model is improved continuously by the development team in response to limitations demonstrated by users to enhance its capabilities (Arnold et al., Citation2012). Moreover, it is demonstrated to be an effective and flexible tool for a wide range of applications, watershed scales and environmental conditions (Gassman et al., Citation2014; Krysanova & White, Citation2015). However, the model has its own disadvantages. The continuous improvements of the model could lead to difficulties in running the model and complicating the calibration process (Arnold et al., Citation2012; Vigerstol & Aukema, Citation2011). The model is highly data intensive and problems encountered especially in developing countries. Furthermore, the model is a non-spatial representation of the HRU inside each sub catchment. Land use, soil, and slope variability of the model is accounted through sub-catchments, and this ignores flow routing between HRUs (Glavan & Pintar, Citation2012).
2.5. Sensitivity analysis
Sensitivity analysis refers to the identification of some few parameters that have important effects in the model. SWAT 2005 model incorporates the LH‐OAT (Latin-hypercube-one-factor at a time simulation) method as part of the automatic sensitivity/calibration package (Gassman et al., Citation2007). SWAT is a distributed hydrological model that includes a number of parameters. As it is impossible to calibrate all of the parameters, a reduction of the number of parameters using sensitivity analysis is crucial issue to find the most sensitive parameters that affect stream flow (Schuol & Abbaspour, Citation2006).
2.6. SWAT model calibration and validation
The more sensitive parameters could be calibrated either manually or automatically using sequential uncertainty fitting (SUFI-2) algorithm (Arnold et al., Citation1999). In this study, manual calibrations were done to test the model predicting capability (reducing the gap between observed and simulated flows) using observed time series data at the catchment outlet.
2.7. Model performance evaluation
In this study, both graphical and statistical methods of performance evaluation were used. The graphic method consisted of plotting observed versus simulated hydrographs to compare them visually. The quantitative methods of evaluation were dependent on the three model evaluation methods namely: the Nash-Sutcliffe coefficient of efficiency (NSE), Coefficient of determination (R2), and percent bias (PBIAS). These three objective functions are widely used in evaluating the performance of the hydrological models (Gassman et al., Citation2007; Arnold et al., Citation1999). The Nash-Sutcliffe coefficient of efficiency (NSE) is computed as the ratio of residual variance to measured data variance (Nash & Sutcliffe, Citation1970). It is determined by EquationEq. (1(1)
(1) ).
Where: Qo is the observed flow data in m3/s, Qs is simulated flow data in m3/s, Qmo is mean of observed flow.
The NSE value ranges from—∞ to 1; a value between 0 and 1 shows an acceptable model performance where as a value less than 0 shows poor performance of model (Nash & Sutcliffe, Citation1970).
The coefficient of determination (R2) describes the proportion of the total variance in the observed data that can be explained by the model (Moriasi et al., Citation2007).
The coefficient of determination (R2) can be calculated as EquationEq. (2(2)
(2) ):
Where: Qo is observed flow data in m3/s, Qmo is mean values of the observed data, Qs is simulated flow data in m3/s, Qms is mean values of simulated data. R2 ranges from 0 to 1 where a value of 1 is perfect fit and therefore a very reliable model or less error variance, and a value of 0, on the other hand would indicate that the model fails to accurately model the dataset (Moriasi et al., Citation2007).
The percent bias (PBIAS) measures the tendency of the computed data to be greater or smaller than the measured data (Gupta et al., Citation1999). This can be calculated as EquationEq. (3(3)
(3) ).
Where: Qo is the observed flow data in m3/s, Qs is simulated flow data in m3/s. The optimal value of PBIAS is 0, with low-magnitude values indicating accurate model simulation. Positive values indicate model underestimation bias, and negative values indicate model overestimation bias (Gupta et al., Citation1999).
3. Results and discussions
3.1. SWAT modeling
The SWAT model divided the catchment area into 31 sub-basins (Figure ) by overlaying the 2010 LULC map, FAO soil map and the slope classes.
Figure 4. Sub-basins of the Giba catchment.
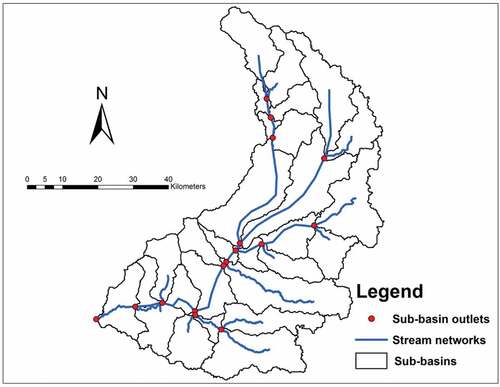
The 31 sub-basins were father sub-divided into 118 lumped units called Hydrologic Response Units (HRUs), having unique land use and soil combinations (Neitsch et al., Citation2005).
The overall water balance is therefore, simulated at HRUs level. Flows are summed from all 118 HRUs to the 31 sub-basin level and routed through the watershed outlet.
3.2. Sensitivity analysis
The most sensitive parameters were selected from the flow parameters in the SWAT model to perform sensitivity analysis (Neitsch et al., Citation2005). During parameter selection, the more sensitive parameters were compared with previous studies conducted in Ethiopia (Betrie et al., Citation2011; Setegn et al., Citation2008). A total of 280 iterations were done to select the rank of these parameters. Accordingly, 10 upper most flow parameters (Table 2 ) were taken for further sensitivity analysis of the hydrological flow.
3.3. Optimum parameter values
Simulation was carried out from January 1, 1998 to December 31, 2004. The 5-year data were used for model calibration, and the last 2 years for model validation. Because of hydrological complexity and large size of the watershed, calibration could have done at different location from upstream to downstream. However, the Adicumsi gauging station (the outlet of the catchment) was the only station with long-term measured hydrological data and calibration of parameters has made at this outlet. Manual adjustment of parameters in the SWAT editor and simulation based on the adjusted parameters were performed until satisfactory calibration result was obtained. During calibration process, initial parameter values were given based on the SWAT model database. Based on these parameter values, simulation was performed and obtained a result, which can be compared with observed hydrological flow. Based on this result, calibration was done and the final fitted parameter values are given in Table .
Table 2. Ranking of the 10 most sensitive parameters
3.4. Calibration and validation
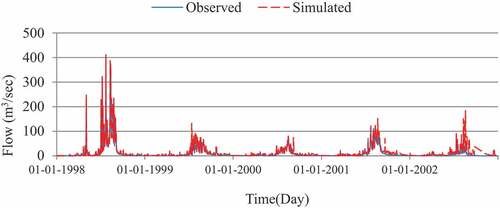
The comparisons between the observed and simulated flow were done using Nash Sutcliffe efficiency (NSE), coefficient of determination (R2), percent of bias (PBIAS), and graphical comparison of hydrograph’s shape. The daily time series calibration result is shown in Figure . The result shows that the timing and shape of the runoff hydrographs is well predicted. The low flow (base flow) and high flows (peak flow) are well represented as well.
Figure 5. Calibration results of daily discharge values.
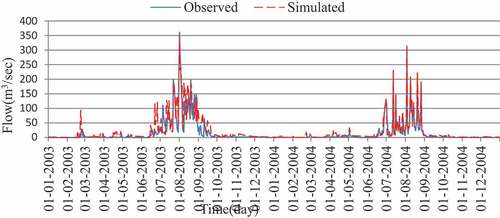
The validation result for daily run-off hydrograph is given in Figure . The graph shows that the model seems to be fitted well with the observed flow hydrograph.
Figure 6. Validation result of daily discharge values.
In addition to graphical comparison shown earlier, model results were also evaluated using statistical indices. The Nash Sutcliffe efficiency (NSE), coefficient of determination and percent of bias were used to assess the goodness of fit of the model. Results of daily and monthly calibration and validation outputs of the model are shown in Table .
Table 3. Calibrated model parameters and their final values
The indices NSE, R2 and PBIAS have shown good results for the daily flow during the calibration period. In general, the performance of the model in predicting daily flow was found to be satisfactory as compared to the previous studies conducted in Ethiopia. Betrie et al. (Citation2011) has conducted a research on Sediment management modeling in Blue Nile Basin using SWAT model and have found a model performance for daily time with the NSE, and PBIAS equal to 0.68, 0.57, and 10%, respectively. Setegn et al. (Citation2008) who did his research on Hydrological Modeling in the Lake Tana Basin, using SWAT model has also reported as good result of calibration of daily flow with NSE greater than 0.54 and R2 greater than 0.63 in each rivers of the basin. Gassman et al. (Citation2007) has proposed that NSE, R2 and PBIAS should lies within the range of > 0.5, 0.5, and ± 25 respectively, in order for the model results to be judged as satisfactory for hydrological evaluation. Taking this in to consideration, the model calibration and validation results (Table ) indicated that the model performance is satisfactory.
3.5. Impact of land cover change scenarios on stream flow
The simulated hydrological flow coming from the impact of the proposed LULC change scenarios set by the GTP were compared with the model results from the LULC of the base line scenario (2010 condition).
Base line scenario: This scenario generated an annual flow of 7.74 × 10⁸ m3/year.
Scenario1: This scenario led to a decrease (Table ) of annual flow by 8.6%. When assessed seasonally. This scenario has resulted in decreasing of the peak flow (during wet season) by 10.6% and an increasing of the base flow (dry season) by 6.75%. Figure shows the comparison of hydrologic flow between the base line and Scenario 1. This figure shows that the peak flow under Scenario 1 is lower than the base line scenario. Whereas the base flow seems to be higher in the case of scenaio1 and lower in the case of base year. This clearly indicated that forest expansion can increase the base flow and decrease the peak flow. Kebede (Citation2009) analyzed the effect of LULC change on hydrological response of Gilgel Abay catchment, headwater of Blue Nile. Results from the study indicated that the reduction of forest coverage by 1.38% between 1973 and 1986 caused an increase of the peak flow in wet season by 6.06% and reduction of the base flow in dry season by 5.27%.
Figure 7. Comparison of stream flow between base year and Scenario 1.
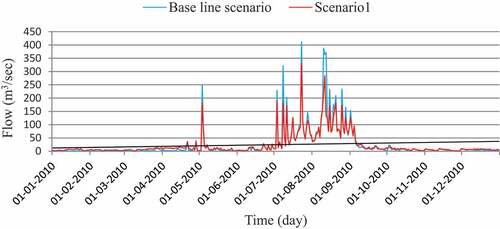
Table 4. Performance of hydrological modeling
Table 5. Changes in annual water yields under land use scenarios
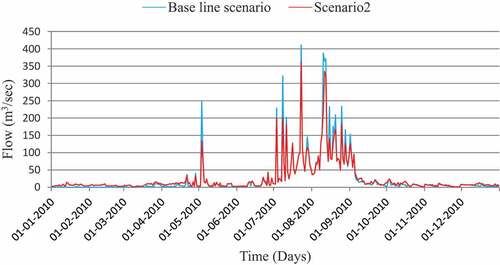
Scenario 2: This was generated by increasing plantation/area closure coverage of the base year by 200%. Similar trend with scenario1 occurred. This scenario has resulted in decreasing the annual flow (Table ) by 4.65%. Similar to scenario1, simulation result indicated that expansion of plantation/area closure has resulted in decreasing the peak flow by 5.75% (Figure ) and increasing of the base flow by 2.64%. This result is similar with the finding of (Betrie et al., Citation2011). They predicted the impact of three best future management practices scenarios in Upper Blue Nile and found that reforestation management scenario has reduced the sediment yield at the outlet of the basin by 11%. This may be attributed to increase of infiltration during rainy season into groundwater, resulting in increasing base flow during dry season and decreasing surface flow during the wet season.
Figure 8. Comparison of stream flow between base year and Scenario 2.
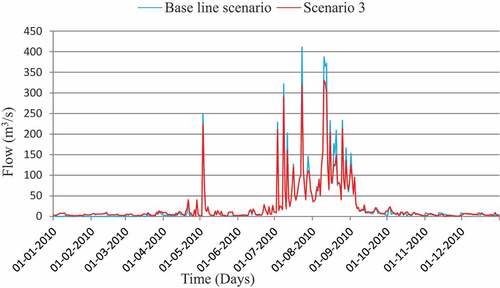
Scenario 3: This conversion of land use has an increasing effect on the hydrological flow similar to the previous scenarios. However, its influence on the hydrological change is not significant as compared to the previous scenarios (Figure ). The result showed a reduction in annual flow by 1.45%. The peak flow discharge reduced by 2.15% and the base flow increased by 0.34%. This result is consistent with the finding of Fusun et al. (Citation2013) who found a high coverage of grasses prevents surface runoff and soil erosion more effectively. This is due to the fact that grasses have the ability to reduce the rain drop impact on soils, to increase infiltration rate, and to reduce surface runoff volume by reducing the velocity of the runoff and give time to infiltrate to the sub surface.
Figure 9. Comparison of stream flow between base line and Scenario 3.
The three future LULC scenarios, if implemented, will bring about estimated annual flow saving of 1.13 × 10⁸ m3/year (Table ). This amount of water can be available during dry season in the form of surface base flow in the river or in the form of ground water. The surface and ground water potential could be used for human and livestock consumption and even for irrigation. Such amount of water is estimated to irrigate 7,792 hectare considering FAO guideline for semi-arid climate. Therefore, it can be conclude that the proposed LULC change, based on the GTP, will have a positive impact on irrigation productivity and food security.
4. Conclusion
In this study, SWAT model was used to investigate the impact of LULC changes on hydrological flow in Giba catchment under three LULC scenarios following the Tigray region growth and transformation plan. The result of the model under each future LULC change scenarios showed differences in peak flow, base flow and annual water yield. With the three LULC scenarios, an estimated annual flow of 1.13 × 10⁸ m3/year can be conserved. Such amount of water has a potential to irrigate about 7,792 hectare of land in the study area. From this, we conclude that the regional government GTP if implemented successfully does not only to conserve water but also improve forest coverage, reduce soil erosion and improve soil fertility, enhance irrigation potential, improve agricultural productivity, and improve the ecosystem at large in the catchment and ultimately in the region. As the local community’s annual food consumption is depend on the agricultural production obtained from the field of this landscape, the GTP in general will have important role on food security at each household level and sustainable agricultural production in the catchment and the region in general.
In this study, SWAT model was simulated using rainfall and temperature data to generate relative humidity, solar radiation, and wind speed. However, it is recommended that future studies should use solar radiation, wind speed, and water vapor pressure data in 30 s resolution from open sources such as WorldClim. Furthermore, it is recommended that the regional government of Tigray have to strengthen the policy on natural resources management to further bring about food security.
Acknowledgements
We therefore would like to express our sincere gratitude to Mekelle University for providing us financial support to accomplish the study.
Additional information
Funding
Notes on contributors
Gebrejewergs Aredehey
Gebrejewergs Aredehey is an Assistant professor in watershed management at Department of Land Resources Management and Environmental Protection (LaRMEP), Collage of Dry land Agriculture and Natural Resources, Mekelle University, Ethiopia. Gebrejewergs Aredehey is also doing a research on watershed management, soil characterization and management in the agricultural landscape of Tigray region.
Atinkut Mezgebu
Atinkut Mezgebu (PhD) is a former dean of College of Dry land Agriculture and Natural Resources and a researcher on hydrology in Mekelle University, Ethiopia. Currently he is working as head for Tigray Bureau of Agriculture and Rural Development (BoARD).
Atkilt Girma
Atkilt Girma is an instructor and a researcher in the areas of natural resources management, climate, and GIS and remote sensing at the department of Land Resources Management and Environmental Protection (LarMEP), Collage of Dry land Agriculture and Natural Resources, Mekelle University, Ethiopia.
References
- Alvarenga, L. A., De Mello, C. R., Colombo, A., Cuartas, L. A., & Bowling, L. C. (2016). Assessment of land cover change on the hydrology of a Brazilian headwater watershed using the distributed hydrology-soil-vegetation model. Catena, 143, 7–15. https://doi.org/10.1016/j.catena.2016.04.001
- Arnold, J. G., & Allen, P. M. (1996). Estimating hydrologic budgets for three Illinois watersheds. Journal of Hydrology, 176(14), 57–77. https://doi.org/10.1016/0022-1694(95)02782-3
- Arnold, J. G., Moriasi, D. N., Gassman, P. W., Abbaspour, K. C., White, M. J., Srinivasan, R., Santhi, C., Harmel, R. D., Van Griensven, A., & Van Liew, M. W. (2012). SWAT: Model use, calibration, and validation. Transactions of the American Society of Agricultural and Biological Engineers, 55(4), 1491–1508.
- Arnold, J. G., Srinivasan, R., Muttiah, R. S., & Allen, P. M. (1999). Continetal scale simulation of the hydrologic balance. Journal of the American Water Resources Association, 35(5), 1037–1051. https://doi.org/10.1111/j.1752-1688.1999.tb04192.x
- Arnold, J. G., Srinivasan, R., Muttiah, R. S., & Williams, J. R. (1998). Large area hydrologic modeling and assessment part I: Model development 1. Journal of the American Water Resources Association, 34(1), 73–89. https://doi.org/10.1111/j.1752-1688.1998.tb05961.x
- Betrie, G. D., Mohamed, Y. A., Griensven, A., & Srinivasan, R. (2011). Sediment management modelling in the Blue Nile Basin using SWAT model. Hydrology and Earth System Sciences, 15(3), 807–818. https://doi.org/10.5194/hess-15-807-2011
- BoARD. (2010). Growth and transformation plan (2010/11-2014/15), Tigray Bureau of Agriculture and Rural Development, Mekelle, Ethiopia.
- Brook, H., Argaw, M., Sulaiman, H., & Abiye, T. A. (2011). The impact of land use/land cover change on hydrological components due to resettlement activity: SWAT model approach. International Journal of Ecology and Environmental Sciences, 37(1), 49–60.
- Can, T., Xiaoling, C., Jianzhong, L., Gassman, P. W., Sabine, S., & José-Miguel, S. P. (2015). Assessing impacts of different land use scenarios on water budget of Fuhe River, China using SWAT model. International Journal of Agricultural and Biological Engineering, 8(3), 95–109.
- Carlson, T. N., & Arthur, S. T. (2000). The impact of land use—land cover changes due to urbanization on surface microclimate and hydrology: A satellite perspective. Global and Planetary Change, 25(12), 49–65. https://doi.org/10.1016/S0921-8181(00)00021-7
- Costa, M. H., Botta, A., & Cardille, J. A. (2003). Effects of large-scale changes in land cover on the discharge of the Tocantins River, Southeastern Amazonia. Journal of Hydrology, 283(1–4), 206–217. https://doi.org/10.1016/S0022-1694(03)00267-1
- Da Silva, V., Silva, M., Singh, V., de Souza, E., Braga, C., de Holanda, R., Almeida, R., de Sousa, F., & Braga, A. (2018). Simulation of stream flow and hydrological response to land-cover changes in a tropical river basin. Catena, 162, 166–176. https://doi.org/10.1016/j.catena.2017.11.024
- Dos Santos, V., Laurent, F., Abe, C., & Messner, F. (2018). Hydrologic response to land use change in a large basin in Eastern Amazon. Water, 10(4), 429. https://doi.org/10.3390/w10040429
- ENMA. (2010). Annual meteorological data report, Ethiopian National Meteorological Agency, Addiss Abeba, Ethiopia.
- FAO. (1998). The digital soil and terrain database of northeastern Africa.
- Fohrer, N., Haverkamp, S., Eckhardt, K., & Frede, H. G. (2001). Hydrologic response to land use changes on the catchment scale. Physics and Chemistry of the Earth, Part B: Hydrology, Oceans and Atmosphere, 26(78), 577–582. https://doi.org/10.1016/S1464-1909(01)00052-1
- Fusun, S., Jinniu, W., Tao, L., Yan, W., Haixia, G., & Ning, W. (2013). Effects of different types of vegetation recovery on runoff and soil erosion on a Wenchuan earthquake-triggered landslide, China. Journal of Soil and Water Conservation, 68(2), 138–145. https://doi.org/10.2489/jswc.68.2.138
- Gassman, P. W., Reyes, M. R., Green, C. H., & Arnold, J. G. (2007). The soil and water assessment tool: Historical development, applications, and future research directions. Transactions of the ASABE, 50(4), 1211–1250. https://doi.org/10.13031/2013.23637
- Gassman, P. W., Sadeghi, A. M., & Srinivasan, R. (2014). Applications of the SWAT model special section: Overview and insights. Journal of Environmental Quality, 43(1), 1–8. https://doi.org/10.2134/jeq2013.11.0466
- Gebremedhin, B. (1998). The economics of soil conservation investments in the Tigray region of Ethiopia [Thesis(PhD)]. Michigan State University.
- Glavan, M., & Pintar, M. (2012). Strengths, weaknesses, opportunities and threats of catchment modelling with soil and water assessment tool (SWAT) model, water resources management and modeling. InTech.
- Gupta, H. V., Bastidas, L. A., Sorooshian, S., Shuttleworth, W. J., & Yang, Z. L. (1999). Parameter estimation of a land surface scheme using multicriteria methods. Journal of Geophysical Research: Atmospheres, 104(16), 19491–19503. https://doi.org/10.1029/1999JD900154
- Guzha, A. C., Rufino, M. C., Okoth, S., Jacobs, S., & Nóbrega, R. B. (2018). Impacts of land use and land cover change on surface runoff, discharge and low flows: Evidence from East Africa. Journal of Hydrology: Regional Studies, 15, 49–67. https://doi.org/10.1016/j.ejrh.2017.11.005
- Hunting, T. S. (1976). Tigray rural development study, annex 2: Water resources. Hunting Technical Services Limited.
- Hurni, H., Tato, K., & Zeleke, G. (2005). The implications of changes in population, land use, and land management for surface runoff in the upper Nile basin area of Ethiopia. Mountain Research and Development, 25(2), 147–154. https://doi.org/10.1659/0276-4741(2005)025[0147:TIOCIP]2.0.CO;2
- Kavian, A., Azmoodeh, A., & Solaimani, K. (2014). Deforestation effects on soil properties, runoff and erosion in northern Iran. Arabian Journal of Geosciences, 7(5), 1941–1950. https://doi.org/10.1007/s12517-013-0853-1
- Kebede, E. (2009). Hydrological response to land cover changes in Gilgel Abay catchment, Ethiopia [Msc. Thesis]. ITC. 123. Iwmi.
- Krysanova, V., & White, M. (2015). Advances in water resources assessment with SWAT—an overview. Hydrological Sciences Journal, 60(5), 771–783. https://doi.org/10.1080/02626667.2015.1029482
- Li, Z., Liu, W., Zhang, X., & Zheng, F. (2009). Impacts of land use change and climate variability on hydrology in an agricultural catchment on the Loess Plateau of China. Journal of Hydrology, 377(1–2), 35–42. https://doi.org/10.1016/j.jhydrol.2009.08.007
- Mao, D., & Cherkauer, K. A. (2009). Impacts of land-use change on hydrologic responses in the Great Lakes region. Journal of Hydrology, 374(12), 71–82. https://doi.org/10.1016/j.jhydrol.2009.06.016
- MoFED. (2010). Growth and transformation plan (2010/11–2014/15). Voume I: Main text., Ministry of Finance and Economic Development, Addis Abeba, Ethiopia.
- Mohammad, A. G., & Adam, M. A. (2010). The impact of vegetative cover type on runoff and soil erosion under different land uses. Catena, 81(2), 97–103. https://doi.org/10.1016/j.catena.2010.01.008
- Moriasi, D. N., Arnold, J. G., Van Liew, M. W., Bingner, R. L., Harmel, R. D., & Veith, T. L. (2007). Model evaluation guidelines for systematic quantification of accuracy in watershed simulations. American Society of Agricultural and Biological Engineers, 50(3), 885–900.
- Nash, J. E., & Sutcliffe, J. V. (1970). River flow forecasting through conceptual models part I—A discussion of principles. Journal of Hydrology, 10(3), 282–290. https://doi.org/10.1016/0022-1694(70)90255-6
- Neitsch, S. L., Arnold, J. G., Kiniry, J. R., Srinivasan, R., & Williams, J. R. (2005). Soil and water assessment tool input/output file documentation. Blackland Research Center.
- Nyssen, J. (2001). Erosion processes and soil conservation in a tropical mountain catchment under threat of anthropogenic desertification. A case study from Northern Ethiopia.
- Nyssen, J., Clymans, W., Descheemaeker, K., Poesen, J., Vandecasteele, I., Vanmaercke, M., Zenebe, A., Van Camp, M., Haile, M., Haregeweyn, N., Moeyersons, J., Martens, K., Gebreyohannes, T., Deckers, J., & Walraevens, K. (2010). Impact of soil and water conservation measures on catchment hydrological response—a case in north Ethiopia. Hydrological Processes, 24(13), 1880–1895. https://doi.org/10.1002/hyp.7628
- Nyssen, J., Vandenreyken, H., Poesen, J., Moeyersons, J., Deckers, J., Haile, M., Salles, C., & Govers, G. (2005). Rainfall erosivity and variability in the Northern Ethiopian Highlands. Journal of Hydrology, 311(14), 172–187. https://doi.org/10.1016/j.jhydrol.2004.12.016
- Pinto, L. C., de Mello, C. R., Owens, P. R., Norton, L. D., & Curi, N. (2016). Role of inceptisols in the hydrology of mountainous catchments in Southeastern Brazil. Journal of Hydrologic Engineering, 21(2), 05015017. https://doi.org/10.1061/(ASCE)HE.1943-5584.0001275
- Poff, N. L., Bledsoe, B. P., & Cuhaciyan, C. O. (2006). Hydrologic variation with land use across the contiguous United States: Geomorphic and ecological consequences for stream ecosystems. Geomorphology, 79(34), 264–285. https://doi.org/10.1016/j.geomorph.2006.06.032
- Refsgaard, J. C. (1997). Parameterisation, calibration and validation of distributed hydrological models. Journal of Hydrology, 198(1–4), 69–97. https://doi.org/10.1016/S0022-1694(96)03329-X
- Santhi, C., Allen, P. M., Muttiah, R. S., Arnold, J. G., & Tuppad, P. (2008). Regional estimation of base flow for the conterminous United States by hydrologic landscape regions. Journal of Hydrology, 351(12), 139–153. https://doi.org/10.1016/j.jhydrol.2007.12.018
- Schilling, K. E., Chan, K., Liu, H., & Zhang, Y. (2010). Quantifying the effect of land use land cover change on increasing discharge in the Upper Mississippi River. Journal of Hydrology, 387(3–4), 343–345. https://doi.org/10.1016/j.jhydrol.2010.04.019
- Schuol, J., & Abbaspour, K. C. (2006). Calibration and uncertainty issues of a hydrological model (SWAT) applied to West Africa. Advances in Geosciences, 9, 137–143. https://doi.org/10.5194/adgeo-9-137-2006
- Setegn, S. G., Srinivasan, R., & Dargahi, B. (2008). Hydrological modelling in the Lake Tana Basin, Ethiopia using SWAT model. The Open Hydrology Journal, 2(1), 49–62. https://doi.org/10.2174/1874378100802010049
- Tadesse, N., & Bheemalingeswara, K. (2010). Prospects and constraints of household irrigation practices, Hayelom Watershed, Tigray, Northern Ethiopia. Momona Ethiopian Journal of Science, 2(2), 86–109. https://doi.org/10.4314/mejs.v2i2.57676
- Vigerstol, K. L., & Aukema, J. E. (2011). A comparison of tools for modeling freshwater ecosystem services. Journal of Environmental Management, 92(10), 2403–2409. https://doi.org/10.1016/j.jenvman.2011.06.040
- Winchell, M., Srinivasan, R., Di Luzio, M., & Arnold, J. G. (2009). Arcswat 2.3. 4 interface for swat 2005. Grassland, soil and research service.
- Yirga, G., Teferi, M., & Kasaye, M. (2011). Survey of medicinal plants used to treat human ailments in Hawzen district, Northern Ethiopia. International Journal of Biodiversity and Conservation, 3(13), 709–714. http://www.academicjournals.org/IJBC
- Zenebe, A. (2009). Assessment of spatial and temporal variability of river discharge, sediment yield and sediment-fixed nutrient export in Geba River catchment, Northern Ethiopia [Thesis (PhD)]. KU Leuven.