
 ?Mathematical formulae have been encoded as MathML and are displayed in this HTML version using MathJax in order to improve their display. Uncheck the box to turn MathJax off. This feature requires Javascript. Click on a formula to zoom.
Abstract
Rapid urban expansion and development have resulted in the conversion of many natural green surfaces within cities to non-transpiring built-up surfaces, such as concrete and asphalt. These artificial urban surfaces cause substantial variation in land surface temperatures that affect the urban microclimate. Thus, there is the need to substantially quantify the extent of green cover loss within growing cities and its impact on surface temperatures. This study used LANDSAT data to spatially assess the extent of urban expansion and its effect on land surface temperature within Kumasi, Ghana. Subsequently, the results showed significant changes in the land cover, which had an effect on the observed land surface temperatures from 1986 to 2015. Generally, there was an overall increase in the built-up areas by 24.13% (55.81 km2) from 1986 to 2015, with a corresponding increase in the mean land surface temperature by 4.16°C. As such, there is the need for the adoption of sustainable urban planning strategies with green vegetation conservation initiatives for modern city planners. This would help reduce urban land surface temperatures while promoting clean air circulation within the city.
PUBLIC INTEREST STATEMENT
This work seeks to address the effect of the changes in land use and land cover on land surface temperatures by using satellite imagery for three different years from remote sensing techniques. The study is a contribution to urban environmental science on the adoption of sound sustainable urban planning strategies with green vegetation conservation initiatives across developing cities within Africa. Inasmuch as we need to clear more urban spaces for developmental projects, there is the urgent need to interspace these built-up environments with large beautiful green parks/gardens that may cool the urban environment, promote clean air circulation and also provide recreational services for both inhabitants and visitors. This was the original city plan for Kumasi until rapid urbanization led to the destruction of most of these green areas to meet the emergent needs of the rising population within the city, thereby losing its ‘Garden city’ status.
Competing Interests
The authors declare no competing interests.
1. Introduction
Urbanization continues to create more economic growth opportunities for many countries by ensuring the provision of social services such as education, basic healthcare, reliable access to good drinking water, sanitation services, electricity, massive industrial infrastructures and quality transportation hubs that are necessary for commercial development (Desa, Citation2014). However, studies have shown that such recent developmental patterns in these urban cities lead to the destruction of natural surfaces (green vegetation, water and soil) to make way for built-up surfaces in meeting the demands of the increasing population (Gillis et al., Citation2001; Le Quéré et al., Citation2013). Thus, a projected 20% increase in the population by 2050 of about 472 million people living in over 143 cities across West Africa will further enhance the destruction of more green vegetation within the region (Rodriguez et al., Citation2007; Saghir, Citation2018).
The resultant expansion of modern cities through changes in urban land cover to artificial surfaces is a key factor that increases the Land surface temperature (LST) of the urban environment than its surrounding communities (Christen & Vogt, Citation2004; Grimmond & Oke, Citation2002). These built-up surfaces such as concrete, metallic and asphalt surfaces change the land surface energy balance and contribute to urban heat islands (Moonen et al., Citation2012; Stull, Citation2012). The urban heat islands (UHIs), which are quite noticeable at night and during the summer periods, will lead to thermal discomfort within the urban areas and have severe consequences on human, animal and plant health, consumption and even productivity (Demuzere et al., Citation2014). However, with the tropics expected to experience extreme heat conditions under a moderate temperature of 2.0°C increase in global mean air temperatures, the heat stress within these West African cities will be enhanced (Schellnhuber et al., Citation2014). Since these expanding tropical urban areas remain ill-equipped to manage the possible risks associated with thermal discomfort, there is the growing need to assess the impact of urban land cover changes on urban surface temperatures (Burkart et al., Citation2011), thereby identifying areas within these tropical cities, where immediate mitigation measures could be introduced (Emmanuel & Loconsole, Citation2015; Jim & Chan, Citation2016). This urban climate research requires good information on the land cover, which incorporates data on the urban land cover changes and its associated surface energetic signature (Li et al., Citation2011; Matthews et al., Citation2015). Thus, the application of remote sensing tools will provide a more reliable and consistent way of monitoring land cover changes associated with urbanization for large areas of tens of kilometers (Lu et al., Citation2010). Many studies have been conducted to determine the effect of the changes in the urban land cover types on the variability of the LST, using remote sensing application techniques (Amiri et al., Citation2009; Chen et al., Citation2013; Hu et al., Citation2015; Igun & Williams, Citation2018; Karlessi et al., Citation2011; Larsen, Citation2015; Zhibin et al., Citation2015).
Kumasi is an important study area because of its location in a hot climatic zone within the sub-Saharan region of Africa. It is the second largest city in Ghana and has been the commercial, industrial and cultural capital of the Ashanti Kingdom since 1695 (McCaskie, Citation2007). Kumasi was also one of the few cities in Africa to have enjoyed the implementation of the garden city model from its colonial masters who were the British (Corovic, Citation2009; Howard, Citation2014). Following the defeat of the Ashanti tribe (occupants of Kumasi) in a war with the British in 1896, the city was razed to the ground and re-built based on the garden city architectural design proposed by Maxwell Fry and Jane Drew in 1945 (Clark, Citation2003; Quagraine, Citation2011). The city was marked with significant greenery spaces including urban parks, greenhouses, trees, forests and green belts that cooled the air temperature within the city (Eduful, Citation2014; Schmidt, Citation2005). Currently, the city has lost its garden city status to growing demands associated with urbanization (Cobbinah & Amoako, Citation2012; Yuan & Ng, Citation2012). Other research works have assessed the effect of such changes in land cover on the main sources of drinking water in the Kumasi metropolis (Gal & Unger, Citation2009). Manu et al. (Citation2006) also investigated the effect of global warming on air temperatures within Kumasi and Accra, while Nero et al. (Citation2017) also quantified the variability in the distribution of vegetation, soil and ecosystem carbon storage in Kumasi due to recent urbanization.
Against the above background, this study seeks to spatially assess the extent and rate in changes of the land cover pattern in Kumasi and its effect on land surface temperatures from 1986 to 2015 using remote sensing application techniques. Landsat (4, 7 and 8) data obtained from the archives of the US Geological Survey (USGS) were used to assess the extent of green cover (land cover) depletion of the city. A thermal map over the study period was also generated from Landsat 8 to determine the changes in land surface temperatures since 1986. The findings of this study will provide valuable information to modern city planners on the adoption of more sustainable urban planning strategies that include green vegetation conservation initiatives and have the tendency to regulate urban surface temperatures. This information will not only be important to the study area but to other similar growing tropical cities around Africa and the world.
2. Materials and Methods
2.1. Site Description
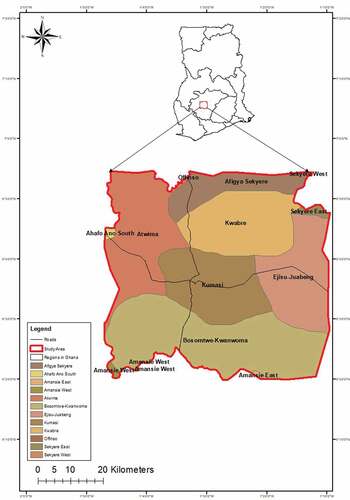
Kumasi is approximately 500 km (300 mi) north of the Equator and 200 km north of the Gulf of Guinea and strategically located in south-central Ghana with all major roads converging at the city center (Figure ). The city is geographically located in the moist semi-deciduous part of the South-East ecological zone of Ghana and within the tropical rain forest belt of West Africa, with an average elevation of about 260 m above the mean sea level (Arhin & Afari-Gyan, Citation1992). The city has an aggregate area of roughly 254 km2 and comprises 10 sub-metropolitan areas, namely: Manhyia, Tafo, Suame, Asokwa, Oforikrom, Asawase, Bantama, Kwadaso, Nhyiaeso and Subin (Maoulidi, Citation2010).
Figure 1. Map of Kumasi showing surrounding district assemblies.
2.2. Input Data
2.2.1. Satellite Data
The study applied remote sensing techniques for quantifying the land cover changes and its influence on the land surface temperature (land surface estimation and land cover classification) using freely available Landsat images for 1986, 2007 and 2015. These imageries were further classified into forested, built-up and water areas within the study area. Three cloud-free images were downloaded from the archives of the United States Geological Survey (USGS) Earth Explorer and used for the study (Table ). Landsat data were used to quantify (i) land cover changes with the main focus on urban images and (ii) land surface temperature changes in the Kumasi study area.
Table 1. Summary of the Landsat data sets used in the analysis
2.2.2. Meteorological Data
Mean daily temperature data were obtained from the Ghana Meteorological Agency (GMet) for Kumasi over the study period (1 January 1986–31 December 2015). GMet, like any other meteorological agencies under the World Meteorological Organization (WMO), uses WMO’s standards in its weather measurements. However, minor inconsistencies in the weather measurements due to instrumental or observational error could be introduced in the climate data analysis, which are quite negligible (Mensah et al., Citation2016).
Statistical analyses were performed using Microsoft Office Excel (Microsoft, 2016) and R statistical software (R Development Core Team, 2018).
2.3. Landsat Data Processing and Analysis
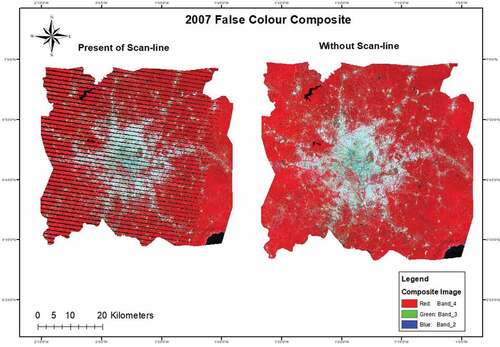
Analysis of the land cover changes was done by processing the three Landsat images geometrically to its local coordinate system. This was done by geo-referencing the images to its local coordinate system using the Universal Transverse Mercator (UTM) projection (WGS 1984 UTM Zone 30 N) in ArcMap 10.4.1. These images were pre-processed including radiometric and atmospheric corrections which are very essential in every remote sensing analysis due to distortions that the images may contain (Atayi et al., Citation2016). The radiometric correction reduces the degree of spectral differences from distorted images with atmospheric haze, scan lines and stripping (Atayi et al., Citation2016). Also, the Landsat 7 TM developed a faulty scan line corrector on May 2003 which led to the seen scan lines in the 2007 imageries (Figure ). This fault was corrected and updated to Landsat 8. As such, images from the period as detected in 2014 had some scan lines in them. These scan lines were removed using the Landsat Gap-fill extension in ENVI 4.7. Atmospheric correction was also performed to remove the atmospheric haze such as clouds, caused by the variations in the atmospheric conditions between the dates of images, through the use of a Quick Atmospheric Correction function tool in ENVI 4.7.
Figure 2. Presence of scan-line and without scan line.
Remotely sensed data were used to obtain information by assessing the ecosystems’ conditions through land cover mapping (Assessment, M. E., Citation2005). Land cover mapping mimicked the Earth's surface by delineating the different features that exist in their natural environment, using the image classification technique. For the purpose of this study, forest refers to areas covered with trees either deciduous or evergreen, built-up refers to areas with residential or commercial structures and waterbodies are areas covered by rivers, ponds, dam, etc.
Image Classification method was done for the three images using supervised classification techniques in ArcMap 10.4.1. In this case, the training samples were selected based on the reflectance or the spectral characteristics of the classes. This technique gives more accurate results with a higher accuracy than the unsupervised technique (Tso & Mather, Citation2009). The supervised classification was carried out using the Maximum Likelihood Algorithm in ArcMap, and the selection of the training areas was based on the ground truth points obtained from Google Earth.
An accuracy assessment was further carried out to determine the feasibility of the classified images depending on the level of acceptance of error in the images. This is very essential for any classified image since all classified images are assumed to be inaccurate to only be used as a decision-based tool. This also served as a guide for the map’s quality and reliability. Hence, the accuracy assessment of these classified images was calculated using the Kappa coefficient statistics, K, and the error matrix. This was analyzed using ArcMap and later exported to Microsoft Excel for further analysis. Thus, a K > 0.80 indicates a strong agreement of the class assessed. Whiles a K between 0.40 and 0.80 showed a good agreement, and K < 0.40 showed a poor agreement (J. Jensen, Citation2005).
In this study, reference data consisting of 90 text pixels were generated based on a rule of thumb for all the three classes (Atayi et al., Citation2016). This was done in ArcMap 10.4.1 and later exported to MS Excel to further determine the kappa matrix (k), the overall accuracy, commission error (user’s accuracy) and omission error (producer’s accuracy) as stated in Lillesand et al. (Citation2015). The kappa coefficient (K) was determined as shown in EquationEquation (1)(1)
(1) :
where
is the total number of observations in the matrix
r is the number of rows in the matrix
is the number of observations in row i and column i
is the total for row i
is the total for column I (J. R. Jensen, Citation2014).
2.3.1. Land Surface Temperature or Thermal Map
The thermal map was generated using Landsat 7 & 8 images (i.e. band 6, 10 and 11) in ArcMap. This was obtained through the following steps:
(i) Conversion of Landsat 8 image to Top of Atmosphere (ToA) Radiance
The Operations Land Image (OLI) and Thermal Infrared Sensor (TIRS) were converted to ToA spectral radiance using radiance rescaling factors provided in Landsat 7 & 8 metadata. This was achieved using the formula below:
where
= ToA spectral radiance (Watts/(m2*srad*
)
= Band-specific multiplicative rescaling factor from the metadata (RADIANCE_MULT_BAND_x, where x is the band number (i.e. band 6, 10, 11, given as 0.055375, 0.067087, 0.037205 and 0003342, respectively)
= Band-specific additive rescaling factor from the metadata (RADIANCE_ADD_BAND_x, where x is the band number (band 6, 10, 11 given as −0.06709, 3.16280, 0.1000, respectively)
= Quantized and calibrated standard product pixel values (DN) (the band imagery used for the analysis; band 6, 10, 11).
(ii) Conversion to Top of Atmosphere Brightness Temperature
TIRS band data was converted from spectral radiance to top of atmosphere brightness temperature using the thermal constants provided in the metadata file;
where
T = Top of atmosphere brightness temperature (K)
= ToA spectral radiance (Watts/(m2*srad*
)
= Band-specific thermal conversion constant from the metadata (
_CONSTANT_BAND_x, where x is the thermal band number
= Band-specific thermal conversion constant from the metadata (
_CONSTANT_BAND_x, where x is the thermal band number
(iii) Conversion from At-satellite Temperature to Land Surface Temperature.
In this case, the satellite temperature was converted to land surface temperature using the following equation;
where
= wavelength of emitted radiance (centre wavelength of Landsat bands; for Landsat 8
(
)
= h*c/s = 1.4388*102 m K = 14388
K
= Planck’s constant = 6.626*10−34Js
= velocity of light = 2.998*102 m/s
= Boltzmann constant = 1.38*10−22 J/K
= Emissivity = 0.004*Pv + 0.986
Band 4, 5 was used to obtain NDVI by (Tech, Citation2018).
2.4. Change Detection
In order to determine the rate of increase or decrease in the land cover over Kumasi, a change detection technique was used to determine the land surface changes that had occurred from 1986 to 2015 (Lu et al., Citation2010). To better understand the rate of changes within this 30-year period, the annual rate of change from 1986 to 2007, 2007 to 2015 and 1986 to 2015 as was applied in Kaishaigili & Majaliwa (Citation2010) was also determined for Kumasi. Additionally, the generated land surface temperature maps for 1986, 2007 and 2015 were compared with the classified land cover images to assess the effect of changes in land cover on temperature within the city.
3. RESULTS AND DISCUSSION
3.1. Land Use Change Analysis
The classified land cover maps (Figure ) were used to determine the land use and land cover changes that occurred between 1986, 2007 and 2015, respectively, within Kumasi, with well-defined land cover classes (forest, built-up areas and waterbody). In comparison to the adjacent years, 2015 recorded the least overall accuracy (85.56%) and the least kappa coefficient (0.78), though these two values fall within the accepted range (a good comparison between the classified image and ground truth). This may be due to the dominance in the built-up areas with higher reflectance within Kumasi. The overall accuracy for this study was not 100% because of some few misclassifications of pixels which occurred in nearly all the classes due to the nature of the image used in terms of clouds and scan lines. Also, there was some difficulty in the differentiation of the spectral reflectance between the waterbody and forest (trees). Using Landsat images with low resolutions makes land cover analysis difficult as compared to the high-resolution images which are but are not freely accessed by the public.
Figure 3. Classified land cover maps for 1986, 2007 and 2015.
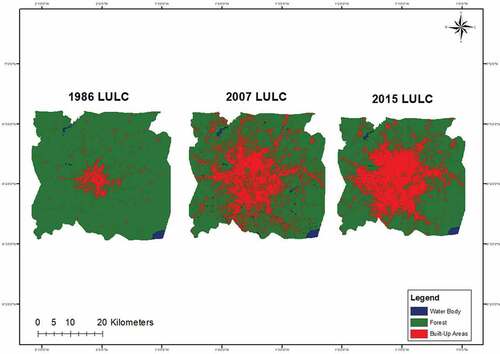
The spatial analysis of the LULC images shows that the built-up areas significantly increased from 1986 to 2015 (Figure ). These forest areas in Kumasi had the greatest loss, while the waterbodies exhibited very little change between 1986 and 2015 (Tables ). The observed decline in forest cover was mainly attributed to the increase in commercial and mechanized agricultural activities to meet the emergent needs for accommodation, provision of energy, food supply and creation of employment within such a developing city as Kumasi. The significant population growth rate of 331.56% for Kumasi from 1984 to 2015 (Figure ) explains this observed 24.13% increase (representing 55.81 km2 of the total land area of Kumasi) in the built-up environment between 1986 and 2015 (Table ). This finding is consistent with earlier studies by Koranteng (Citation2007) and Asare (Citation2014) who all reported that such extensive growth period in the built-up environments of developing cities such as Kumasi during the same study period was associated with the rapid population growth in many urban areas within Ghana. These changes in the land cover surface mainly arose due to the major architectural changes that also took place in Kumasi in response to the massive boost in the housing sector, as more people preferred semi-detached houses to the already existing compound houses (Poku-Boansi & Inkoom, Citation2011; Tontoh, Citation2011).
Table 2. LULC change analysis from 1986 to 2007
Table 3. LULC change analysis from 2007 to 2015
Table 4. LULC change analysis from 1986 to 2015
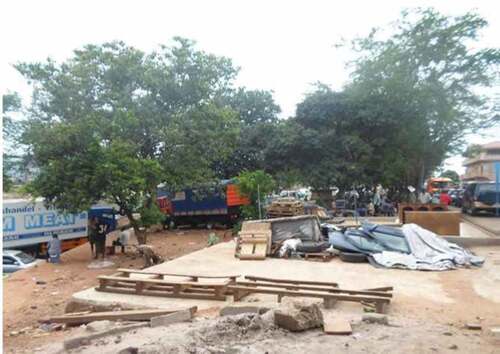
Additionally, with more people migrating into Kumasi (especially at the central business part of the city) as a result of urbanization, the acquisition of land now becomes very competitive. Thus, the increase in the purchase of many customary or government lands (formerly owned by traditional leaders or government) to private investors for building and construction purposes, without proper urban planning policies and corruption will further lead to the mismanagement of these lands and subsequently the uncontrolled deterioration of the green environment within the city (Fiadzigbey, Citation2006; Grant, Citation2009). According to Dinye et al. (Citation1987), most parts of Kumasi had beautiful physical landscape with green parks and waterway tributaries that transected the city through its neighbourhoods (Atonsu, Kaase, Bantama and Aboabo). However, these parks and gardens (Adehyeman Gardens, Suntreso Park, Kumasi Children’s Park, the Kumasi Zoological Gardens, Fante Newtown Park, Abbey’s Park, Jackson Park, Prince of Wales Park, Para Gardens, Kumasi Race Course, Kotoko Park, etc.) that fulfilled the recreational needs of the individuals and further beautified the city have all been encroached upon or developed into built-up environments (Figure ), thereby casting a negative image on the ‘Garden City’ of Kumasi (Mensah, Citation2014a).
Figure 4. Population pattern in Kumasi since 1984 (Source: Kumasi metropolitan assembly, 2016).
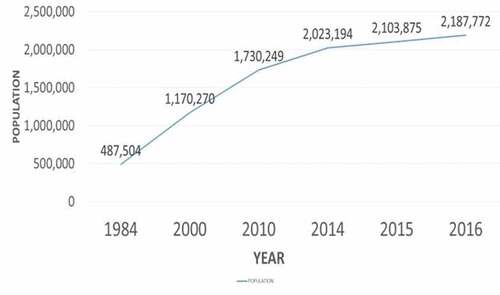
Figure 5. Parts of Fante newtown park destroyed for commercial activities (Source: Mensah, Citation2014b).
3.1.1. Relationship between the land surface temperature and the land cover type
The mean land surface temperature (LST) increased across all the nine governmental administrative areas from 1986 to 2015 (Figure and Table ). The highest increase in the mean LST (4.16°C) was observed within the Kumasi Metropolitan Assembly (central business area of Kumasi), with the lowest increase in the mean LST (0.46°C) also seen within the Atwima Kwanwoma District. Moreover, to better understand the effect of the land cover changes on LST, a ground validation technique was used to assess the areas with a significant increase in LST. It was evident that these areas which were characterized by an increase in LST (such as the Kumasi Metropolitan Assembly, Asokore Mampong and Ejisu Juaben) had undergone significant land cover changes over the 30-year period. These districts which used to be mostly vegetated had been replaced by built-up/artificial surfaces that comprised impervious layers like concrete, black asphalt, bricks and stones (Mensah, Citation2014b). The absorption and release of heat by these built-up areas contributed to the warming of the surrounding environment as recorded from 1986 to 2015 within the city (Mahmoud, Citation2011; Wang et al., Citation2017). To further appreciate the relationship between the land cover types and the LST, the mean values of the LST for 1986, 2007 and 2015 with their corresponding percentage annual rate of change in land cover were correlated. The results showed a strong positive correlation between the mean LST and percentage annual rate of change in land cover across all the nine governmental administrative districts within Kumasi (p <0.00001). This supports the finding from this study on the increase in the mean LST at places characterized by an increase in built-up surfaces. The results also agree with other findings from Hu et al. (Citation2015); Connors et al. (Citation2013) and Igun and Williams (Citation2018) that shows how an increase in the built-up areas within some big cities like JingjinTang (China), Phoenix (US) and Lagos (Nigeria) led to a rise in LST.
Figure 6. Thermal map of Kumasi in January of 1986, 2007 and 2015. Where KMA refers to the Kumasi metropolitan assembly and AMM also refers to the Asokore Mampong Municipal.
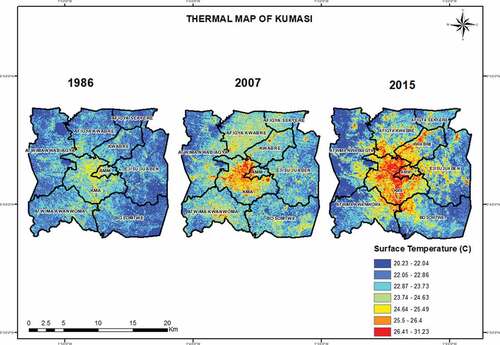
Table 5. Mean LST for each governmental administrative district across Kumasi (1986–2015)
Table 6. The maximum, minimum and mean LST for Kumasi (1986–2015)
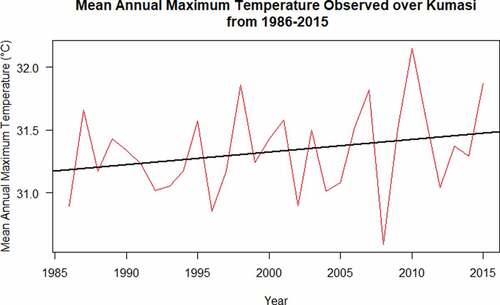
Consequently, since minimum temperatures often occur at night, a high rate of increase in the mean annual minimum temperatures (0.02°C/year) as compared to the rate of increase in the mean annual maximum temperature (0.01°C/year) as observed in Figures and over the 30-year study period suggests an associated thermal discomfort at night-time within the Kumasi metropolis (Morini et al., Citation2018; Ongoma et al., Citation2016).
Figure 7. The trend of the mean annual minimum temperature from 1986–2015 for Kumasi.
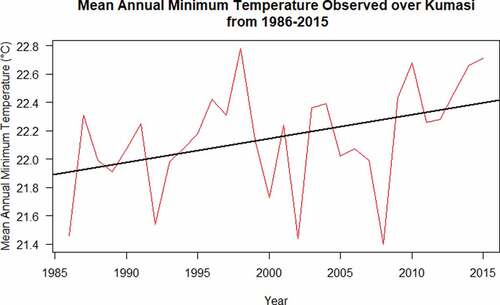
Figure 8. The trend of the mean annual maximum temperature from 1986–2015 for Kumasi.
The World Health Organization in their recent report in 2018 predicted that such thermal discomfort as experienced by developing urban areas, as a consequence of rising minimum temperatures may lead to the frequent occurrence and spread of respiratory diseases in many overcrowded areas within such cities (Hall & Tewdwr-Jones, Citation2010; McGrane, Citation2016). Therefore, there is the need for both the government and the Kumasi city planners to incorporate environmentally sustainable strategies that also cools the city in future urban planning measures. The planting of deciduous trees and creation of green parks around the city will also decrease the heat stress and cool the environment.
3.2. CONCLUSION AND RECOMMENDATIONS
This study utilized remote sensing data and GIS technique as valuable tools in assessing the effect of the land cover change due to urban growth on the microclimate within Kumasi, especially the land surface temperature from 1986 to 2015. The changes in land cover from a green vegetated surface to a more non-transpiring and reduced evaporative built-up or artificial surface cover over the most central part of Kumasi were mainly due to the development of large areas within the city into housing and commercial centres to meet the needs of the ever-increasing number in population since 2000. Such urban growth activities contributed to the overall increase in the LST over most areas within the city as observed from the 2007 and 2015 Landsat thermal images.
From this study, we reiterate the need for proper mitigation and adaptive policies in modern city planning, to minimize the effects of the heat stress, while improving upon the air quality flow within the city. Most urban cities in Africa continue to grow at a rate of 4.87% per annum, as such, there is the need to integrate some innovative urban sustainability practices such as green walls, green roofs, green spaces, white or reflective materials in the construction of buildings, roofs, pavements and roads to increase the overall albedo effect of the city. The application of such cool roofs (made from reflective materials), reflective glass, green roofs and light coloured concrete will aid in reflecting up to about 50% more light and reduce or regulate surface temperature. Green roofs will also be excellent insulators during warmer months to cool the surrounding environment. With the right siting of buildings to improve ventilation, air quality will be enhanced as free movement of air flows within the city.
Finally, the use of other renewable energy sources such as solar or biofuel technologies to meet the energy demand of urban cities like Kumasi will limit the combustion of fossil fuels and reduce its harmful effects on the environment.
correction
This article has been republished with minor changes. These changes do not impact the academic content of the article.
Additional information
Funding
Notes on contributors
Caleb Mensah
We are a group of Climate Scientists with a common research interest in the tropical climate systems. Our current research work was conducted to assess the extent of the decline in the green vegetation land cover over Kumasi in recent times and investigate the effect on land surface temperature. We are of the firm belief that these findings will inform city planners in designing sustainable urban planning strategies with green vegetation conservation initiatives across developing cities within the tropical region. Not only will such beautiful physical landscapes with green spaces ease the thermal discomfort within these cities but also fulfil the recreational needs of inhabitants while promoting clean air circulation.
References
- Amiri, R., Weng, Q., Alimohammadi, A., & Alavipanah, S. K. (2009). Spatial–temporal dynamics of land surface temperature in relation to fractional vegetation cover and land use/cover in the Tabriz urban area, Iran. Remote sensing of environment, 113(12), 2606–2617.
- Arhin, K., & Afari-Gyan, K. (1992). The city of Kumasi: Past, present and future. Technical Report Institute of African Studies.
- Asare, G. E. (2014). Kumasi: The garden city without gardens. Daily Graphic, Accra: Graphic Communications Group (pp. 40–41). http://graphic.com.gh/features/features/10748-kumasi-the-gardencity-without-gardens.html
- Assessment, M. E. (2005). Ecosystem and human well-being: Biodiversity synthesis. Technical Report World Resources Institute.
- Atayi, J., Kabo-bah, A., & Akpoti, K. (2016). The effects of large-scale mining on land use and land cover changes using remotely sensed data 1. International Journal of Science and Nature, 7, 724–16. http://scienceandnature.org/IJSN_Vol7(4)D2016/IJSN-VOL7(4)16-5.pdf
- Burkart, K., Schneider, A., Breitner, S., Khan, M. H., Krämer, A., & Endlicher, W. (2011). The effect of atmospheric thermal conditions and urban thermal pollution on all-cause and cardiovascular mortality in Bangladesh. Environmental Pollution, 159(8–9), 2035–2043.
- Chen, M., Liu, W., & Tao, X. (2013). Evolution and assessment on China's urbanization 1960–2010: under-urbanization or over-urbanization?. Habitat International, 38, 25–33.
- Christen, A., & Vogt, R. (2004). Energy and radiation balance of a central European city. International Journal of Climatology, 24(11), 1395–1421. https://doi.org/10.1002/joc.1074
- Clark, B. (2003). Ebenezer Howard and the marriage of town and country: An introduction to Howard’s garden cities of tomorrow. Organization and Environment, 16(1), 87–97. https://doi.org/10.1177/1086026602250258
- Cobbinah, P., & Amoako, C. (2012). Urban sprawl and loss of peri-urban land in Kumasi, Ghana. International Journal of Social and Human Sciences, 6, 388–397. https://www.google.cz/url?sa=t&rct=j&q=&esrc=s&source=web&cd=&cad=rja&uact=8&ved=2ahUKEwiUsPqN66XqAhWPy6QKHU5NCFAQFjABegQIBBAB&url=https%3A%2F%2Fpdfs.semanticscholar.org%2F3606%2F67b32e8e1e6553c0d74388224fd5b38e5e31.pdf&usg=AOvVaw28pOueMWSxnDpb_aAh4NxP
- Connors, J. P., Galletti, C. S., & Chow, W. T. (2013). Landscape configuration and urban heat island effects: Assessing the relationship between landscape characteristics and land surface temperature in Phoenix, Arizona. Landscape Ecology, 28(2), 271–283. https://doi.org/10.1007/s10980-012-9833-1
- Corovic, D. (2009). The garden city concept: From theory to implementation. Case Study: Professors’ Colony in Belgrade. SAJ: Serbian architectural journal, 1(1), 65–80. https://www.google.cz/url?sa=t&rct=j&q=&esrc=s&source=web&cd=&cad=rja&uact=8&ved=2ahUKEwiR4Y3B7KXqAhWjNOwKHecLDbUQFjAAegQIAhAB&url=http%3A%2F%2Fraf.arh.bg.ac.rs%2Fbitstream%2Fid%2F1174%2FSAJ-2009-01-D-Corovic.pdf&usg=AOvVaw3qGSMJPNcQnQbkg9ljNDVo
- Demuzere, M., Orru, K., Heidrich, O., Olazabal, E., Geneletti, D., Orru, H., Faehnle, M., Mittal, N., Feliu, E., & Faehnle, M. (2014). Mitigating and adapting to climate change: Multifunctional and multi-scale assessment of green urban infrastructure. Journal of Environmental Management, 146, 107–115. https://doi.org/10.1016/j.jenvman.2014.07.025
- Desa, U. (2014). World urbanization prospects, the 2011 revision. Population Division, department of economic and social affairs, United Nations Secretariat.
- Dinye, R., Edusei, J., & King, R. (1987). District resources development handbook: Kumasi district. Department of Housing and Planning Research.
- Eduful, M. (2014). Impacts of urban land use change on sources of drinking water in Kumasi, Ghana. University of Montana.
- Emmanuel, R., & Loconsole, A. (2015). Green infrastructure as an adaptation approach to tackling urban overheating in the Glasgow Clyde valley region, UK. Landscape and Urban Planning, 138, 71–86. https://doi.org/10.1016/j.landurbplan.2015.02.012
- Fiadzigbey, M. E. (2006). Customary Land Administration in Ghana. Challenges and Prospects; XXIII FIG Congress.
- Gal, T., & Unger, J. (2009). Detection of ventilation paths using high-resolution roughness parameter mapping in a large urban area. Building and Environment, 44(1), 198–206. https://doi.org/10.1016/j.buildenv.2008.02.008
- Gillis, M., Shoup, C., & Sicat, G. (2001). World development report 2000/2001 attacking poverty. The World Bank.
- Grant, R. (2009). Globalizing city: The urban and economic transformation of Accra, Ghana. Syracuse University Press.
- Grimmond, C., & Oke, T. (2002). Turbulent heat fluxes in urban areas: Observations and local- scale urban meteorological parameterization scheme (lumps). Journal of Applied Meteorology, 41(7), 792–810. https://doi.org/10.1175/1520-0450(2002)041<0792:THFIUA>2.0.CO;2
- Hall, P., & Tewdwr-Jones, M. (2010). Urban and regional planning. Routledge.
- Howard, E. (2014). Garden cities of tomorrow. Lemur Books.
- Hu, Y., Jia, G., Hou, M., Zhang, X., Zheng, F., & Liu, Y. (2015). The cumulative effects of urban expansion on land surface temperatures in metropolitan JingjinTang, China. Journal of Geophysical Research: Atmospheres, 120(19), 9932–9943. https://doi.org/10.1002/2015JD023653
- Igun, E., & Williams, M. (2018). Impact of urban land cover change on land surface temperature. Global Journal of Environmental Science and Management, 4(1), 47–58. https://www.gjesm.net/article_27798.html
- Jensen, J. (2005). Introductory digital image processing 3rd edition. Prentice hall.
- Jensen, J. R. (2014). Introductory digital image processing (3rd ed.). A Remote Sensing Perspective.
- Jim, C., & Chan, M. (2016). Urban greenspace delivery in Hong Kong: Spatial institutional limitations and solutions. Urban Forestry & Urban Greening, 18, 65–85. https://doi.org/10.1016/j.ufug.2016.03.015
- Karlessi, T., Santamouris, M., Synnefa, A., Assimakopoulos, D., Didaskalopoulos, P., & Apostolakis, K. (2011). Development and testing of PCM doped cool colored coatings to mitigate urban heat island and cool buildings. Building and Environment, 46(3), 570–576. https://doi.org/10.1016/j.buildenv.2010.09.003
- Kashaigili, J. J., & Majaliwa, A. M. (2010). Integrated assessment of land use and cover changes in the Malagarasi river catchment in Tanzania. Physics and Chemistry of the Earth, Parts A/B/C, 35(13–14), 730–741.
- Koranteng, A. (2007). The study of the land use/cover of Kumasi and its environs using landsat images. Biblioteka Nauci.
- Larsen, L. (2015). Urban climate and adaptation strategies. Frontiers in Ecology and the Environment, 13(9), 486–492. https://doi.org/10.1890/150103
- Le Quéré, C., Andres, R. J., Boden, T., Conway, T., Houghton, R. A., House, J. I., … Andrew, R. M. (2013). The global carbon budget 1959–2011, Earth Syst. Science Data, 5, 165–185. doi:10.5194/essd-5-165-2013
- Li, J., Song, C., Cao, L., Zhu, F., Meng, X., & Wu, J. (2011). Impacts of landscape structure on surface urban heat islands: A case study of Shanghai, China. Remote Sensing of Environment, 115(12), 3249–3263. https://doi.org/10.1016/j.rse.2011.07.008
- Lillesand, T., Kiefer, R. W., & Chipman, J. (2015). Remote sensing and image interpretation. John Wiley & Sons.
- Lu, D., Hetrick, S., & Moran, E. (2010). Land cover classification in a complex urban-rural landscape with quick bird imagery. Photogrammetric Engineering & Remote Sensing, 76(10), 1159–1168. https://doi.org/10.14358/PERS.76.10.1159
- Mahmoud, A. H. A. (2011). Analysis of the microclimatic and human comfort conditions in an urban park in hot and arid regions. Building and Environment, 46(12), 2641–2656. https://doi.org/10.1016/j.buildenv.2011.06.025
- Manu, A., Twumasi, A., & Coleman, L. (2006). Is it the result of global warming or urbanization? The rise in air temperature in two cities in Ghana. In Promoting land administration and good governance 5th FIG regional conference. Ghana: Accra.
- Maoulidi, M. (2010). A water and sanitation needs assessment for Kumasi, Ghana. Millennium Cities Initiative.
- Matthews, T., Lo, A., & Bryne, J. (2015). Re-conceptualizing green infrastructure for climate change adaptation: Barriers to adoption and drivers for uptake by spatial planners. Landscape and Urban Planning, 138, 155–163. https://doi.org/10.1016/j.landurbplan.2015.02.010
- McCaskie, T. (2007). Denkyira in the making of ASANTEC. 1660–1720. The Journal of African History, 48(1), 1–25. https://doi.org/10.1017/S0021853706002507
- McGrane, S. J. (2016). Impacts of urbanization on hydrological and water quality dynamics, and urban water management: A review. Hydrological Sciences Journal, 61(13), 2295–2311. https://doi.org/10.1080/02626667.2015.1128084
- Mensah, C. A. (2014a). Is Kumasi still a garden city, land use analysis between 1980-2010. Journal of Environment and Ecology, 5(2), 89–107. https://doi.org/10.5296/jee.v5i2.5968
- Mensah, C., Amekudzi, L., Klutse, N., Aryee, J., & Asare, K. (2016). Comparison of rainy season onset, cessation and duration for Ghana from Regcm4 and GMet datasets. Atmospheric and Climate Sciences, 6(2), 300–309. https://doi.org/10.4236/acs.2016.62025
- Mensah, C. A. (2014b). Destruction of urban green spaces: A problem beyond urbanization in Kumasi City (Ghana). American Journal of Environmental Protection, 3(1), 1–9. https://doi.org/10.11648/j.ajep.20140301.11
- Moonen, P., Defraeye, T., Dorer, V., Blocken, B., & Carmeliet, J. (2012). Urban physics: Effect of the micro-climate on comfort, health and energy demand. Frontiers of Architectural Research, 1(3), 197–228. https://doi.org/10.1016/j.foar.2012.05.002
- Morini, E., Touchaei, A. G., Rossi, F., Cotana, F., & Akbari, H. (2018). Evaluation of Albedo enhancement to mitigate impacts of urban heat island in Rome (Italy) using WRF meteorological model. Urban Climate, 24, 551–566. https://doi.org/10.1016/j.uclim.2017.08.001
- Nero, B., Campion, B., Agbo, N., Callo-Concha, D., & Denich, M. (2017). Tree and trait diversity, species coexistence, and diversity- functional relations of green spaces in Kumasi, Ghana. Procedia Engineering, 198, 99–115. https://doi.org/10.1016/j.proeng.2017.07.164
- Ongoma, V., Muange, K. P., & Zablon, W. S. (2016). Potential effects of urbanization on urban thermal comfort, a case study of Nairobi city, Kenya: A review. Geographica Pannonica, 20(1), 19–31. https://doi.org/10.5937/GeoPan1601019O
- Poku-Boansi, M., & Inkoom, D. K. B. (2011). Urbanization and human security in the Kumasi metropolis. Future of the tree: Towards growth and development of Kumasi, 234–248, KNUST Printing Press.
- Quagraine, V. (2011). Urban landscape depletion in the Kumasi Metropolis. Future of the tree: Towards growth and development of Kumasi, 212–233, KNUST Printing Press.
- Rodríguez, J. (2007). United Nations expert group meeting on population distribution, urbanization, internal migration and development. United Nations Secretariat New York, 21–23.
- Saghir, J. (2018). Urbanization in sub-Saharan Africa meeting challenges by bridging stakeholders. Center for Strategic and International Studies.
- Schellnhuber, H. J., Frieler, K., & Kabat, P. (2014). The elephant, the blind, and the intersectoral intercomparison of climate impacts. Proceedings of the National Academy of Sciences, 111(9), 3225–3227. https://doi.org/10.1073/pnas.1321791111
- Schmidt, S. (2005). Cultural influences and the built environment: An examination of Kumasi, Ghana. Journal of Urban Design, 10(3), 353–370. https://doi.org/10.1080/13574800500297751
- Stull, R. B. (2012). An introduction to boundary layer meteorology, 13. Springer Science and Business Media.
- Tech, G. (2018). Calculating of land air temperature Landsat8 by ArcGIS (Youtube).
- Tontoh, A. (2011). A study to ascertain the growth situation of the Kumasi Metropolitan Area (KMA): A remote sensing approach [Ph.D. thesis Kwame Nkrumah University of Science and Technology]. KNUST Printing Press.
- Tso, B., & Mather, P. (2009). Classification methods for remotely sensed data (LC-0431). CRC Press.
- Wang, Y., Zhan, Q., & Ouyang, W. (2017). Impact of urban climate landscape patterns on land air temperature in Wuhan, China. Sustainability, 9(10), 1700–1710. https://doi.org/10.3390/su9101700
- WHO – Ghana. (2018). Annual report. World Health Organization. https://www.afro.who.int/sites/default/files/2019-09/WHO%20Ghana%202018%20Annual%20Report.pdf
- Yuan, C., & Ng, E. (2012). Building porosity for better urban ventilation in high density cities: A computational parametric study. Building and Environment, 50, 176–189. https://doi.org/10.1016/j.buildenv.2011.10.023
- Zhibin, R., Haifeng, Z., Xingyuan, H., Dan, Z., & Xingyang, Y. (2015). Estimation of the relationship between urban vegetation configuration and land surface temperature with remote sensing. Journal of the Indian Society of Remote Sensing, 43(1),89–100.