
Abstract
Clean, safe and adequate freshwater is vital to the survival of all living organisms and smooth functioning of ecosystems, communities and economies. Surface water is becoming highly susceptible to pollution, and the trend of production of groundwater for various purposes has been increased from time to time. Groundwater will also be vulnerable to contamination by natural processes and anthropogenic disturbances and, thus, deserves appropriate attention and action. In the present study, spring water samples were collected from the Ankober district in low-, middle- and high-altitude areas in dry, semi-dry and wet seasons in 2015. Bacteriological (total coliform [TC] and fecal coliform [FC]) and physicochemical parameters such as temperature, pH, electrical conductivity, total dissolved solids, dissolved oxygen, salinity, total alkalinity (TA), total hardness (TH), Na+, K+, Ca2+, Mg2+, Fe2+, Mn2+, Cl−, SO42−, CO32−, HCO3−, NO3− and F− were analyzed to assess its suitability for domestic purposes. The results of the study showed that most of the parameters were found to be within the safe limit values of the WHO and Ethiopian standards for drinking water except some values at the lowest attitude area: TC/FC (147/1 per 100 ml) and F− (1.68 mg/L) in the dry season, Mg2+ (52.1 mg/L) in the semi-dry season and K+ (1.59–51.15 mg/L) in all three seasons. Furthermore, the values of Fe2+ (0.448–1.005 mg/L) were above the limit in most of the samples. Generally, spring water in the assessed areas is safe for domestic applications with slight variability in the low-altitude area. For sustainable use, vulnerability mapping and awareness creation are strongly recommended.
PUBLIC INTEREST STATEMENT
Groundwater has become the major source of water supply in most sectors of many countries. Groundwater from borehole (deep wells), shallow wells and springs is the most common source of drinking water in many areas of Ethiopia, mainly people residing in small towns and rural areas. However, no study has been done on groundwater quality for different uses. Thus, the paper examined physicochemical and bacteriological contamination of the groundwater in the study area. The values were compared with safe drinking water guidelines set by the WHO and Ethiopia. According to the results of this study, most of the physicochemical and bacteriological parameters were found to be within the safe limit values with the exception of a few parameters. Generally, groundwater of the assessed areas is safe for domestic applications with slight variability at low-altitude areas. For sustainable use, vulnerability mapping and awareness creation are strongly recommended.
1. Introduction
Surface water is becoming highly scarce and susceptible to pollution due to rapid urbanization, industrialization and intensification of agriculture. Surface water resources that are not witnessing pollution are drying up, probably due to climate change as well as increasing demand for development. As a result, pressure on groundwater for domestic, municipal, industrial and irrigation activities is growing from time to time (Yadav et al., Citation2012). Groundwater differs from surface water through its physical and chemical environment. It is stored in and transmitted through underground reservoir rocks/soils called aquifers (Lerner & Harris, Citation2009). Groundwater is the largest reserve of drinking water due to its long retention time and natural filtering effect of earth materials (Sebiawu et al., Citation2014). Nowadays, it has become the major source of water supply in most sectors of many countries. The groundwater will also be vulnerable to contamination due to the release of contaminants through several activities caused by natural processes (geological formation, dissolution and precipitation of minerals, groundwater velocity, infiltration rate, quality of recharge waters and interaction with other types of water aquifers) and the anthropogenic disturbances (Oluyemi, Citation2013; Shigut et al., Citation2017).
Poor-quality water affects human health and plant growth (Tabor et al., Citation2011). In developing countries like Ethiopia, around 80% of all diseases are directly related to poor drinking water quality and unhygienic conditions (WHO, Citation2006). Understanding the quality of groundwater is the prerequisite for determining its suitability for domestic, agricultural and industrial purposes. Many factors will have to be taken into account before making comments on groundwater quality (Mostafa et al., Citation2014). The use of the physicochemical and bacteriological parameters to assess water quality gives a good impression of the pollution status of the groundwater body (Vasanthavigar et al., Citation2012) which help to assess the chemical status and pollution levels of the aquifer (Tank & Chandel, Citation2010).
Groundwater from borehole (deep wells), shallow wells and springs is the most common source of drinking water in many areas of Ethiopia, mainly people residing in small towns and rural areas (Dawit et al., Citation2017; Tsega et al., Citation2013). In many parts of the country, rural residents use borehole or spring water for their domestic and drinking consumption without strict water quality monitoring (Amanial, Citation2015; Shigut et al., Citation2017). Groundwater projects are hardly supervised by trained groundwater professionals (Yasin et al., Citation2015). Like many developing regions, there exist few data for the general state of groundwater quality across Ethiopia (Alemayehu, Citation2006; Worako, Citation2015). In this study, the concern is the water quality of developed spring waters at Ankober district, 172 km far from Addis Ababa (the capital of Ethiopia), is found in North Shoa zones of Amhara National Regional State. It is located in the central parts of the northwestern Ethiopian plateau. The driving forces to this study were the possibility of spring water pollution by natural source pollutants from geologic inputs and anthropogenic activities such as increased fertilizer use, expansion of settlements and uncontrolled disposal of domestic wastes into the ground by the residents (Cao et al., Citation2019; Unamba et al., Citation2016).
Previously, no study has been done on the spring water quality status of the district. Hence, it is interesting to carry out an analysis of the physicochemical and bacteriological parameters as well as major ions and nutrients of the spring waters. Thus, the aim of this study was to assess the spatial and seasonal variation of the physicochemical and bacteriological water quality parameters at Ankober district. The assessment concentrates onbacteriological (total coliform [TC] and fecal coliform [FC]) and physicochemical parameters such as temperature, pH, electrical conductivity (EC), total dissolved solids (TDS), dissolved oxygen (DO), salinity, total alkalinity (TA), total hardness (TH), Na+, K+, Ca2+, Mg2+, Fe2+, Mn2+, Cl−, SO42−, CO32−, HCO3−, NO3− and F−. Besides, the results of this study were compared with national and international drinking water guidelines to understand its status with respect to the threshold levels and protect public health.
2. Materials and methods
2.1. Study area and description of sampling sites
The district is situated on the eastern escarpment of the Ethiopian highlands and situated 172 km north of Addis Ababa, the Ethiopian capital, and 42 km to the east of Debre Berhan town (the north Shewa Zone capital) at 9° 22ʹ–9° 45ʹ N and 039° 40ʹ–039°53ʹ E (Lulekal et al., Citation2013). The district is one of the ancient and historical areas of the Ethiopian kingdoms. The Gorabela/Ankober town has been the seat of the Ethiopian emperors from 1270 for centuries (Zatew & Yemane, Citation2007). The altitudinal gradient of the district ranges from 1300 m asl near Addis alem area to 3700 m asl at Kundi mountain. The district has a total population of 83,260 (42,180 men and 41,080 women) of whom only 6272 (7.5%) are urban inhabitants (Lulekal et al., Citation2013). Temperatures range from a minimum of −8°C to 4°C to a maximum of 18°C to 35°C. The average temperature of the surrounding area is 16.95°C with a mean maximum value of 27.29°C and a mean minimum value of 6.6°C. The mean annual rainfall of the area is 2550 mm falling in two wet seasons, from February to March and July to September. Groundwater from shallow aquifers is among the main source of drinking water supply in the district. There are 320 water systems that can provide water to the residents of the district (spring waters at the site of development (152), spring waters connected to tap system (50), motorized groundwater system (1), reservoirs under development (101), hand-dug wells (14) and rainwater harvesting systems from the roof (2)). However, developed spring waters were the concern areas of this study. Among 19 kebeles (lowest administrative units in Ethiopia) of Ankober district, 3 representative kebeles were selected purposely for this study depending on altitudinal gradient and agro-ecology. These are Lay Gorebella, Chefa and Hagere Selam. Specific sampling stations within each kebele (Kundi at Lay Gorebella Kebele; Chefa at Chefa Kebele; and Dinki at Hagere Selam Kebele were selected purposely) together with a brief description of each site are presented in Table .
Figure 1. Map of the study area showing the sampling points.
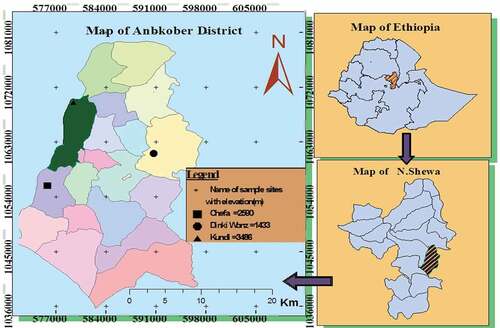
Table 1. Geographical location and description of developed spring water sampling sites
2.2. Sample collection
Spring water samples were collected at the aforementioned sites of the district in dry, semi-dry and wet seasons in 2015. The raw water samples were collected from the tap that pumps the spring water directly at the site after letting the water flow for 10 min and sterilizing the tip of the tap by using a lighter. From each sampling site, three types of samples were collected in plastic bottles of 1-l capacity for laboratory analysis. Three samples from each site were collected in sterilized plastic bottles and preserved for bacteriological analysis (collected in triplicate); the second one acidified and preserved with HNO3 for major ion analysis; and the third type from the same source was not acidified and preserved for other physicochemical parameter analysis. The collected samples were stored in an ice-box and transported to the laboratory for analyses (APHA, Citation1995). The bacteriological tests were undertaken within 6 h of collection to avoid death or growth of organisms in the sample (Monica, Citation2000). Some water quality parameters like temperature (oC), pH and EC (µS/cm) were measured in-situ by multi-probe portable meter.
2.3. Sample analysis procedures
2.3.1. Bacteriological analysis
TC and FC colonies were counted after 24 h of incubation at a temperature of 37°C and 44°C, respectively, using membrane filtration and membrane lauryl sulfate broth methods. Tests were conducted using 100 ml of water aseptically filtered through a nitrocellulose filter (Gelman Sciences, Michigan, USA). The filters were then layered on membrane lauryl sulfate broth for TC and FC. Yellow colonies for both TC and FC were counted using the colony counter.
2.3.2. Physicochemical analysis
Sodium, potassium, magnesium, calcium, iron and manganese were determined by atomic absorption spectrometer (Analytikjena, model novAA400P) using their respective standard hollow-cathode lamps (APHA, 1995). DO was determined by portable digital multi-parameter probe, HACH instruments (model-HQ30b). Analysis of nitrate and sulfate was carried out using HACH DRB 200 instrument in accordance with the procedures of the HACH manual). In addition, TH, chlorides, TA, carbonate and bicarbonate were determined using a volumetric method (APHA, 1995). Fluoride ion concentration was determined by ion-selective electrode method (model-Orion-EA940).
2.4. Data analysis
Results were analyzed using Microsoft Excel 2007. Correlations between measured parameters and spatial and seasonal variations of water samples collected from different water sources were computed using SPSS software (version 20). Water type of the specific aquifer has been plotted using the Aquachem 4 software.
3. Results and discussion
3.1. Bacteriological analysis
In developing countries, majority of the population is not adequately supplied with drinking water from protected and managed water supply network and are forced to use unprotected water from wells, springs and streams that may be unsafe for domestic application as a result of contamination through natural and anthropogenic interferences (Amanial, Citation2015). In the present study, the results indicated that the spring water samples have no fecal and TCs with the exception of one lowland site (Dinki) in the dry season (Table ). The slight bacterial contamination at Dinki might be attributed to leakage of contaminants from unprotected water sources as residents use the water for washing clothes and livestock consumption. Researches indicated that spring water could be polluted with fecal materials due to inadequate protection, distance and position and distance relative to latrine house, unhygienic practice at the source and poor environmental sanitation (Ali et al., Citation2011; singh et al., Citation2019; Takal & Quaye-Ballard, Citation2018). Generally, the bacteriological analysis showed that most of the samples from the analyzed springs were free from indicator organisms and thus comply with Ethiopian and WHO drinking water guidelines (Ethiopian water quality standard, Citation2002; WHO, Citation2006).
Table 2. Bacteriological parameters of spring water in three seasons
3.2. Physicochemical analysis
In order to manage the data, the physicochemical parameters of the spring water analyzed were classified as part I and part II.
3.2.1. Part I: Temperature, pH, DO, EC, salinity, TA, TDS and TH
Table represents the values of certain physicochemical parameters of spring water at Ankober district in three seasons. As can be seen from the table, the temperature of theses spring waters varies between a minimum and maximum value of 15°C at Kundi in the wet season and 27°C at Dinki in the dry season, respectively. This is beyond the WHO standard of <15°C (WHO, Citation1996). The higher temperature variability might be due to the current change in the climatic condition of the area.
Table 3. Physicochemical water quality parameters at three locations of Ankober district in three seasons
pH values of all the spring water samples measured were in the range from 6.65 to 7.5. This shows that the spring water in the study area is mainly near to neutral, and all the samples analyzed have concentration within the safe limit of 6.5–8.5 standard set by the WHO and Ethiopian drinking water guidelines. Good water should have solubility of oxygen in 7.0– 7.6 mg/L at 35°C to 36°C, respectively (Behailu et al., Citation2017; Puri et al., Citation2010). Oxygen-saturated water has a pleasant taste. In the present study, DO concentration ranged from 5.59 to 7.01 mg/L. The standard limit of DO in drinking water was 5.5 mg/L. This value is, therefore, within the recommended range. EC is directly related to the concentration of dissolved substances (ions) in the water. In the present study, the EC varied from 63.96 µS/cm (Kundi in a semi-dry season) to 300.37 µS/cm (Dinki in dry season). The results fall within the limits of national and international standards (the permissible limit for EC is 300 µS/cm) with the slight exception of Dinki in the dry season. Salinity often originates from the Earth’s crust, although the additions of fertilizers and organic matter may also contribute salts. In this study, the value of salinity varies from 57.17 ppm (Kundi at semi-dry season) to 259.33 ppm (Dinki in the dry season). The seasonal variation is also high at Dinki (from 259.33 ppm in dry and 70.4 ppm in wet season) (Dhawde et al., Citation2018).
TA is one of the few measurable quantities that can be used together with other quantities to calculate concentrations of species of the carbonate system (HCO3−, CO32− and OH−). It is primarily a way of measuring the acid-neutralizing capacity of water. Alkalinity is important as it protects or buffers against rapid pH changes. Large amounts of alkalinity impart a bitter taste in water. In the present study, the alkalinity of water samples varied from 9.2 mg/L (Kundi in dry season) to 52 mg/L (Dinki in wet season). The desirable value of alkalinity of drinking water is 200 mg/L and permissible value is 600 mg/L. Thus, the recorded value is within the range of permissible limits. Increasing trends of TA are noticed towards the dry season in all the three sites. TDS are the concentration of all the compounds available in a dissolved state in water. In the present study, TDS ranges from 58.17 mg/L (in Kundi at a semi-dry season) to 269.4 mg/L (Dinki in dry season). These values were within the standard limits of drinking water quality set by the WHO (500 mg/L). The hardness of water is primarily due to dispersion of bicarbonates, chlorides and sulfates in the water. The TH is represented in terms of CaCO3 which is a main water quality parameter. In the present study, the values for the TH varied from 40 mg/L (Kundi in semi-dry season) to 215 mg/L (Dinki in semi-dry season). All the results were within the standard limits of drinking water quality set by the WHO (300 mg/L) and national standard (392 mg/L). Generally, hardness in the study area could be described as soft (Kundi in all three seasons), moderately hard (Chefa in dry and wet seasons) and hard (Chefa in semi-dry and Dinki in all the three seasons).
The study revealed that the concentrations of major physicochemical parameters analyzed are well within the permissible limits of national and the WHO guidelines with the exception of temperature in most sites and EC in Dinki in dry season. Seasonal variation of most of the parameters is more significant at Dinki, which may be attributed to high climate variability in the site (dry throughout the year) (Ouma et al., Citation2016). Depending on the studied parameters, groundwater at Kundi and Chefa is safe for drinking and other domestic activities, while the low land area Dinki needs close supervision as a result of high variability (Cao et al., Citation2019; Dhawde et al., Citation2018).
3.2.2. Part II: major and trace ions
Metal ions such as Na+, K+, Mg2+, Ca2+ and Fe2+ are naturally present in groundwater, and they appear at unusually high concentrations as a result of contamination by natural and anthropogenic inputs (Barbieri et al., Citation2019; Olonga et al., Citation2015). In the present study, the average concentration of major ions in the analyzed spring water was in the following order: cations: sodium > magnesium > calcium > potassium, while anions: bicarbonate > chloride > nitrate > sulfate. Most of the cations were below the values set by the WHO and Ethiopian drinking water guidelines with the exception of Mg2+ in Dinki in semi-dry season (actual (52.1 mg/L), WHO (50 mg/L)), K+ in Dinki in all three seasons (actual (20.234 mg/L), WHO (1.5 mg/L)) and Fe2+ in most of the samples (Table ). All the three sites have a slightly higher concentration of iron, which may be attributed to the nature of the aquifer providing the water (Shigut et al., Citation2017). Water with iron concentration greater than 0.3 mg/L might have a noticeable bad taste. Chronic iron overload results primarily from a genetic disorder (haemochromatosis) characterized by increased iron absorption and from diseases that require frequent transfusion (WHO, Citation1996). Manganese was not detected in all the samples.
Table 4. Major and trace ions of spring waters at three locations of Ankober district in three seasons
Chloride ion is the most common ion in ground and surface water samples. In the present study, the chloride concentration ranged from nil (in most of the samples) to 21.4 mg/L (Chefa in wet season). The values were well within the permissible limits for human consumption (<250 mg/L). Sulfates are naturally occurring anions found almost in all types of water. According to WHO (Citation2008) guidelines for drinking water quality, SO42− should be 250 mg/L as a threshold level. In the present study, none of the samples has values greater than the recommended level. Bicarbonate is the major anion in the study area which varied from 9.173 (Kundi in the dry season) to 51.96 mg/L (Dinki in the wet season). As phenolphthalein alkalinity is absent, the hydroxide ion is very small in the water samples analyzed. The carbonate ions in all the samples were very small as compared to other anions. Nitrates generally occur in high levels in some spring/groundwater samples, including nitrogen-rich geologic deposits, wild-animal wastes, precipitation, septic system drainage, dairy and poultry production, municipal and industrial waste and fertilizer (Amanial, Citation2015). In the present study, nitrate concentration ranges from 0.2 to 5.2 mg/L. All the values were within the safe limit prescribed by national drinking water and the WHO guidelines (50 mg/L). This shows that the water is safe in terms of its NO3− content for drinking and other domestic uses. Table shows the values of these cations and anions. For some cations and anions, increasing trends towards the dry season is observed in all the three sites (Na+, Mg+2, Ca2+, HCO3− and F−).
Fluoride is essential for the normal mineralization of bones and the formation of dental enamel. However, higher values of fluoride ion in water results in fluorosis, skeletal tissue (bones and teeth) morbidity (Ethiopian water quality standard, Citation2002). In this study, fluoride concentration registered ranges from 0.11 (Kundi in wet season) to 1.68 mg/L (Dinki in dry season). Fluoride concentrations did not violate the guideline set by the WHO (1.5 mg/L) except for the 1.68 mg/L value recorded in Dinki in dry season. With regard to the Ethiopian drinking water limit of fluoride, it is below the value (3 mg/L). Generally, the concentrations of the ions were lower than the permissible limits in most spring water samples except few parameters.
3.3. Stiff diagrams of the major ions
In order to present and interpret the physicochemical parameters, various graphical methods can be used. In this particular interpretation, a Stiff diagram has been used to precisely represent the water type comprising the given aquifer. The Stiff method uses a scale for concentration of ions in meq/L along the x-axis. The ions are arranged along the y-axis in such a way that the cations (Na+, Ca2+, Mg2+, K+ and Fe2+) are to the left of the center of the plotting scale and the anions (HCO3−, NO3−, SO42−, CO32− and Cl−) are to the left of it. Stiff diagrams show the chemical character according to the absolute concentrations, thereby giving an overall expression of the cation–anion balance in a given aquifer. The diagram is used to understand major ion concentration and hence used to identify water type easily. Furthermore, the Stiff diagram is used to evaluate the change in water quality at a single location over time (Mckenzie et al., Citation2001; Tadesse et al., Citation2009; Yidana et al., Citation2010). – indicate the Stiff diagrams of the analyzed spring water samples in three seasons.
Figure 2. Stiff diagram of the Kundi site in three seasons.
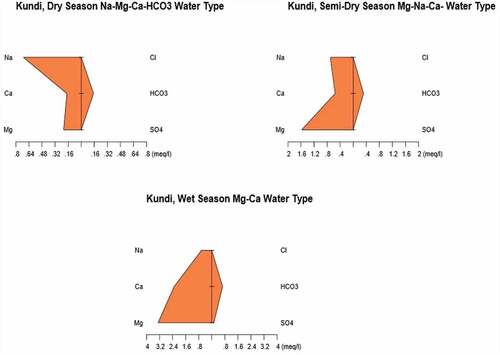
Figure 3. Stiff diagram of the Chefa site in three seasons.
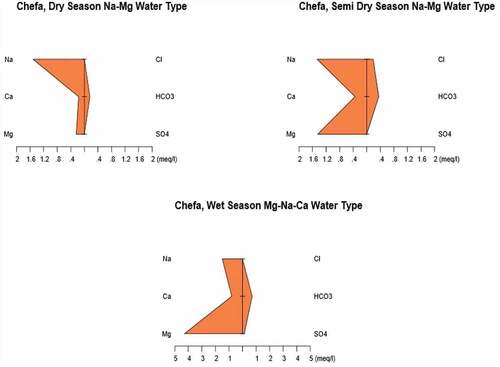
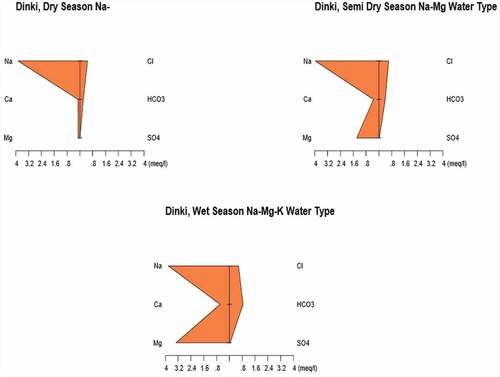
Figure 4. Stiff diagram of the Dinki site in three seasons.
Accordingly, water samples show mainly bicarbonate and sodium–magnesium type. For Kundi area in dry, semi-dry and wet seasons, the water type is represented by Na–Mg–Ca–HCO3 and Mg–Ca, respectively. This indicates that there is a pronounced seasonal variation of most of the major ions in the site. For the mid-altitude Chefa site, the trend is almost similar to the Kundi area with water type represented by Na–Mg, Na–Mg and Na–Mg–Ca type, respectively, in dry, semi-dry and wet seasons.
The last site in this particular study was the Dinki area with the lowest altitude and hottest area in the district. From the Stiff diagram of the site, Na, Na–Mg and Na–Mg–K type water is representing the aquifer in dry, semi-dry and wet seasons, respectively. This naming is based on the condition that the ions have contributed to more than 10% of the total concentration in the sample.
3.4. Correlation matrix of the physicochemical parameters
The correlation between water quality parameters greatly facilitates the task of rapid monitoring of water quality. The interactions within and between the physicochemical parameters of the different water sources were further verified by Pearson correlation. Table presents the Pearson correlation coefficient matrix between major physicochemical parameters of spring water of the study area. The variables having coefficient value (r) >0.050 are considered significant. Correlation is significant at 0.01 levels. The analytical data showed close significant positive association of temperature with TH (r = 0.803) and Cl− (r = 0.853); EC with TDS (r = 0.983) and salinity (r = 1.00); TDS with salinity (r = 0.983); TH with TA (r = 0.850) and Cl− (r = 0.853); with Cl− (r = 0.858); TA with Cl− (r = 0.840); Mg2+ with Ca2+ (r = 0.933), F− (r = 0.912) and HCO3− (r = 0.867); Ca2+ with F− (r = 0.937), SO42− (r = 0.798) and HCO3− (0.800); F− with HCO3− (r = 0.820); and finally SO42− with HCO3− (r = 0.853). It indicates that as increasing one parameter increases the other one with strong association and vice versa (Shigut et al., Citation2017). The significant positive correlation (p < 0.01) of the stated water quality parameters could possibly reveal that these ions have the same sources.
Table 5. The Pearson correlation matrix of the physicochemical parameters analyzed
4. Conclusions
In this study, bacteriological (FC and TC) and physicochemical parameters such as temperature (T), pH, EC, TDS, DO, salinity, TA, TH, Na+, K+, Ca2+, Mg2+, Fe2+, Mn2+, Cl−, SO42−, CO32−, HCO3, NO3− and F− of the spring water were measured. Most of the physicochemical parameters were found to be within the safe limit values except TC/FC in Dinki in dry season, Mg2+ in Dinki in semi-dry season, F− in Dinki in dry season, K+ in Dinki in all three seasons and Fe2+ in most of the samples. The bacteria contamination at Dinki may be attributed to leakage of contaminants from unprotected water sources as residents use the water for washing clothes and livestock consumption. The concentration of F− was found higher than the permissible levels of F− for safe drinking water set by the WHO but within the maximum standard values of Ethiopian drinking water quality guidelines. From the Stiff diagram, water samples showed mainly bicarbonate and sodium–magnesium type aquifer. Generally, spring water in the assessed areas is safe for domestic applications with slight contamination and variability in the lowland area. However, groundwater vulnerability mapping from updated hydrogeological data and awareness creation on water resource management of the area are strongly recommended for sustainable use.
Competing interests
The authors declare no competing interests.
Additional information
Funding
Notes on contributors
Alemnew Berhanu Kassegne
Alemnew Berhanu Kassegne is an environmental analytical chemist and holds a Bachelor's degree in chemistry, Bahir Dar University, Ethiopia, and Master of Science in inorganic chemistry and Doctor of Philosophy in environmental science, both from Addis Ababa University, Ethiopia. He is a member of the Chemical Society of Ethiopia (CSE) and Environmental Society of Ethiopia (ESE). Now, he is an assistant professor of environmental science at Debre Berhan University, Ethiopia. Kassegne’s research areas include ground and surface water quality assessment, persistent organic pollutants (OCPs, PCBs and PBDEs), potentially toxic trace metals and phytoremediation. In these areas, he has done extensive research works and published several peer-reviewed papers in different international reputable journals. The current study assessed the spatial and seasonal variations of the physicochemical and bacteriological water quality parameters at Ankober district, Ethiopia. It helps to understand the current state of water quality in the study area and provides precautionary measures taken by the respective stakeholders.
References
- Alemayehu, T. (2006). Groundwater occurrence in Ethiopia. Addis Ababa University.
- Ali, H., Bacha, K., & Ketema, T. (2011). Bacteriological quality and antimicrobial susceptibility of some isolates of well water used for drinking in Jimma town, southwest Ethiopia. Ethiopian Journal of Education and Sciences, 6, 95–15.
- Amanial, H. (2015). Assessment of physicochemical quality of spring water in Arbaminch, Ethiopia. Journal of Environmental Analytical Chemistry, 2, 2380–2391. 1000157. doi: 10.4172/2380-2391.1000157
- APHA. (1995). Standard methods for examination of water and wastewater (20th ed.). Washington: American Public Health Association
- Barbieri, M., Ricolfi, L., Vitale, S., Muteto, P. V., Nigro, A., & Sappa, G. (2019). Assessment of groundwater quality in the buffer zone of Limpopo National Park, Gaza Province, Southern Mozambique. Environmental Science and Pollution Research, 26(1), 62–77. https://doi.org/10.1007/s11356-018-3474-0
- Behailu, T., Badessa, T., & Tewodros, B. (2017). Analysis of physical and chemical parameters in ground water used for drinking around Konso Area, Southwestern Ethiopia. J Anal Bioanal Tech, 8, 1–7. doi: 10.4172/2155-9872.1000379
- Cao, X., LU, Y., Wang, C., Zhang, M., Yuan, J., Zhang, A., Song, S., Baninla, Y., Khan, K., & Wang, Y. (2019). Hydrogeochemistry and quality of surface water and groundwater in the drinking water source area of an urbanizing region. Ecotoxicology and Environmental Safety, 186, 109628. https://doi.org/10.1016/j.ecoenv.2019.109628
- Dawit, M., Nagari, A., & Hailu, H. (2017). Ground water quality assessment of the rural administrative, Dire Dawa City, Eastern Ethiopia. J Hydrogeol Hydrol Eng, 6 (3), 2. 5 doi: 10.4172/2325-9647.1000160
- Dhawde, R., Surve, N., Macaden, R., Wennberg, A., Seifert-Dähnn, I., Ghadge, A., & Birdi, T. (2018). Physicochemical and bacteriological analysis of water quality in drought prone areas of Pune and Satara districts of Maharashtra, India. Environments, 5(5), 61. https://doi.org/10.3390/environments5050061
- Ethiopian water quality standard. (2002). Ethiopian guidelines, specification for drinking water quality. The Federal Democratic Republic of Ethiopia Ministry of Water Resources. Addis Ababa, Ethiopia.
- Lerner, D. N., & Harris, B. (2009). The relationship between land use and groundwater resources and quality. Land Use Policy, 26, S265–S273. https://doi.org/10.1016/j.landusepol.2009.09.005
- Lulekal, E., Asfaw, Z., Kelbessa, E., & Van Damme, P. (2013). Ethnomedicinal study of plants used for human ailments in Ankober district, North Shewa Zone, Amhara region, Ethiopia. Journal of Ethnobiology and Ethnomedicine, 9(1), 63. https://doi.org/10.1186/1746-4269-9-63
- Mckenzie, J. M., Siegel, D. I., Patterson, W., & mckenzie, D. J. (2001). A geochemical survey of spring water from the main Ethiopian Rift valley, southern Ethiopia: Implications for well-head protection. Hydrogeology Journal, 9(3), 265–272. https://doi.org/10.1007/s100400100134
- Monica, C. (2000). District laboratory practice in tropical countries. Part, 2, 348–361.
- Mostafa, A. H., Al-Wasify, R. S., Sayed, A. M., & Haroun, B. M. (2014). Microbiological and physicochemical evaluation of groundwater in Egypt. International Journal of Environment and Sustainability, 2(2). www.sciencetarget.com
- Olonga, R., Nduda, E., & Makokha, M. (2015). Seasonal variations of physico-chemical and microbiological characteristics of groundwater quality in Ruiru, Kiambu County, Kenya. International Journal of Scientific and Research Publications, 5(12), 411–423. www.ijsrp.org
- Oluyemi, A. (2013). Determination of water quality of selected public wells in Ekiti State, South-Western Nigeria. Scientific Journal of Environmental Sciences, 228(1295), 1–10. www.Sjournals.com
- Ouma, S., Ngeranwa, J., Juma, K., & Mburu, D. (2016). Seasonal variation of the physicochemical and bacteriological quality of water from five rural catchment areas of Lake Victoria Basin in Kenya. Journal of Environmental Analytical Chemistry, 3, 170. doi:10.4172/2380-2391.1000170
- Puri, P. J., Yenkie, M., Battalwar, D., Gandhare, N. V., & Dhanorkar, D. B. (2010). Study and interpretation of physico-chemical characteristic of lake water quality in Nagpur city (India). Rasayan J. Chemistry, 3, 800–810.
- Sebiawu, G. E., Fosu, S. A., & Saana, S. B. B. M. (2014). A physico-chemical and bacteriological analysis of borehole water samples from the Wa municipality of the upper west region, Ghana. International Journal of Engineering Research, 3(5). http://www.rasayanjournal.com
- Shigut, D. A., Liknew, G., Irge, D. D., & Ahmad, T. (2017). Assessment of physico-chemical quality of borehole and spring water sources supplied to Robe Town, Oromia region, Ethiopia. Applied Water Science, 7(1), 155–164. https://doi.org/10.1007/s13201-016-0502-4
- singh, A. K., Das, S., Singh, S., Pradhan, N., Gajamer, V. R., Kumar, S., Lepcha, Y. D., & Tiwari, H. K. (2019). Physicochemical and microbiological profile of the potable water of Eastern Himalayan State Sikkim: An indication of severe fecal contamination and immediate health risk. Frontiers in Public Health, 7, 174. https://doi.org/10.3389/fpubh.2019.00174
- Tabor, M., Kibret, M., & Abera, B. (2011). Bacteriological and physicochemical quality of drinking water and hygiene-sanitation practices of the consumers in Bahir Dar city, Ethiopia. Ethiopian Journal of Health Sciences, 21(1), 19–26. https://doi.org/10.4314/ejhs.v21i1.69040
- Tadesse, N., Bheemalingeswara, K., & Berhane, A. (2009). Groundwater suitability for irrigation: A case study from Debre Kidane watershed, Eastern Tigray, Ethiopia. Momona Ethiopian Journal of Science, 1(1). doi: 10.4314/mejs.v1i1.46040
- Takal, J. K., & Quaye-Ballard, J. A. (2018). Bacteriological contamination of groundwater in relation to septic tanks location in Ashanti Region, Ghana. Cogent Environmental Science, 4(1), 1556197. https://doi.org/10.1080/23311843.2018.1556197
- Tank, D. K., & Chandel, C. S. (2010). Analysis of the major ion constituents in groundwater of Jaipur city. Nature and Science, 8(10), 1–7.
- Tsega, N., Sahile, S., Kibret, M., & Abera, B. (2013). Bacteriological and physico-chemical quality of drinking water sources in a rural community of Ethiopia. African Health Sciences, 13(4), 1156–1161. https://doi.org/10.4314/ahs.v13i4.42
- Unamba, C. L., Chika, E., & Isu, N. R. (2016). Physicochemical and bacteriological assessment of some borehole waters in the Federal Capital Territory, Nigeria. The International Research Journal of Public and Environmental Health, 3(6), 140–145. http://dx.doi.org/10.15739/irjpeh.16.018
- Vasanthavigar, M., Srinivasamoorthy, K., & Prasanna, M. (2012). Evaluation of groundwater suitability for domestic, irrigational, and industrial purposes: A case study from Thirumanimuttar river basin, Tamilnadu, India. Environmental Monitoring and Assessment, 184(1), 405–420. https://doi.org/10.1007/s10661-011-1977-y
- WHO. (1996). Guidelines for drinking-water quality – Second edition – Volume 2 – Health criteria and other supporting information. Who 1996, 2(1152404), 15.
- WHO. (2006). Guidelines for drinking water quality first addendum to (Vol. 1, Third ed.). Recommendations Geneva.
- WHO. (2008). Guideline for drinking water quality, 2, health criteria and other supporting information.
- Worako, A. W. (2015). Physicochemical and biological water quality assessment of Lake Hawassa for multiple designated water uses. Journal of Urban and Environmental Engineering, 9(2), 146–157. https://doi.org/10.4090/juee.2015.v9n2.146-157
- Yadav, K. K., Gupta, N., Kumar, V., Arya, S., & Singh, D. (2012). Physico-chemical analysis of selected ground water samples of Agra city, India. Recent Research in Science and Technology, 4(11), 51-54. http://recent-science.com/
- Yasin, M., Ketema, T., & Bacha, K. (2015). Physico-chemical and bacteriological quality of drinking water of different sources, Jimma zone, Southwest Ethiopia. BMC Research Notes, 8(1), 541. https://doi.org/10.1186/s13104-015-1376-5
- Yidana, S. M., Banoeng-Yakubo, B., & Akabzaa, T. M. (2010). Analysis of groundwater quality using multivariate and spatial analyses in the Keta basin, Ghana. Journal of African Earth Sciences, 58(2), 220–234. https://doi.org/10.1016/j.jafrearsci.2010.03.003
- Zatew, E., & Yemane, B. (2007). Millenium Ankober. Ankober District, Culture and Tourism Office.