
 ?Mathematical formulae have been encoded as MathML and are displayed in this HTML version using MathJax in order to improve their display. Uncheck the box to turn MathJax off. This feature requires Javascript. Click on a formula to zoom.
Abstract
Miombo woodlands support diverse biodiversity and livelihoods of millions of people in Africa. Although these woodlands contain less carbon than humid forests, they are important for having large coverage and thus potentially important for national REDD+ carbon accounting. These woodlands are highly susceptible to forest degradation due to anthropogenic activities. Degradation activities are difficult to assess through remote sensing techniques alone. Alternatively, they can be estimated by using proxy variables such as infrastructure and settlements. This study is focused on the assessment of spatial patterns of forest degradation in Miombo woodland in Southern Tanzania. Diameter of stumps was collected through inventory of circular plots of 15 m radius in 25 transects at 500 m, 2500 m and 3500 m distance from the forest border. Group discussions and interviews with key informants provided additional information about local degradation activities. The spatial relationship between forest degradation and the proxy variables: major roads, settlements and forest edge were assessed with logistic and mixed linear regression analysis. Among all, the distance to settlement was found to be the best predictor for degradation in the study area.
Public interest statement
Miombo woodland though have significant importance in supplying ecosystem services and benefiting livelihood of rural population, is affected by degradation mainly due to fuelwood collection, charcoal making and tobacco curing. The assessment of these degradation factors demands high quality satellite images and costly measures. It is mandatory to have updated data and record of carbon for the developing countries like Tanzania which aims at getting financial incentives through REDD+. This paper investigate if proxy variables can be used to understand the forest degradation factors and its impact on carbon stock. The indirect method using proxy variables: distance to forest, settlement and forest edge is used to assess the spatial pattern of forest degradation. Among all, distance to settlement variable was found to be the best predictor for degradation in the study area. Therefore, the assessment of forest degradation using these kind of low cost techniques can be useful for the developing countries like Tanzania.
Competing Interests
The authors declares no competing interests.
1. Introduction
Tropical forests support high biological diversity and ecosystem services. However, these forests are decreasing annually through deforestation and forest degradation (FAO, Citation2010); among these services is the forest’s ability to sequester carbon. Loss of forest cover in the tropics accounted for 4.8 gigatons of annual gross carbon dioxide emission that is 8–10% of annual emission from human induced sources (Dean, Citation2019; WRI, Citation2018). Forest degradation alone contributed 25% of total emissions from deforestation and forest degradation, even exceeded emissions from deforestation in some countries (Pearson et al., Citation2017). One of the definitions of forest degradation is “the overuse or poor management of forests that leads to a long-term reduction in (biomass density) carbon stocks” (Penman et al., Citation2003). This study focuses on measurement of carbon emissions from forest degradation.
Forest degradation is regarded as a major source of global greenhouse gas emission, i.e. 20 percent of emissions in the Brazilian Amazon (Asner et al., Citation2005) and 50 percent of the total emissions from forest change in Africa (Lambin et al., Citation2003). Besides greenhouse gas emission, forest degradation also has a negative impact on biodiversity, soil and water systems (Nepstad et al., Citation1999). Realising the importance of forest degradation, it is included in carbon financing mechanism namely reducing emission from deforestation and forest degradation (REDD) in the Conference of the Parties (COP 13) in United Nations Framework Convention on Climate Change (UNFCCC) (Huettner et al., Citation2009; Kanninen et al., Citation2007).
Forest degradation activities prevalent in developing countries include selective logging, forest fire, fuelwood collection and grazing, charcoal production and shifting cultivation (GOFC-GOLD, Citation2009). Most of the previous studies on measurement of forest degradation using remote sensing have focused on selective logging in humid tropical forests (Asner et al., Citation2005; Souza et al., Citation2005); very few studies have focused on dry forests as dry forests support less above ground biomass than humid ones (Murdiyarso et al., Citation2008; Skutsch et al., Citation2009). Since population density is mostly higher in dry forest areas, they are highly susceptible to forest degradation (Campbell et al., Citation2008), “dry forests are generally more heavily populated than rainforest (Murdiyarso et al., Citation2008)”. However, quantification of emission from dry forests is lacking (Fearnside & Laurance, Citation2003; Frederic et al., Citation2002).
Miombo woodlands form a continuous coverage in eastern, central and southern Africa; often dominated by trees of Brachystegia, Julbernadia and Isoberlinia genera of the family Leguminosae and subfamily Caesalpinioideae (Campbell et al., Citation1996; White, Citation1983). This forest type has global importance as it is a reservoir of carbon in large coverage and supports high floral and faunal diversity which is a source of living for millions of people (Dewees et al., Citation2010; Frost et al., Citation2003; Campbell et al., Citation2002). Forests cover about 340,000 km2 area in Tanzania, where two-thirds is Miombo woodland (Fyhrquist et al., Citation2002; MNRT, Citation1998). These woodlands are severely affected by tree cutting (farming and energy fuel), forest fire and grazing (Campbell et al., Citation2008; Chidumayo & Mbata, Citation2002). High poverty and unsustainable resource use further deteriorate woodland ecosystem (Geist, Citation1999; Luoga et al., Citation2002). Fuelwood collection, charcoal making and tobacco curing are greater threats to Miombo woodlands than timber harvesting (Margaret Skutsch, Citation2008; Skutsch & Libasse, Citation2010). Measurement of changes in forest land (activity data) and carbon stocks (emissions factors) is a fundamental part of the REDD+ mechanism. While the REDD+ mechanism under UNFCCC is not fully developed; historical data on forest degradation is a crucial part to estimate the reference emissions level and access future carbon crediting (Herold & Romijn, Citation2010).
The emission level from forest degradation is lower than deforestation. However, cumulative effect can be significant (Murdiyarso et al., Citation2008). Therefore, it is essential to quantify emission from forest degradation. With the development of remote sensing technologies, it is possible to improve accuracy and reduce costs for estimating carbon emission from deforestation. Deforestation is recognizable in satellite images, but removal of trees through forest degradation such as selective logging, forest fires, branch cutting and grazing is difficult to assess through remote sensing techniques as it does not necessarily create canopy gaps (Defries et al., Citation2007; GOFC-GOLD, Citation2009; Murdiyarso et al., Citation2008). Advanced technologies like Synthetic Aperture Radar (SAR), laser remote sensors (LiDAR) can only be used to detect minor forest changes (Achard et al., Citation2008; Gibbs et al., Citation2007; Goetz et al., Citation2009) but these methods are costly often higher than the cost of deforestation (Köhl et al., Citation2020). Furthermore, historical LiDAR data is not available for the tropics and the use of SAR for bio mass estimation is limited to a few areas in Africa (Mitchard et al., Citation2009). These advanced technologies therefore have limited use in establishment of historical baselines for forest degradation in the tropics. For this reason, this study proposes indirect approach to quantify forest degradation.
Potentially, forest degradation can be assessed by the use of proxy variables such as distance to settlements, urban centres and roads (Asner et al., Citation2005; Lambin et al., Citation2003; Mollicone et al., Citation2007; Souza et al., Citation2005). It is necessary to identify causes of degradation and measure associated activities separately (Iskandar et al., Citation2006). In this context, spatial models suggesting relationship of forest degradation with distance to settlements, road and forest edge can be an important instrument to predict the level of forest degradation. When degradation data is missing, proxy variables can be detected with high accuracy using free and easily accessible Landsat satellite imagery. Therefore, proxy variables can be derived globally, historically and at low cost (Dons et al., Citation2016). This methodology can help developing countries like Tanzania to establish and maintain national level forest degradation data. High correlation has been found between proxy variables and degradation in moist tropical forests (Mollicone et al., Citation2007). Since, little is known about the patterns of forest degradation in Miombo woodlands, this study attempts to fulfil this knowledge gap by assessing spatial relationships of forest degradation activities with settlements, roads and forest edge in Southern Tanzanian Miombo woodland. This study focused on above ground biomass removed. Although grazing has a large effect on woody biomass in the long run, this study did not cover forest degradation caused by grazing and forest fires as these activities are not associated with immediate removal of woody biomass. Understanding spatial relationship will help infer forest degradation patterns in other Miombo woodlands as well.
2. Materials and methods
2.1. Study area
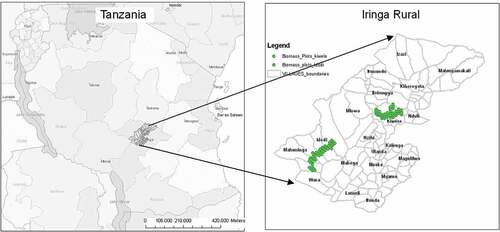
Field work was conducted in the two largest unfragmented forest areas in Iringa rural district. This district belongs to Iringa region which is located in southern Tanzania with Iringa town as regional administrative capital. It is situated between 7.00° to 8.30° S latitudes and 34° to 37° E longitudes. Altitude ranges from 500 m to 1200 m msl with annual rainfall of 500–600 mm and mean annual temperature varies between 20°C and 25°C (The United Republic of Tanzania, Citation2013). Soil quality is poor and the Miombo woodland is the major vegetation type present in the area.
The study selected two areas (area 1 and area 2). Area 1 is located in the south western part of the district and is 100–150 km far from Iringa town, and area 2 is located in the central part of the district about 45 km north west of Iringa town (Figure ). Both areas are accessible all year through a dirt road. A majority of the population in the study area depends on subsistence agriculture for their livelihoods. Village Forest (VF),Footnote1 Community Based Forest Management (CBFM),Footnote2 Joint Forest Management (JFM)Footnote3 and Open Forest (OF)Footnote4 are major forest regimes found in the area.
A land use map classified from a Landsat TM scene dated 6 December 2009 was used to select the study area. Major roads and settlements were manually digitized using Ordnance Survey topographic maps (Series Y742; 1:50,000) of 1982. A preliminary study was carried out in the study area to identify plots before the actual field work. It involved field observation and discussion with the local people about forest resource usage, location of forest and forestry issues.
Figure 1. Map of the study area (green dots in the second figure show sample plots).
2.2. Field data collection
A total of 26 transects were laid out, 13 transects with 4 km length in each area. These transects were systematically placed at an equal distance of 2.174 km. Three plots (circular plot with 15 m radius) were inventoried in each transect at distances of 500, 2000 and 3500 m from forest and non-forest border. The first plot in each transect was established 500 m from the forest border to reduce edge effect. Some areas were inaccessible due do to gullies an sloppy areas and the number of sample plots was therefore reduced to 67 and transects to 25 with a total length of 25*4 = 100 km.
The diameter and height of stumps were measured. Species and reasons for tree removal were identified with the support of local guides. The diameter of the trees was measured at 20 cm above ground. For stumps shorter than 20 cm, the diameter was measured at the height of the cut. Species were further identified with the help of an experienced local taxonomist and verified referring to local publications and reports. Bark characteristics, coppice, wood features were considered while identifying species. To identify purpose of tree removal; size of the stump, availability of charcoal kilns, tree species, height of stumps, presence of wood residue, sawing pit, presence of fire signs and closeness to villages were taken into consideration. The age of stumps was estimated to establish the historic trend of species removal. Physical appearance of the stump such as bark colour, occurrence of sprouts/coppice and condition of exposed wood were taken into consideration when deciding the age of the stumps. Stumps were categorized into two groups: stumps with fresh cut (<1 year) and old cut (> 1 year).
The diameter at breast height (DBH) and total height were measured for three randomly selected sample trees in each plot to estimate DBH—height relationship. A relascope was used to estimate basal area.
Focus group interviews in each village were organized before starting field inventory, the objective of which was to obtain a list of degradation activities in order to plan the field biomass survey. Discussions also focused on the historical view of forest management, use of forest resources (type of species, time of collection, amount collected) and location of forest resource collection. Forest stakeholders such as charcoal makers, fuelwood collectors, committee members and pastoralist (Masai) were involved in discussions. In areas where group discussions could not be performed, interviews with key informants were taken. Different participatory tools such as trend analysis, resource mapping and species ranking were applied to collect the information needed.
2.3. Data analysis
2.3.1. Estimation of wood harvesting
This study investigated above ground biomass (AGB) only. To determine biomass, four allometric models developed in tropical forest were collected from existing literature. Among these equations, three local (East African Miombo) and one non-local (tropical forest) were selected and compared with each other (Table ). Based on the comparison, local models were preferred over non local models because non local models were developed using data from outside Africa. Among these local models, the model developed by Chamshama et al. (Citation2004) was chosen to estimate AGB as it was based on largest sample size. The volume was calculated using equation suggested by Abbot et al. (Citation1997).
Table 1. Allometric equations used for AGB and volume
where, B = biomass (kg per tree), BA = basal area (m2), V = volume (m3 per tree), DBH = diameter at breast height (cm) and H = height (m)
As only stump diameter was measured in the field, stump diameter was converted into DBH using the following equation# derived from secondary data collected in area 2. These secondary data were collected from 25 circular plots of 15 m radius which were established in a grid with a distance of 0.5 km. In total, 300 trees were measured each at 5, 15 and 130 cm diameter and the height of every fifth tree was recorded.
#DBH = [{1.865–0.476* log(d)—1.4*log(1.3—h) + 0.012*d}^(1/3)]*d with RMSE = 0.222 and R2 = 0.048.
where, DBH = diameter at breast height (cm), d = stump diameter (cm) and h = stump height (m)
2.3.2. Spatial analysis
The data analysis was performed in two steps. First logistic regression was performed taking occurrence of major degrading activities such as charcoal, fuelwood and poles as dependent variables and distance parameters as independent variable (Table ). For those activities, plots with tree cutting were given 1 and 0 if there were no tree cutting. For activities that were significantly influenced by the distance parameters, simple linear regression was performed with plots with only degradation. Transformation (natural logarithm) was performed to obtain better fit of the data. Insignificant variables were removed using step wise reduction procedure.
The model which showed best scatter plot and normality curve; low RMSE and high adjusted r2 was selected. Analysis was based on plot level data and comparison was made between area 1 and 2. Student’s t test and F-statistics (ANOVA) were used to test for significance between two study areas. Validation of the models was performed via distribution of standardized residual plots, Pearson’s chi-square test and odd ratio test.
2.3.2.1. Distance parameters
Distance to road: Distance from plots to major road was calculated using the NEAR analysis in ArcGIS. Major roads were dirt roads which was the only connection option between the study areas and Iringa town all year around. Only major roads were selected for the study. Though small and minor roads have considerable importance, these were not included during analysis as reliable source for road network did not exist. The only source of small and minor roads was outdated topographic maps from 1982.
2.3.2.2. Distance to settlements
Settlements were digitized from Quickbird imagery dated 2003 displayed in Google Earth. The Quickbird 2003 images are considered the most recent high resolution data available. Settlements were digitized as polygons, exported to ArcGIS and crosschecked with available topographic maps. As the study is small in scale and population data is available only in the large scale, this study uses settlements instead of population. A cluster of more than 10 households were considered as one settlement. Distance from each plot to the nearest centre of settlement was estimated in ArcGIS using the NEAR analysis tool.
2.3.2.3. Distance to forest edge
A land use map based on a supervised classification of a Landsat TM scene dated 6 December 2009 was performed with ENVI 4.7. All land use classes were reclassified into forest and non-forests, exported into ArcGIS and converted into polygons. Non-forest polygons smaller than 0.5 km were considered as forest gaps and removed from the non-forest layer. The NEAR analysis tool was used to estimate the distance from plots to non-forest polygons larger than 0.5 km. Non-forest polygons larger than 0.5 km are referred to as forest edge throughout the paper.
2.3.3. Logistic regression
Logistic regression is used to identify parameters when response variable is binary and explanatory variable is continuous or categorical. Logistic regression calculates coefficients for the explanatory variables which are interpreted as weights in algorithm. This gives probability for the data. Logistic regression has been used in predicting forest fire (Vega et al., Citation1995), deforestation (Ludeke et al., Citation1990) and land use change (Serneels & Lambin, Citation2001). Logistic regression basically estimates intensity of explanatory variables and predicts the probability of response variable. For example, if p denotes probability (Y denotes success or failures), the linear logistic model will be
The logistic model for p is function of X
where α is the intercept, β1-3 are slope parameters and X1-3 are explanatory variables.
Graphical representation (scatter plots showing observed vs. fitted values), and Pearson’s chi-square test were used to validate output from the model.
2.3.4. Linear regression
The choice of statistical method is largely governed by the type of research design. The objective of this study is to establish spatial patterns of forest degradation using distance parameters. The relationship can be the number of trees removed per ha with distance parameters. For this, simple and mixed linear models were used.
where Yi is the ith observation of the dependent variable, i.e. stumps number per ha, basal area per ha, basal area lost per ha or average diameter; X1-3 are independent variables (distance to road, settlement and forest edge) and εi are errors of the model. The model which showed well distributed scattered plot was selected. First model was run with one dependent variable and all independent variables. Independent variables which were not significant were gradually removed from the model. The model showing the best fit of the data (best scatter plot for observed vs. fitted values), low RMSE and high adjusted R squared values was selected.
3. Results
3.1. Trees cutting
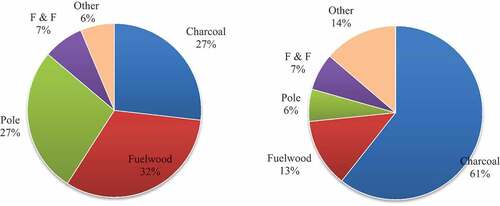
The majority of plots (67%) evidenced forest degradation. Trees were removed for collection of fuelwood and poles followed by chopping down trees for charcoal production, removing trees for farming and fences (F&F) and other purposes, e.g. making rope, wood carving, honey production, medicinal plants/parts collection etc.
Number of stumps found per ha was highest for fuelwood followed by poles, charcoal, F&F and other purposes (Figure ). However, the AGB extracted for charcoal was higher than for fuelwood and poles (Figure ). Charcoal production was common in area 2 and the number of stumps found per ha differed significantly with area 1 (t = −2.070, p = 0.046) but differences in AGB removed were not found significant (t = −1.374, p = 0.1758) between two areas. Fuelwood was used for both subsistence and commercial purposes. Subsistence use of fuelwood was practiced in both areas but commercialization was more frequent in area 2. The fuelwood consumption was also not statistically different between two areas (p > 0.05). Subsistence use of poles was common in both areas and biomass removed was significantly different in the two areas (t = 2.651, p = 0.012). Very few stumps (less than 1% of total stumps) removed for timbers were found in the study area.
Figure 2. Overall share of tree cuttings for different purposes: (a) Number of stumps per ha (left) and (b) biomass (ton ha−1) (right).
The mean stump diameter (SD) for area 1 and 2 were 9.131 ± 0.501 cm and 14.403 ± 0.647 cm respectively. The mean SD variation is higher in area 2 and is statistically significant with area 1 (t = −3.185, p = 0.004). Trees with the highest SD (64 cm) encountered was removed for charcoal in area 2. A majority of the stumps (76%) found had less than 15 cm SD.
Tree removals represented a mean biomass ± standard error of 6.264 ± 1.567 tons per ha from old cut which was higher than 0.544 ± 0.224 tons per ha from fresh cuts in both areas. The assessment showed that there was decrease in the tree cuttings as the number of fresh cuts was small compared to old cuts in both areas (Figure ). The total basal area, volume and biomass also decreased among fresh cuts as compared to old cuts and all these values were significantly different between two areas (Table ).
Figure 3. Representation of BA (m2ha−1), volume (m3ha−1) and biomass (ton ha−1) for fresh and old cuts in both areas.
Table 2. Independent and dependent variable used for the analysis
Table 3. Comparison of mean ± standard error no ha−1, BA ha−1 and volume ha−1 in two areas
Biomass was estimated using four equations which showed little variation. There was no significant difference in calculated biomass (Table ). The equation suggested by Chamshama et al. (Citation2004) was selected and 6.927 ± 1.591 ton ha−1 average biomass was calculated for the study area.
Table 4. Mean biomass estimated from four different allometric equations
3.2. Spatial analysis
3.2.1. Spatial modelling of tree removal
Since the level of tree harvesting can differ significantly between area 1 and 2, the spatial analysis was performed for both areas separately and in combination. The average distances from plots to settlement, road and forest edge were 3.7 km, 4.8 km and 1.3 km respectively.
The count of plots with tree removal revealed that the majority of plots showed some evidence of forest degradation. Apart from tree cuttings, some plots showed signs of other human disturbance such as fire and grazing. These degradation activities were, however, outside the scope of this study.
From field observation, it was found that plots located in inaccessible areas (sloppy, stony and bushy) did not have any stumps. No trees were cut in such plots, because the area either did not have suitable species for fuelwood, charcoal, poles or any other purposes or were located in difficult areas. The logistic regression model performed with major degradation activities included showed that the probability of forest degradation was significantly affected by the distance to settlement (p = 0.033) and forest edge (p = 0.011). However distance to road did not show any relationship with degradation (p = 0.363) (Table ). The significance of forest degradation with respect to distance to settlements and forest edge allowed further analysis and simple linear regression was performed in plots having degradation.
Figure 4. Number of stumps per ha plotted against distance to forest edge (m).
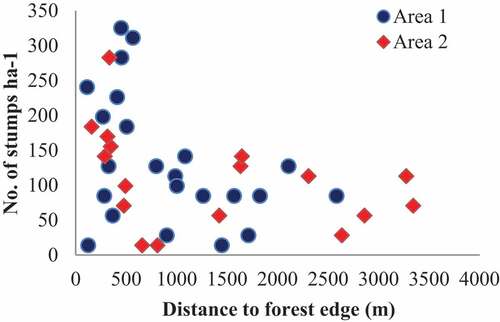
Table 5. Logistic regression of forest degradation (presence or absence) with distance parameters in meters (df = 57)
Relationship of number of stumps with distance to forest edge showed inverse function with higher tree cuttings nearby forest edges and 70% of the cuttings were found within 1.5 km from forest edge (Figure ).
No significant relationship was found between tree harvesting (stumps per hectare) with distance to major roads when the two areas are combined, but was significant in area 1 alone (Table ). Similarly, tree cutting was inversely proportional to settlement distance in both areas and area 1 (Table ).
Table 6. Relationship of stump cutting (number per ha) with distance parameters in meters
The effect of BA removed with distance parameters in area 1, area 2 showed mixed results. It was significantly affected by the distance to settlements in area 2 only. Both areas combined and area 1 were not affected (Table ). Effects of distance to road and forest edge did not show any relationship with BA in both areas and area 2 alone. Intensity of trees removals in terms of BA was found to be confined within 10 km from settlement (Figure ). Distance to settlement had a stronger effect on the basal area removed than other variables in both areas (Table ).
Figure 5. Basal area ha−1 plotted against distance to settlement (m).
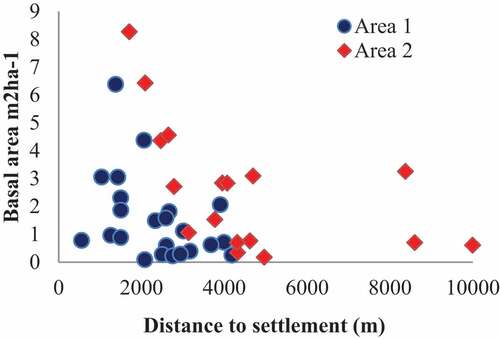
Figure 6. Percentage basal area removed plotted against distance to settlement (m).
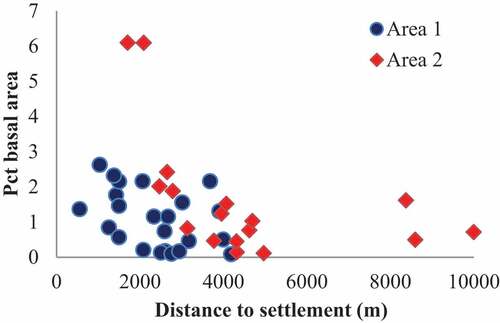
Table 7. Relationship of tree cuttings (basal area m2 per ha) with distance parameters (m)
It was found that percentage of total BA lost was significant with distance to settlements in both areas. Very few trees were removed within 1 km of settlements and majority of cuttings were centred up to 4 km from settlements (Figure ). Distance to road and forest edge showed no significant effect on the percentage BA lost in both areas and area 2 (Table ). Percentage basal area removed was significant with all three distance parameters in area 1.
Table 8. Percentage basal area removed per hectare regressed against distance parameters (m)
Logistic regression was performed with major forest products i.e. charcoal, fuelwood and poles. Stumps removed for charcoal was found up to 14 km, 9 km and 3.5 km from road, settlements and forest edge. The probability of trees removed for charcoal was affected by distance to road only (p = 0.0346) (Table and Figure ).
Figure 7. Availability of stumps removed for charcoal with respect to the distance from settlements in both areas.
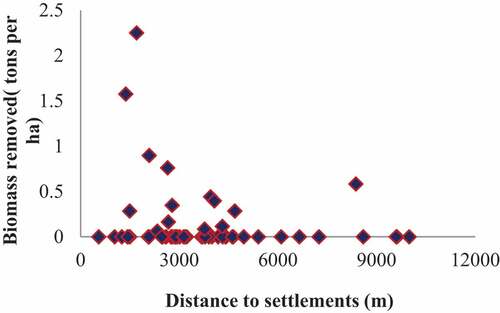
Table 9. Relationship of charcoal presence with respect to distance parameters (df = 57)
Fuelwood collection was practiced for subsistence and commercial purposes. Subsistence consumption was confined near the settlements and commercial collection was practiced far from settlements (Figure ).The probability of stumps removed for fuelwood decreased significantly with increasing distance to settlements and forest edge (Table ). Distance to road did not influence fuelwood collection significantly.
Table 10. Relationship of tree cutting for fuelwood with respect to the distance factors (df = 57)
Tree cutting for poles were used for both subsistence and commercial uses, but subsistence was more common in both areas. Poles can be small and large in size based upon its uses and species. Species which can give straight and hard wood were selected for poles. Tree cutting for poles was significantly affected by the distance to settlements but did not show any pattern with two other distance parameters (Table and Figure ).
Figure 8. Distribution of biomass removed (tons ha−1) for fuelwood and pole distance from settlements in both areas.
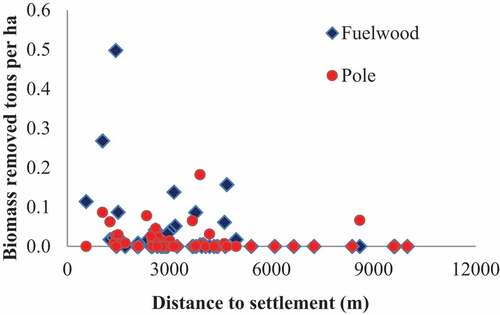
Table 11. Relationship of tree cutting for poles with distance parameters (df = 57)
4. Discussion
4.1. Forest degrading activities and their impacts
Forest degrading activities found in study areas were charcoal production, fuelwood collection, pole extraction, honey collection, timber extraction, rope making, carving etc., and are similar with the finding of Luoga et al. (Citation2002). The volume of wood extracted, i.e. 13.536 ± 3.477 m3ha−1 was lower than the volume mentioned by Luoga et al. (Citation2002), which was 19.6 m3ha−1 in public lands in Miombo woodland in eastern Tanzania. The large volume might be due to large commercial activities in their study area. The impact of forest degradation was analysed in terms of number of stumps found per ha, basal area lost per ha, volume of wood removed per ha and above ground biomass lost per ha. Because of research priorities and limitations, allometric equations from published literatures were used.
Trees removed for charcoal, fuelwood and poles dominated cuttings in the study area (Luoga, Citation2000; Nsolomo & Chamshama, Citation1990), trees removal for charcoal was more common in area 2 and was practiced in VF, CBFM and forest reserve. There were large numbers of illegal charcoal making activities found in area 2. The charcoal production caused removal of nearly all trees surrounding the kiln (Luoga et al., Citation2002).
Majority of the people living in study area prepare their food using fuelwood which is one of the higher wood products consumed in the area. Fuelwood collection is very common in nearby settlements. Subsistence consumption of fuelwood was found up to 4 km distance from the forest settlements whereas commercial utilization can go beyond 5 km. According to the study done in Kenya, areas with more than 5 km radius had no trees because of fuelwood collection (Kirubi et al., Citation2000). High tree removals were found for fuelwood collection nearby the permanent settlements in Chiapas, Mexico (Ochoa-gaona & Gonza, Citation2000).
Unlike fuelwood, poles and charcoal; few trees species were found suitable and preferred for timber. These species disappeared from vicinity of human settlements due to their overharvesting and lack of protection.
4.1.1. Spatial pattern of forest degradation
Distance to settlements is found to be good variable for predicting tree cutting pattern and showed inverse relationship. Intensity of tree cutting is decreased with the increase in the distance from the settlements. This finding is supported by studies done in Miombo woodland in Zimbabwe (Grundy et al., Citation1993; Vermeulen, Citation1996) and savanna in South Africa (Shackleton et al., Citation1994). But Luoga et al. (Citation2002) presented that wood cutting did not show any inverse relationship with settlements and explained that commercial charcoal production was dominant wood products which might affect whole result.
Tree cutting was described as an inverse function of distance to the forest edge with large tree cuttings nearby the forest edge. Similar relationship between distance to forest edge and deforestation was found in Cameroon (Mertens & Lambin, Citation1997).
Tree removal is significantly affected by road distance in area 1, but is not significant in area 2 and both areas combined. This may be because all transects in the area 1 are situated along the road but the road is located in the opposite direction from forest in area 2. In addition, all small roads and paths indicated in the topographic map were ignored as the map was old, and small roads may be changed in due course of time.
Biomass removed was decreased which is demonstrated by high biomass with older cuttings as compared to fresh ones. This might be the result of decrease in wood stocking that may lead to travel further distance to collect forest resources.
Occurrence of stumps removed for charcoal was significantly affected by the distance to road. From field observation and interviews, it was found that geography of the area (slope, soil, presence of stones and availability of drinking water) and preferred species are decisive factors for location of charcoal production. Hidden infrastructure such as minor dirt roads makes distance to the chosen proxy variables less important. Charcoal production is common in area 2 and main legal charcoal kilns were located in clusters in area 2. But none of the plot sampled in this study coincided with clustered kiln sites in area 2. This might be the reason for the significance of stumps removed for charcoal with distance to road in the area 2. Luoga et al. (Luoga et al., Citation2002) also argued that charcoal does not follow any kind of pattern. Fuelwood and poles were used mainly for subsistence purpose and followed inverse relationship with distance to settlements. As most of wood cuttings (fuelwood and poles) were done for subsistence purposes, distance to settlement has stronger effect on the wood cuttings in both areas.
The length of the transect is taken 4 km from the forest border based on the assumption that local people might travel a maximum of 4 km on foot but people may travel beyond this distance. The combined effect of dependent variables was not significant but each variable was found significant when dealt separately in the model. This might be because dependent variables have correlation with each other and sample size is small for this study. Settlement is used as a predictor for location of local population centres. Actual population density per km2 would likely have been a more accurate proxy variable for prediction of forest degradation. However, local population data connected with settlements was not obtainable. Population data exists for larger areas such as the national census in 2002 and afripop.org, but this data is too coarse for the scale of this study. Distance to settlements was measured using the NEAR analysis and all settlements are given equal weights irrespective of their size and effect on the forest use. There is a need for methods to extract local population data in future degradation studies.
Since, this study focused on the measurement of stump diameter, DBH was estimated using allometric equation developed from secondary data which were gathered from area 2. Therefore, the estimated DBH may have some deviations from the true DBH. The overall results are based on small scale study; and may vary if the scale is increased. Grazing and pastoralists have big impacts on forests in these areas and further research is needed to analyse the impact of grazing in these areas.
5. Conclusion
The major forest degrading activities were—chopping down trees for fuelwood collection, poles extraction, charcoal production, farming and fencing, and other purposes. The number of stumps found was statistically insignificant in the case of charcoal and fuelwood. Average biomass removed was 6.927 ± 1.591 ton ha−1 from the study areas. The majority of stumps removed were below 15 cm diameter. Tree cutting in terms of number per hactare showed inverse relationship with distance to settlement and forest edge in both areas but did not show any pattern with road in the study area. However, tree cutting in area 1 alone was found to be significant with all the distance parameters. Percentage basal area removed was significant only with distance to settlements. Thus, distance to settlement is found as a better predictor for degradation in the study area. Logistic regression performed with major tree cutting purposes showed that probability of presence of charcoal was significantly affected by the distance to road. Trees removal for poles and fuelwood collection was significantly affected by the distance to settlements only.
The result of this study could be a useful reference to researchers and policy makers as they require regular monitoring of carbon dynamics across the country. As this method of assessing forest degradation activities using proxy variables are comparatively low cost and simple as compared to high cost remote sensing techniques, they can apply this method as a preliminary tool before detail analysis. Therefore, the assessment of forest degradation using these kind of low cost techniques are more important for the countries which have dry forest like Tanzania who wish to access carbon finance mechanism to address the climate change mitigation.
Disclaimer
The views and interpretations in this publication are those of the author’s and they are not necessarily attributable to their organizations.
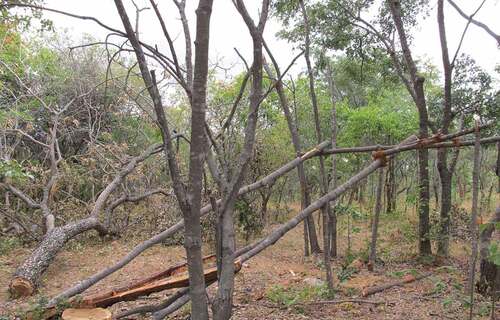
Cover image
Source: Author.
Acknowledgements
We would like to extend our gratitude to Professor Henrik Meilby, University of Copenhagen, Denmark, for his guidance in overall research design and input for the manuscript. We would also like to thank Professor Y. M. Ngaga and Mr. Steve Ngowi at Sokoine University of Agriculture (SUA), Morogoro, Tanzania, for their support in obtaining research permit, other technical support during data collection in Tanzania. We would like to thank Danish International Development Agency (DANIDA), and the Otican Foundation for the research grant. The author team would like to thank the anonymous reviewers for their comments and suggestion to enrich the technical content of the manuscript.
Additional information
Funding
Notes on contributors
Sushma Bhattarai
Ms. Sushma Bhattarai, an assistant professor of forests and livelihoods at Tribhuvan University, Institute of Forestry, holds more than a decade of forestry-related professional experiences in various agencies like UK Aid, Swiss Development Cooperation, United Nations Development Programme, and various non-governmental organizations. Her field of expertise is forest degradation assessment, forest and landscape restoration, Ecosystem-based Adaptation, and assessing mitigation measures to climate change impact.
Notes
1. VF is a managed by locally elected government body.
2. CBFM is a forest management system in which ownership, rights and access to forest resources is given to the local communities.
3. JFM is a forest management system where government owns the forest and local communities have user rights and access of forest resources.
4. OF is forest present on the area between settlement and CBFM/JFM.
References
- Abbot, P., Lowore, J., & Werren, M. (1997). Models for the estimation of single tree volume in four miombo woodland types. Forest Ecology and Management, 97(1), 25–21. https://doi.org/10.1016/S0378-1127(97)00036-4
- Achard, F., Grassi, G., Herold, M., Teobaldelli, M., & Mollicone, D. (2008). Use of satellite remote sensing in LULUCF sector. Background paper at the IPCC expert meeting 13-15 May 2008. GOFC-GOLD report no. 33, Jena, Germany.
- Asner, G. P., Knapp, D. E., Broadbent, E. N., Oliveira, P. J. C., Keller, M., & Silva, J. N. (2005, October). Selective logging in the Brazilian Amazon. Science, 310(5747), 480–482. https://doi.org/10.1126/science.1118051
- Brown, S. (1997). Estimating Biomass and Biomass change of tropical forests : A primer. (FAO Forestry Paper-134). Rome.
- Campbell, A., Chenery, A., Coad, L., Kapos, V., Kershaw, F., Scharlemann, J. P. W., & Dickson, B. (2008). The linkages between biodiversity and climate change mitigation. Prepared by UNEP world conservation monitoring centre, Cambridge, UK, for the FIrst Meeting of the Second Ad Hoc Technical Expert Group on Biodiversity and Climate Change, Convention on Biolo”.
- Campbell, B., Frost, P., & Byron, N. (1996). Miombo woodlands and their use: Overview and key issues. In B. Campbell (Ed.), The miombo in transition: Woodlands and welfare in Africa.1-10. Center for International Forestry Research (CIFOR), Bogor, Indonesia.
- Campbell, B. M., Jeffrey, S., Kozanayi, W., Luckert, M., Mutamba, M., & Zindi, C. (2002). Household livelihoods in semi-arid regions: Options and constraints. CIFOR.
- Chamshama, S. A. O., Mugasha, A. G., & Zahabu, E. (2004). Stand biomass and volume estimation for Miombo Woodlands at Kitulangalo, Morogoro, Tanzania Stand Biomass and Volume Estimation for Miombo Woodlands at Kitulangalo, Morogoro, Tanzania. The Southern African Forestry Journal, 200(1), 1. https://doi.org/10.1080/20702620.2004.10431761
- Chidumayo, E. N., & Mbata, K. J. (2002, October). Shifting cultivation, Edible Caterpillars and Livelihoods in the Kopa Area of Northern Zambia. Forests, Trees and Livelihoods, 12(3), 175–193. https://doi.org/10.1080/14728028.2002.9752423
- Dean, A. (2019). Deforestation and Climate Change. https://www.climatecouncil.org.au/deforestation/
- Defries, R., Achard, F., Brown, S., Herold, M., Murdiyarso, D., Schlamadinger, B., & De Souza., C. (2007). Earth observations for estimating greenhouse gas emissions from deforestation in developing countries. Environmental Science & Policy, 10(4), 385–394. https://doi.org/10.1016/j.envsci.2007.01.010
- Dewees, P. A., Campbell, B. M., Katerere, Y., Sitoe, A., Cunningham, A. B., Angelsen, A., & Wunder, S. (2010). Managing the Miombo Woodlands of Southern Africa: Policies, incentives and options for the rural poor. Journal of Natural Resources Policy Research, 2(1), 57–73. https://doi.org/10.1080/19390450903350846
- Dons, K., Bhattarai, S., Meilby, H., Smith-Hall, C., & Panduro, T. E. (2016). Indirect approach for estimation of forest degradation in non-intact dry forest: modelling biomass loss with tweedie distributions. Carbon Balance and Management, 11(1), 14. https://doi.org/10.1186/s13021-016-0051-z
- FAO. (2010). The state of food and agriculture 2010-2011. Food and Agriculture Organization (FAO) of the United Nations.
- Fearnside, P. M., & Laurance, W. F. (2003, February). Comment on ‘determination of deforestation rates of the world´s Humid Tropical Forests’. Science, 299(5609), 1015a-1015. https://doi.org/10.1126/science.1078714
- Frederic, A., Eva, H. D., Stibig, H.-J., Mayaux, P., Gallego, J., Richards, T., & Malingreau, J.-P. (2002, January). Determination of deforestation rates of the world ’ s Humid Tropical Forests. Science, 297 999–2002. https://doi.org/10.1126/science.1070656
- Frost, P. G. H., Timberlake, J., & Chidumayo, E. (2003). Miombo-Mopane Woodlands and Grasslands. In R. Mittermeier, C. Goettsch, P. Mittermeier, P. Robles, G. Gil, T. Fonseca, J. Brooks, J. Pilgrim, & W. Konstant (Eds.), Wilderness: Earth’s Last wild places (pp. 183–204). University of Chicago Press.
- Fyhrquist, P., Mwasumbi, L., Hæggstrom, C., Vuorela, H., Hiltunen, R., & Vuorela, P. (2002). Ethnobotanical and antimicrobial investigation on some species of terminalia and combretum (Combretaceae) growing in Tanzania. Journal of Ethnopharmacology, 79(2), 169–177. https://doi.org/10.1016/S0378-8741(01)00375-0
- Geist, H. J. (1999). Global assessment of deforestation related to tobacco farming. Tobacco Control, 8(1), 18–28. https://doi.org/10.1136/tc.8.1.18
- Gibbs, H. K., Brown, S., Niles, J. O., & Foley, J. A. (2007). Monitoring and estimating tropical forest carbon stocks: Making REDD a reality. Environmental Research Letters, 2(4). https://doi.org/10.1088/1748-9326/2/4/045023
- Goetz, S. J., Baccini, A., Laporte, N. T., Johns, T., Walker, W., Kellndorfer, J., Houghton, R. A., & Sun, M. (2009). Mapping and monitoring carbon stocks with satellite observations: A comparison of methods. Carbon Balance and Management, 4(2), 1–7. https://doi.org/10.1186/1750-0680-4-2
- GOFC-GOLD. (2009). A sourcebook of methods and procedures for monitoring and reporting anthropogenic greenhouse gas emissions and removals associated with deforestation, gains and losses of carbon stocks in forests remaining forests, and forestation. alberta.
- Grundy, I. M., Campbell, B. M., Balebereho, S., Cunliffe, R., Tafangenyasha, C., Fergusson, R., & Parry, D. (1993). Availability and use of trees in mutanda resettlement area, Zimbabwe. Forest Ecology and Management, 56(1–4), 243–266. https://doi.org/10.1016/0378-1127(93)90116-5
- Herold, M., & Romijn, J. E. (2010). Monitoring activities of deforestation and forest degradation in REDD+ Project Sites: Recommendations for the Use of Remote Sensing on Measurement of Forest Cover Change. Progress Report. Center for International Forestry Research (CIFOR). Bogor, Indonesia.
- Huettner, M., Leemans, R., Kok, K., & Ebeling, J. (2009). A Comparison of Baseline Methodologies for ’ Reducing Emissions from Deforestation and Degradation ’. Carbon Balance and Management, 4(1), 1–12. https://doi.org/10.1186/1750-0680-4-4
- Iskandar, H., Snook, L. K., Toma, T., Macdicken, K. G., & Kanninen, M. (2006, May). A Comparison of Damage Due to Logging under Different Forms of Resource Access in East Kalimantan, Indonesia. Forest Ecology and Management, 237(1–3), 83–93. https://doi.org/10.1016/j.foreco.2006.09.079
- Kanninen, M., Murdiyarso, D., Seymour, F., Angelsen, F., Wunder, S., German, L., Angelsen, A., Wunder, S., & German, L. (2007). Do Trees Grow on Money? The Implications of Deforestation Research for Policies to Promote REDD. Centre for International Forestry Research (CIFOR). https://doi.org/10.17528/cifor/002347
- Kirubi, C., Wamicha, W. N., & Laichena, J. K. (2000). The Effects of Woodfuel Consumption in the ASAL Areas of Kenya: The Case of Marsabit Forest. African Journal of Ecology, 38(1), 47–52. https://doi.org/10.1046/j.1365-2028.2000.00208.x
- Köhl, M., Neupane, P. R., & Mundhenk, P. (2020, February). REDD+ Measurement, Reporting and Verification – A Cost Trap? Implications for Financing REDD+MRV Costs by Result-Based Payments. Ecological Economics, 168, 1-13. https://doi.org/10.1016/J.ECOLECON.2019.106513
- Lambin, E. F., Geist, H. J., & Lepers, E. (2003). Dynamics of Land-Use and Land-Cover Change in Tropical Regions. Annual Review of Environmental Resources, 28(1), 205–241. https://doi.org/10.1146/annurev.energy.28.050302.105459
- Ludeke, A. K., Maggio, R. C., & Reid, L. M. (1990). An Analysis of Anthropogenic Deforestation Using Logistic Regression and GIS. Journal of Environmental Management, 31(3), 247–259. https://doi.org/10.1016/S0301–4797(05)80038-6
- Luoga, E. J. 2000. The Effects of Human Disturbances on Diversity and Dynamics of Eastern Tanzania Miombo Arborescent Species: A Thesis Submitted to the Faculty of Science, University of the Witwaterrand, Johannesburg in Fulfilment of the Requirements for the Degree of Doc. University of the Witwatersrand. https://books.google.com.np/books?id=76oxMwEACAAJ.
- Luoga, E. J., Witkowski, E. T. F., & Balkwill, K. (2002). Harvested and Standing Wood Stocks in Protected and Communal Miombo Woodlands of Eastern Tanzania. Forest Ecology and Management, 164(1–3), 15–30. https://doi.org/10.1016/S0378-1127(01)00604-1
- Malimbwi, R. E., Solberg, B., & Luoga, E. (1994). Estimation of Biomass and Volume in Miombo Woodland at Kitulangalo Forest Reserve, Tanzania. Journal of Tropical Forest Science, 7, 2.
- Mertens, B., & Lambin, E. F. (1997). Spatial Modelling of Deforestation in Southern Cameroon of Diverse Deforestation. Applied Geography, 17(2), 143–162. https://doi.org/10.1016/S0143-6228(97)00032-5
- Mitchard, E. T. A., Saatchi, S. S., Woodhouse, I. H., Nangendo, G., Ribeiro, N. S., Williams, M., Ryan, C. M., Lewis, S. L., Feldpausch, T. R., & Meir, P. (2009). Using Satellite Radar Backscatter to Predict Above-Ground Woody Biomass: A Consistent Relationship across Four Different African Landscapes. Geophysical Research Letters, 36(23), 1–6. https://doi.org/10.1029/2009GL040692
- MNRT. (1998). The National Forest Policy. Ministry of Natural Resources and Tourism.
- Mollicone, D., Achard, F., Federici, S., Eva, H. D., Grassi, G., Belward, A., Raes, F., Seufert, G., Stibig, H.-J., Matteucci, G., & Schulze, E.-D. (2007). An Incentive Mechanism for Reducing Emissions from Conversion of Intact and Non-Intact Forests. Climate Change, 83(4), 477–493. https://doi.org/10.1007/s10584-006-9231-2
- Murdiyarso, D., Skutsch, M., Guariguata, M., Kanninen, M., Luttrell, C., Verweij, P., & Stella, O. (2008). Measuring and Monitoring Forest Degradation for REDD Implications of Country Circumstances. CIFOR.
- Nepstad, D. C., Verissimo, A., Alencar, A., Nobre, C., Lima, E., Lefebvre, P., Schlesinger, P., Potter, C., Moutinho, P., Mendoza, E., Cochrane, M., & Brooks, V. (1999). Large-Scale Impoverishment of Amazonian Forests by Logging and Fire. Nature, 398(6727), 505–508. https://doi.org/10.1038/19066
- Nsolomo, R. V., & Chamshama, S. (1990). Human Impacts on Some Catchments Forest Reserves in Morogoro Region. In Proceedings of the Sokoine University of Agriculture! African Union for Nature (SUAIA UN) Seminar, The Management of Natural Forests in Tanzania, edited by R. V. Nsolomo & S. A. O. Chamshama. Faculty of Forestry SUA Record no 43, 39–45. Sokoine University of Agriculture, Morogoro, Tanzania.
- Ochoa-gaona, S., & Gonza, M. (2000). Land Use and Deforestation in the Highlands of Chiapas, Mexico. Applied Geography, 20(1), 17–42. https://doi.org/10.1016/S0143-6228(99)00017-X
- Pearson, T. R. H., Brown, S., Murray, L., & Sidman, G. (2017). Greenhouse Gas Emissions from Tropical Forest Degradation: An Underestimated Source. Carbon Balance and Management, 12(1), 1. https://doi.org/10.1186/s13021-017-0072-2
- Penman, J., Gytarsky, M., Hiraishi, T., Krug, T., Kruger, D., Pipatti, R., Buendia, L., Miwa, K., Ngara, T., Tanabe, K., Wagner, F. (2003). Good Practice Guidance for Land Use, Land-Use Change and Forestry. Institute for Global Environmental Strategies (IGES) for the IPCC.
- Serneels, S., & Lambin, E. F. (2001). Proximate Causes of Land-Use Change in Narok District, Kenya: A Spatial Statistical Model. Agriculture, Ecosystems & Environment, 85(1–3), 65–81. https://doi.org/10.1016/S0167-8809(01)00188-8
- Shackleton, C. M., Griffin, N. J., Banks, D. I., Mavrandonis, J. M., & Shackleton, S. E. (1994). Community Structure and Species Composition along a Disturbance Gradient in a Communally Managed South African Savanna. Vegetation, 115, 157–167.
- Skutsch, M. (2008). Operationalising Reduced Degradation within REDD. (K:TGAL Policy Paper; No. 2). Enschede: Center for Clean Technology and Environmental Policy. http://www.communitycarbonforestry.org.
- Skutsch, M., Van Laake, P., Zahabu, E., Karky, B., & Phartiyal, P. (2009). Community Monitoring in REDD+. Realising REDD+: National Strategy and Policy Options. In Angelsen, A., Brockhaus, M., Kanninen, M., Sills, E., Sunderlin, W. D., & Wertz-Kanounnikoff, S. (Eds), 2009 Realising REDD+: National strategy and policy options. CIFOR, Bogor, Indonesia.
- Skutsch, M. M., & Libasse, B. (2010). Crediting Carbon in Dry Forests: The Potential for Community Forest Management in West Africa. Forest Policy and Economics, 12(4), 264–270. https://doi.org/10.1016/j.forpol.2009.12.003
- Souza, C. M., Roberts, D. A., & Cochrane, M. A. (2005). Combining Spectral and Spatial Information to Map Canopy Damage from Selective Logging and Forest Fires. Remote Sensing of Environment, 98(2–3), 329–343. https://doi.org/10.1016/j.rse.2005.07.013
- The United Republic of Tanzania. (2013). Iringa Region Socio-Economic Profile, 2013. National Bureau of Statistics. Dar es Salaam.
- Vega, G. C., Woodard, P. M., Titus, S. J., Adamowicz, W. L., & Lee, B. S. (1995). A Logit Model for Predicting the Daily Occurrence of Human Caused Forest Fires. International Journal of Wildland Fire, 5, 2. https://doi.org/10.1071/WF9950101
- Vermeulen, S. J. (1996). Cutting of Trees by Local Residents in a Communal Area and an Adjacent State Forest in Zimbabwe. Forest Ecology and Management, 81(1–3), 101–111. https://doi.org/10.1016/0378-1127(95)03656-3
- White, F. (1983). The Vegetation of Africa. United Nations.
- WRI. (2018). By the Numbers: The Value of Tropical Forests in the Climate Change Equation. Blog, October 04, 2018. World Resources Institute. https://www.wri.org/blog/2018/10/numbers-value-tropical-forests-climate-change-equation