
 ?Mathematical formulae have been encoded as MathML and are displayed in this HTML version using MathJax in order to improve their display. Uncheck the box to turn MathJax off. This feature requires Javascript. Click on a formula to zoom.
Abstract
Understanding the extent and direction of land use/cover change (LULCC) is essential for planning sustainable land management options. Thus, this study examined the trends of LULCC in Northwestern Ethiopia. Panchromatic Aerial photographs of the years 1957 and 1984 QuickBird image (2006) and SPOT image (2016) were used to analyze the dynamics of LULCC. The land use/cover classes were classified using onscreen digitizing method. Six land use/cover types, namely, forest, bush, grazing, cultivated and settlement, degraded and khat plantation, were identified. The result showed that there have been substantial land use/cover change in the last 59 years in Kecha-Laguna micro watersheds. In Kecha micro watershed, cultivated land and settlement areas, degraded land and Khat plantation increased by 31.7%, 6.3% and 3.11%, respectively, at the expense of other land uses/cover types such as forest, bush and grazing land, which declined by 6.86%, 23.5% and 10.8%, respectively. In Laguna micro watershed, cultivated and settlement land, khat plantation and degraded land increased by 12.5%, 3.1% and 14.5%, respectively. While; forest, bush and grazing land declined by 18%, 9.4% and 2.6%, respectively, in the last 59 years. In association with recent watershed development efforts encompassing area enclosures and soil and water conservation practices in the Kecha micro watershed, degraded land reduced by 3.7% while forest land increased by 3.4% between 2006 and 2016. Therefore, proper land management is a key to reduce land degradation and improve forest cover.
PUBLIC INTEREST STATEMENT
Land use/cover change is a major challenge in Ethiopia. In kecha-laguna micro watershed, cultivated and settlement land, degraded land and Khat plantation have increased. While forest, bush and grazing land which showed a declined trend from 1957 to 2016. However, due to the implementation of area closure and SWC practices forest land showed slight increment and degraded land showed slight decrement in kecha micro watershed from 2006 to 2016. Therefore, analyzing LULCC provided insights into the effects of area closure and SWC measures.
Competing Interests
The authors declare no competing interests.
1. Introduction
Land is one of the major natural resources that economic, social, and other human activities are carried out on. Thus, changes in land use/cover (LULC) have occurred at all times in the past, are presently continuing, and are likely to continue in the future (Elias et al., Citation2019; Lambin et al., Citation2003). The major LULCC in Ethiopia occurred in densely populated areas, mainly in the highlands from 1966 to 2015 (Assen & Nigussie, Citation2009; Demissie et al., Citation2017; Fisseha et al., Citation2011; Sewnet, Citation2015). As a result of population growth, large forest areas were destroyed and converted into agricultural land in response to the ever-increasing demand for food, grazing land and wood (Assen & Nigussie, Citation2009; Demissie et al., Citation2017; Gashaw et al., Citation2017). However, some studies stated that the deforestation trend has recently been reduced and vegetation cover has improved in some parts of the country because of plantation activities on degraded hillsides and area closure activities (Alemayehu et al., Citation2009; Bantider et al., Citation2011; Lemenih & Kassa, Citation2014; Wondie & Mekuria, Citation2018).
Land use/cover change dynamics cannot be uniform in all parts of the world because of different driving factors. Although there are no agreements on factors which cause land cover/use changes, some studies suggested that demographic dynamics contribute more than any other process to land cover changes (Hurni, Citation1993; Mather & Needle, Citation2000; Meshesha et al., Citation2014) while others suggested the superiority of economic factors (Deribew & Dalacho, Citation2019; Haregeweyn et al., Citation2015). Some others stated that scarcity of land is the cause for land use/cover change. Because people plough hillsides and overgraze the small grazing land to meet their demand. This accelerates land cover changes (Markandya, Citation2001; Scherr, Citation2000; Yitaferu, Citation2007).
The Lake Tana sub-basin is the main head water source area of the Blue Nile River. There have been steady conversions of natural forests and grazing lands into cultivated lands in this area during the last century (Fisseha et al., Citation2011; Minale, Citation2013). These changes were primarily due to anthropogenic activities, such as land use/cover changes from forest and grass lands to cultivated lands, overgrazing, and improper cultivation of agricultural land which led to accelerated soil erosion and associated soil nutrient deterioration (Yitaferu, Citation2007).
LULC change is not uniform in Ethiopia. This makes it difficult to generalize the trends of LULCC by including areas that have not been studied yet. Therefore, site-specific analysis of LULC change is so crucial to exactly understand the extent of the change. Thus, this study has aimed to understand the spatio-temporal variability of LULC dynamics in Kecha-Laguna paired micro watersheds Northwestern Ethiopia.
2. Materials and methods
2.1. Study area description
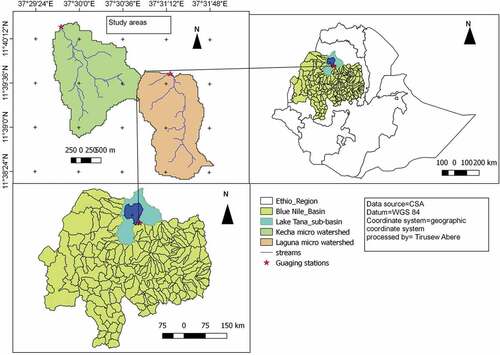
The study was conducted in Kecha-Laguna paired micro-watersheds, which are found in Amhara region, Bahir Dar zuria woreda; Northwestern Ethiopia. The watersheds are part of the Tana sub-basin located nearby Lake Tana. They are representative landscapes of the Northern part of the Blue Nile basin, particularly Lake Tana surroundings. Geographically, the study area lies within the coordinates of 11°38’24’’-11°40’12“”N latitude and 37°29’24”-37°31’48“”E longitude (Figure ). The study area is situated about 15 km from Bahir Dar city. Kecha (treated) covers 384.35 ha and untreated Laguna covers 339.26 ha. The landscape is heterogeneous in the watershed; as a result, diverse LULC types are commonly observed. Altitude of the study watersheds ranges from 1893 to 2120 m. a. s. l. The average rainfall is 1120 mm/year and average temperature of the area is 20°c (Adgo & Zeleke, Citation2015). A mixed crop and livestock farming system of agriculture is the main source of livelihoods for the people who reside in the watershed. The major crops grown in the area include maize (Zea mays), finger millet (Eleusine coracana), teff (Eragrostis tef), mango (Mangifera indica), banana (Musa acuminate), avocado (persea americana) and khat (Catha edulis Forsk). Rear animals include cattle (Bos indicus), sheep (Ovis aries), donkey (Equus africanus) and poultry (Gallus domesticus)
Figure 1. Study area map.
2.2. Method of data acquisition
The spatial and temporal dynamics of land use/cover classes were examined by using remote sensing data (aerial photographs, scale 1:50,000 and satellite images a resolution of 0.5–1.5 m) covering 59 years from 1957 to 2016. Orthorectified aerial photographs were purchased from Ethiopian Mapping Agency (EMA) and satellite images from AIRBUS Defense and Space via the KAKNEHI project of Bahir Dar University. The images were selected based on data availability and anticipated major changes in the government of Ethiopia. Aerial photos were the only source of spatial data in image form for the period predating the launch of satellite images, while satellite images were used because there were no recent aerial photographs available for comparison with older photographs. Thus, for this study, it was necessary to compare the aerial photographs of 1957 and 1984 with the QuickBird and SPOT image of 2006 and 2016, respectively, to detect and monitor the extent and direction of the changes in the land use/cover for Kecha micro watershed. While for Laguna micro watershed we used aerial photograph of 1957 and QuickBird and SPOT image of 2006 and 2016, respectively. Since we cannot get aerial photograph of the year 1984 which covers the studied micro watershed. In addition to the photos and images, a number of ground control points (GCP) were collected for each land use/cover types by using global positioning system (GPS) since it is used as a benchmark for classification and key informant interviews were made to know historical land uses.
2.3. Method of image processing and LULC change detection
Aerial photographs of the years 1957 and 1984 were converted into tagged image format (Tiff) by scanning the image with 1200 dots per inch (DPI) resolution scanner at Bahir Dar University GIS laboratory. The scanned photograph was Geo-referenced by taking 20 ground control points from the Google Earth image. The points were taken from old churches, road crossings and river crossings as well as a ridge of mountains. The boundary of the watershed was delineated by using 30 m*30 m resolution digital elevation model using ArcGIS version 10.3 software. The aerial photographs were classified into different land use/cover types using onscreen digitizing method with the help of QGIS 2.18 software. During interpretation of the photos those elements (tone, texture, shape, association, pattern and size) that aid for visual interpretation have been used. Since the scale of analysis made it difficult to separate rural settlement from cultivated land in aerial photos, these were grouped into cultivated and settlement land cover categories. Similarly, the land use/cover classes from the QuikBird and SPOT images were generated by onscreen digitizing method using QGIS 2.18 software on the basis of reflectance characteristics (false color composites) of the different land use/cover types. The reason for selecting this method is that, when we try to classify the images using supervised classification technique by selecting sufficient training sites, some land use/cover classes were miscategorized due to the diversity of land use/cover in the area and substantial spectral similarity among some classes (example, khat and forest, degraded land and settlement). Five land use/cover types were identified and analyzed (Table ). For the purpose of comparison or analysis, many land use/cover types produced from the QuickBird and SPOT images were synchronized to fit into the classes defined from the black and white aerial photographs. Thus, cultivated and settlement land use/cover in QuickBird and SPOT images were classified separately while the results of the two land use/cover types were added or merged for the purpose of analysis. Thus, finally, four land use/cover maps were produced, corresponding to the four reference years and temporal changes in land use/cover were determined. The rate of change was calculated for each land use/cover classes as
Table 1. Description of LULC types identified in the Kecha-Laguna micro watersheds, Northwestern highlands of Ethiopia
Where: R = Recent area of LU/LC in ha
P = Previous area of LU/LC in ha
Y = time interval between R and P in year
2.4. Land use/cover matrices analysis
LULC transition matrices were carried out through overlaying procedure in ArcGIS 10.3 software. A two-way cross-matrix obtained by the application of this was used to describe the key change types in the study area. Cross-tabulation analysis was conducted in order to determine the quantitative conversions from a particular land use/cover to another land cover category and their corresponding area over the evaluated period. Gross gains and losses were also calculated for the periods of 1957–1984, 1984–2006 and 2006–2016 for Kecha micro watershed and 1957–2006 and 2006–2016 for Laguna micro watershed.
3. Result and discussion
3.1. Land use/cover changes of Kecha micro watershed
Cultivated and settlement land was the major type of land use/cover in Kecha micro watershed during the whole study periods (Table and Figure , ). This clearly indicated that the majority of the current cultivated land had been already under cultivation for many years, which is true also for most other highlands of Ethiopia (Fisseha et al., Citation2011). The study revealed that there was a continuous increment in the area coverage of the cultivated and settlement lands during the study periods, growing from about 40.55% in 1957 to 72.3% in 2016. On the other hand, bush land and grazing land declined from about 30.1% and 15.2% in 1957 to 6.6% and 4.4% in 2016, respectively. Forest land decreased consistently between 1957 and 2006 and slightly increased between 2006 and 2016. In 2006 and 2016, degraded land shared 10% and 6.3% and khat plantation shared 0.12% and 3.1% of the total area of the watershed, respectively (Table ). The recent decline in degraded land and increments in the forest land could be due to watershed management practices implemented in the area through the government initiatives. To combat land degradation problems, the Water and Land Resource Centre (WLRC) in collaboration with the Amhara Regional Agricultural Research Institute (ARARI), Bureau of Agriculture (BoA) and the local community started land rehabilitation efforts through the implementation of sustainable land management (SLM) practices including exclosure establishment and the construction of soil and water conservation (SWC) structures since 2012 (Adgo & Zeleke, Citation2015). SWC measures including soil and stone bunds, fanya juu terraces, cut-off drain, waterways and exclosures (Adgo & Zeleke, Citation2015).
Table 2. Land use/cover types and areas covered in Kecha micro watershed in four different years (1957, 1984, 2006 and 2016)
Table 3. Magnitude of Land use cover change in Kecha micro watershed in five different periods
The extent and rate of LULC changes were different during the different periods. During the first period, between 1957 and 1984, the area coverage of grazing land, bush land and forest land decreased by 2.6%, 1.37% and 0.8%, losing 0.4, 0.2 and 0.1 ha per year, respectively. On the contrary, cultivated and settlement land increased by 4.9%, taking 0.7 ha per year from forest, bush and grazing land covers (Tables and ). During the second period, between 1984 and 2006, cultivated and settlement land expanded by 23.9%, taking 4.2 ha per year from forest, bush and grazing land, which declined by 20.3%, 9.3% and 4.4%, losing 1.6, 3.5 and 0.8 ha per year, respectively (Tables and ). During this period, the expansion rate of cultivated and settlement land is much higher than the first period. In addition to cultivated land, degraded land was also expanded by 10.04%, taking 1.8 ha per year from other land use/covers. This implied that there were no improved land management practices during this period. The conversion of natural forests into agriculture in these marginal areas might lead to accelerated soil erosion and land degradation (Yitaferu, Citation2007). The findings of this study are in agreement with the findings of many other studies made in the Blue Nile basin, which reported a significant decline of forest, bush and grazing land cover due to its conversion to other land uses, particularly into cultivated and settlement land (Zeleke & Hurni, Citation2001; Tegene, Citation2002; Fisseha et al., Citation2011; Yeshaneh et al., Citation2013; Geremew, Citation2013; Takala et al., Citation2016). Khat plantation expanded by 0.11%, taking 0.05 ha per year from other land use/covers (Tables and ). This might be due to the availability of groundwater and the high commercial value of Khat. In our field survey, we observed plenty of groundwater wells in the micro watershed. Key informant said that the area has groundwater resource and it has been developed after the intervention of SWC practices. In addition,; Lake Tana basin has groundwater potential (Yiak et al., Citation2015; Nigate et al., Citation2017). Yemiamerew (Citation2018) stated that cultivation of khat has a positive and significant effect on rural households’ income. During the third period, between 2006 and 2016, bush land, grazing land and degraded land decreased by 1.8%, 3.4% and 3.7%, by losing 0.7, 1.4 and 1.3 ha per year, respectively (Tables and ). Whereas cultivated and settlement land, forest land and khat plantation increased by 2.6%, 3.4% and 3%, by taking 1.1, 1.3 and 1.2 ha per year, respectively (Tables and ). The increase in forest land and decrease in degraded land were the result of area enclosure and land management practices that intervened in the study area since 2011 following severe land degradation in the watershed. The other reason for the increment of forest land might be the expansion of eucalyptus plantations. Gebrehiwot et al. (Citation2014) in Gilgle Abay watershed reported that forest cover increased from 10% to 22% between 1957 and 2001 due to the expansion of eucalyptus plantations. The finding of this study is supported by the finding of Alemayehu et al. (Citation2009) who stated that integrated watershed management (IWSM) is key to improve the land use/cover of the watershed towards poverty alleviation and sustainable livelihood. They also stated that the area under irrigation increased from 7 ha to 222.4 ha and area under dense forest increased from 32.4 ha to 98 ha due to the intervention of watershed management.
Table 4. Rate of land use/cover change in Kecha micro watershed for the four periods
Table 5. LULCC matrices of Kecha micro watershed (1957–1984)
The land use/cover change matrices also illustrated that the high rate of reduction in forest cover between 1957 and 1984 was due to its conversion/change into cultivated and settlement land (11.6 ha), bush land (11 ha) and grassland (3.4 ha). Likewise, the bush land declined largely due to its conversion into cultivated and settlement land (20.5 ha), to grazing land (8.6 ha) and to forest land (11 ha). In addition,; the grazing land also shrunk due to its conversion to cultivated and settlement land (22.2 ha), bush land (6.7 ha) and forest land (2.6 ha) (Table ). Similarly, between 1984 and 2006, the largest portion (29.9 ha) of the remaining forest was converted into cultivated and settlement land followed by its conversion to bush land (9.7 ha) and to degraded and grazing land (6.6 and 0.9 ha), respectively. Furthermore, the relatively large decline in bush land was because of its conversion into cultivated and settlement land (72.9 ha), grazing land (8.1 ha), forest land (5.2 ha) and degraded land (13.9 ha). Similarly, the expansion of cultivated and settlement land continued to the grazing land even during this period, taking away 25.5 ha grassland area. A significant portion of grazing land also converted to degraded land (8.5 ha) and a very small portion (1, 1.4 and 0.1 ha) converted to forest, bush and khat plantation, respectively (Table ). Between 2006 and 2016, a small portion of forest land (1.3 ha) was converted into cultivated and settlement land, to bush land (1.3 ha) and to a lesser extent to degraded and grazing land (0.03 and 0.2 ha), respectively. Similarly, the relatively small decline in bush land was due to its conversion to cultivated and settlement land (10.8 ha), grazing land (0.4 ha), forest land (5.4 ha) and degraded land (2.1 ha). In addition, grazing land also changed into cultivated and settlement land (14.6 ha), degraded land (3.8 ha), forest land (0.6 ha) and khat plantation (1.4 ha) (Table ). Degraded land also declined due to its conversion to forest land (1.2 ha), bush land (2.4 ha), grazing land (2 ha) and into cultivated and settlement land (17.8 ha). The large-scale conversion of the natural forest, bush land, and grazing land into cultivated and settlement land could be attributed to the high demand for agricultural land and construction of human settlement, presumably associated with the highest population growth in the area.
Figure 2. Land use/cover map of Kecha micro watershed (1957 and 1984).
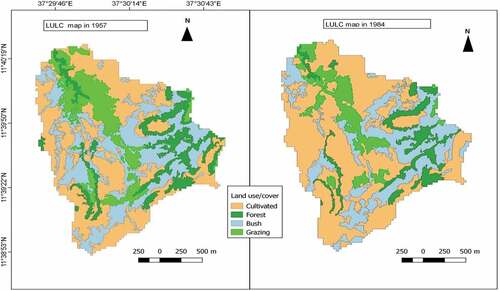
Figure 3. Land use/cover map of Kecha micro watershed in 2006 and 2016.
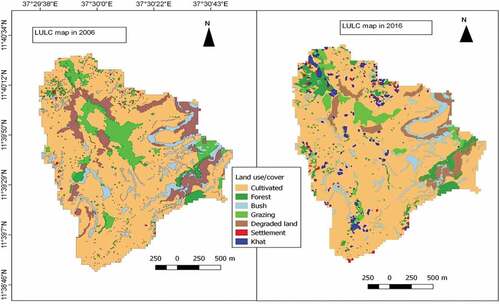
Table 6. LULCC matrices of Kecha micro watershed (1984–2006)
Table 7. LULCC matrices of Kecha micro watershed (2006–2016)
3.2. Land use/cover changes of Laguna micro watershed
As that of Kecha micro watershed, for all the years considered in this study, cultivated and settlement land was the dominant land use/cover type in Laguna micro watershed. The study revealed that there was a continuous increment in the area coverage of the cultivated lands during the study periods, growing from about 39.8% in 1957 to 52.2% in 2016. On the other hand, forest, bush and grazing lands decreased consistently from 1957 to 2006. In contrast to Kecha watershed, degraded land increased from 13.5% in 2006 to 14.5 in 2016 in Laguna watershed. This could be due to the lack of improved land management practices in the watershed. Khat plantation shared 0.1% and 3.1% of the total area of the watershed in 2006 and 2016, respectively (Table and Figure ).
Table 8. Land use/cover types and areas covered in Laguna micro watershed in three different periods (1957, 2006 and 2016)
The land use/cover change analysis revealed that the extent and rate of LULC changes were different during the different periods in Laguna watershed (Table ). The area coverage of forest land, grazing land and bush land decreased by 17.5%, 1.7% and 6%, respectively, between 1957 and 2006. On the contrary, the cultivated and settlement areas, degraded land and khat plantation increased by 12%, 13.2% and 0.08%, respectively, at the expanse of forest, grazing and bush lands (Table ). In the second period, between 2006 and 2016 cultivated and settlement land, degraded land and khat plantation expanded by 0.4%, 1.3% and 2.9%, respectively, at the expanse of forest land, grazing land and bush land contracted by 0.5%, 0.9% and 3.4%, respectively (Table ). Over the last 59 years, the cultivated and settlement land has expanded by an average rate of 0.21% per year, taking 0.83 ha per year from the other land use/cover types of the watershed. On the other hand, the grazing land has shrunk by 0.04% per year, losing 0.14 ha every year. The bush land has also registered a considerable loss of 0.16% per year, resulting in an average loss of 0.54 ha every year and forest cover declined annually by about 0.3%, resulting in an annual loss of 1 ha of the original forest cover. Degraded land has expanded by 0.25% per year, taking 0.8 ha per year from other land use/cover types (Table ). The reason for the increment of degraded land could be the expansion of cultivated land on steep areas of the watershed that accelerates erosion as well as lack of land management practices in the watershed. The finding is in line with the finding of many researchers in Ethiopia. Denboba (Citation2005) reported 75% of Shomba catchment, in the southwestern part of Ethiopia, was converted to farmlands and settlements from other land uses between the years 1967 to 2001. Zeleke and Hurni (Citation2001) identified that 99% of the forest covers converted into agricultural land at a Dembecha area in the northern part of the country between 1957 and 1995. They also observed that cultivation expanded to marginal areas as steep as >30% slope. Bewket (Citation2002) reports agricultural conversion of 79% of the riverine forests of the Chemoga watershed within the Blue Nile basin in about 40 years (1957–1998).
Table 9. Magnitude of Land use/cover change and rate of change in the Laguna micro watershed on the three different periods
Table 10. LULCC matrices for Laguna micro watershed (1957–2006)
The land use change matrices also illustrated that the high rate of reduction in forest covers between 1957 and 2006 was due to its conversion/change into cultivated and settlement land (33.8 ha), bush land (23.7 ha), grazing land (2.9 ha) and degraded land (13 ha). Similarly, the bush land declined due largely to its conversion into cultivated and settlement land (39.8 ha), degraded land (18.1 ha), forest land (5 ha) and to a lesser extent to grazing land (0.8 ha). Besides, the grazing land also shrunk due to its conversion into cultivated and settlement land (10.1 ha), bush land (0.1 ha), forest land (0.3 ha), degraded land (0.6 ha) as well as to khat plantation (0.2 ha) (Table ). Similarly, between 2006 and 2016, the smallest portion (2.3 ha) remaining small area of forest converted into cultivated and settlement land followed by its conversion to bush land (6.5 ha) and to degraded and grazing land (0.7 and 0.5 ha), respectively. Furthermore, the relatively large decline in bush land was due to its conversion to cultivated land (18.3 ha), grazing land (1.6 ha), forest land (5.5 ha) and degraded land (11 ha). Similarly, the expansion of cultivated and settlement land continued to the grazing land even during this period, taking away 3.4 ha grassland area. A significant portion of the grazing land was also converted to degraded land (1.6 ha) and a very small portion (0.1, 0.7 and 0.1 ha) converted to forest, khat plantation and bush land, respectively (Table ). The large-scale conversion of the natural forest, bush land, and grazing land into cultivated and settlement land could be attributed to the high demand for agricultural land and construction of human settlement, presumably associated with the highest population growth in the area.
Figure 4. Land use/cover map of Laguna micro watershed in 1957, 2006 and 2016.
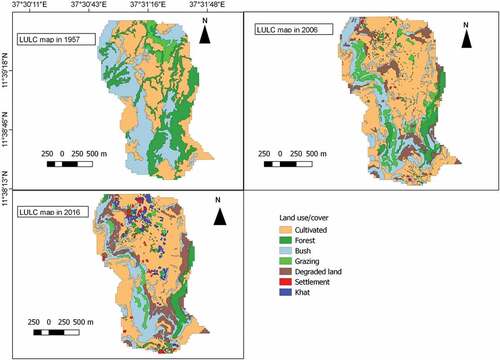
Table 11. LULCC matrices for Laguna micro watershed (2006–2016)
4. Conclusion
This study quantified the dynamics of LULCC in Northwestern Ethiopia. The result showed that there have been considerable land use/cover changes in the last 59 years in Kecha-Laguna micro watersheds. In Kecha watershed, cultivated land and settlement areas, degraded land and Khat plantation increased by 31.7%, 6.3% and 3.11%, respectively, at the expense of other land uses/covers such as forest, bush and grazing land, which declined by 6.86%, 23.5% and 10.8%, respectively. In Laguna watershed, cultivated and settlement land, khat plantation and degraded land increased by 12.5%, 3.1% and 14.5%, respectively while forest, bush and grazing land declined by 18%, 9.4% and 2.6%, respectively, for the last 59 years. In association with recent watershed development efforts encompassing area enclosures and soil and water conservation practices in the Kecha watershed, degraded lands were reduced by 3.7% while forest land increased by 3.4% between 2006 and 2016. Hence, proper land management approach is important to recover forests from degradation.
Acknowledgements
The authors acknowledge KAKHENI project of Bahir Dar University and Hawassa University for their financial support.
Additional information
Funding
Notes on contributors
Tirusew Abere
Tirusew Abere holds bachelor of science degree in Natural Resources Management from Bahir Dar University, Ethiopia. The author joined Agriculture and Environmental Sciences College of Bahir Dar University since 2014. After one-year work experience, she got in-country scholarship in Hawassa University. Now, she holds her a master of science degree in Watershed Management. Land use/cover change, soil erosion modelling, land suitability analysis are the author’s research area of interest.
References
- Adgo, E., & Zeleke, G. (2015). Experimental plots for soil loss assessment. In A. Enyew, D. Mekete, & J. Nyssen (Eds.), TropiLakes, tropical lakes in a changing environment: Water, land, biology, climate and humans (pp. 1-7).
- Alemayehu, F., Taha, N., Nyssen, J., Girma, A., Zenebe, A., Behailu, M., Deckers, S., & Poesen, J. (2009). The impacts of watershed management on land use and land cover dynamics in Eastern Tigray (Ethiopia). Resources, Conservation and Recycling, 53(4), 192–18. https://doi.org/10.1016/j.resconrec.2008.11.007
- Assen, M., & Nigussie, T. (2009). Land use/cover changes between 1966 and 1996 in Chirokella micro-watershed, Southeastern Ethiopia. East African Journal of Sciences, 3(1), 1-8. https://doi.org/10.4314/eajsci.v3i1.42778
- Bantider, A., Hurni, H., & Zeleke, G. (2011). Responses of rural households to the impacts of population and land-use changes along the Eastern Escarpment of Wello, Ethiopia. Norsk Geografisk Tidsskrift-Norwegian Journal of Geography, 65(1), 42–53. https://doi.org/10.1080/00291951.2010.549954
- Bewket, W. (2002). Land cover dynamics since the 1950s in Chemoga watershed, Blue Nile basin, Ethiopia. Mountain Research and Development, 22(3), 263–269. https://doi.org/10.1659/0276-4741(2002)022[0263:LCDSTI]2.0.CO;2
- Demissie, F., Yeshitila, K., Kindu, M., & Schneider, T. (2017). Land use/Land cover changes and their causes in Libokemkem District of South Gonder, Ethiopia. Remote Sensing Applications: Society and Environment, 8, 224–230. https://doi.org/10.1016/j.rsase.2017.10.001
- Denboba, M. A. (2005). Forest conversion, soil degradation, farmers’ perception nexus: Implications for sustainable land use in the Southwest of Ethiopia (Vol. 26). Cuvillier Verlag.
- Deribew, K. T., & Dalacho, D. W. (2019). Land use and forest cover dynamics in the North-eastern Addis Ababa, central highlands of Ethiopia. Environmental Systems Research, 8(1), 8. https://doi.org/10.1186/s40068-019-0137-1
- Elias, E., Seifu, W., Tesfaye, B., & Girmay, W. (2019). Impact of land use/cover changes on lake ecosystem of Ethiopia central rift valley. Cogent Food & Agriculture, 5(1), 1595876. https://doi.org/10.1080/23311932.2019.1595876
- Fisseha, G., Gebrekidan, H., Kibret, K., Yitaferu, B., & Bedadi, B. (2011). Analysis of land use/land cover changes in the Debre-Mewi watershed at the upper catchment of the Blue Nile Basin, North West Ethiopia. Journal of Biodiversity and Environmental Sciences, 1(6), 184–198. http://www.innspub.net
- Gashaw, T., Tulu, T., Argaw, M., & Worqlul, A. W. (2017). Evaluation and prediction of land use/land cover changes in the Andassa watershed, Blue Nile Basin, Ethiopia. Environmental Systems Research, 6(1), 17. https://doi.org/10.1186/s40068-017-0094-5
- Gebrehiwot, S. G., Bewket, W., Gärdenäs, A. I., & Bishop, K. (2014). Forest cover change over four decades in the Blue Nile Basin, Ethiopia: Comparison of three watersheds. Regional Environmental Change, 14(1), 253–266. https://doi.org/10.1007/s10113-013-0483-x
- Geremew, A. A., 2013. Assessing the impacts of land use and land cover change on hydrology of the watershed: A case study on Gigel-Abbay Watershed, Lake Tana Basin, Ethiopia [Doctoral dissertation]. unpublished paper.
- Haregeweyn, N., Tsunekawa, A., Nyssen, J., Poesen, J., Tsubo, M., Tsegaye Meshesha, D., Schütt, B., Adgo, E., & Tegegne, F. (2015). Soil erosion and conservation in Ethiopia: A review. Progress in Physical Geography: Earth and Environment, 39(6), 750–774. https://doi.org/10.1177/0309133315598725
- Hurni, H. (1993). Land degradation, famine, and land resource scenarios in Ethiopia. In Pimentel, D. (Ed.), World Soil Erosion and Conservation. Cambridge Studies in Applied Ecology and ResourceManagement (pp. 27-61). Cambridge, UK: Cambridge University Press.
- Lambin, E. F., Geist, H. J., & Lepers, E. (2003). Dynamics of land-use and land-cover change in tropical regions. Annual Review of Environment and Resources, 28(1), 205–241. https://doi.org/10.1146/annurev.energy.28.050302.105459
- Lemenih, M., & Kassa, H. (2014). Re-greening Ethiopia: History, challenges and lessons. Forests, 5(8), 1896–1909. https://doi.org/10.3390/f5081896
- Markandya, A. (2001). Poverty, environment and development. FOLMER, H. Et Al, 192–213.
- Mather, A. S., & Needle, C. L. (2000). The relationships of population and forest trends. The Geographical Journal, 166(1), 2–13. https://doi.org/10.1111/j.1475-4959.2000.tb00002.x
- Meshesha, D. T., Tsunekawa, A., Tsubo, M., Ali, S. A., & Haregeweyn, N. (2014). Land-use change and its socio-environmental impact in Eastern Ethiopia’s highland. Regional Environmental Change, 14(2), 757–768. https://doi.org/10.1007/s10113-013-0535-2
- Minale, A. S. (2013). Retrospective analysis of land cover and use dynamics in Gilgel Abbay Watershed by using GIS and remote sensing techniques, Northwestern Ethiopia. International Journal of Geosciences, 4(7), 1003. https://doi.org/10.4236/ijg.2013.47093
- Nigate, F., Ayenew, T., Belete, W., & Walraevens, K. (2017). Overview of the hydrogeology and groundwater occurrence in the Lake Tana Basin, Upper Blue Nile River Basin. In Social and ecological system dynamics (pp. 77–91). Cham: Springer.
- Scherr, S. J. (2000). A downward spiral? Research evidence on the relationship between poverty and natural resource degradation. Food Policy, 25(4), 479–498. https://doi.org/10.1016/S0306-9192(00)00022-1
- Sewnet, A. (2015). Land use/Cover change at Infraz Watershed, Northwestern Ethiopia. Journal of Landscape Ecology, 8(1), 69–83. https://doi.org/10.1515/jlecol-2015-0005
- Takala, W., Adugna, T., & Tamam, D. (2016). Land use land cover change analysis using multi temporal landsat data in Gilgel Gibe, Omo Gibe Basin, Ethiopia. International Journal of Science and Technology, 5(7), 309–323.
- Tegene, B. (2002). Land-cover/land-use changes in the derekolli catchment of the South Welo Zone of Amhara Region, Ethiopia. Eastern Africa Social Science Research Review, 18(1), 1–20. https://doi.org/10.1353/eas.2002.0005
- Wondie, M., & Mekuria, W. (2018). Planting of Acacia decurrens and dynamics of land cover change in Fagita Lekoma District in the Northwestern Highlands of Ethiopia. Mountain Research and Development, 38(3), 230–239. https://doi.org/10.1659/MRD-JOURNAL-D-16-00082.1
- Yemiamerew, Z., (2018). The effect of Khat (Catha Edulis Forsk) cultivation on rural household income, crop and livestock farming in Bahir Dar City Rural Kebeles & Bahir Dar Zuria District, North-West Ethiopia. http://Hdl.Handle.Net/123456789/8978. unpublished papaer(doctorial dessertation).
- Yeshaneh, E., Wagner, W., Exner-Kittridge, M., Legesse, D., & Blöschl, G. (2013). Identifying land use/cover dynamics in the Koga catchment, Ethiopia, from multi-scale data, and implications for environmental change. ISPRS International Journal of Geo-Information, 2(2), 302–323. https://doi.org/10.3390/ijgi2020302
- Yiak, D. L., Tilahun, S. A., Schmitter, P., Nakawuka, P., & Steenhuis, T. S. (2015). Groundwater recharge of Robit-Bata experimental Watershed, Lake Tana Basin, Ethiopia. Conference paper in https://agris.fao.org/agris-search/search.do?recordID=QL2018000682
- Yitaferu, B., (2007). Land degradation and options for sustainable land management in the Lake Tana Basin (LTB), Amhara Region, Ethiopia [Doctoral dissertation]. University of Bern.
- Zeleke, G., & Hurni, H. (2001). Implications of land use and land cover dynamics for mountain resource degradation in the Northwestern Ethiopian highlands. Mountain Research and Development, 21(2), 184–191. https://doi.org/10.1659/0276-4741(2001)021[0184:IOLUAL]2.0.CO;2