
 ?Mathematical formulae have been encoded as MathML and are displayed in this HTML version using MathJax in order to improve their display. Uncheck the box to turn MathJax off. This feature requires Javascript. Click on a formula to zoom.
Abstract
The reduction of the fuel consumption and the exhaust gases emission is always significant to improve the ship energy efficiency management in the field of shipping transportation industry. The study of the novelty numerical method has been addressed in this research to decrease the fuel consumption of diesel engine and restrict the exhaust gases emission from the ship operational activities. This numerical method was supported by Matlab simulation environment through the curve fitting tool. The internal factors related to the energy efficiency operational indicator (EEOI) would be investigated like the probability samples by the developing Monte Carlo (MC) simulation method. The central limit theorem of the numerical simulation method has been employed into the novelty method. The determination of the optimal values has also been collected from this proposed method. In particular, the heavy fuel oil is 1450 (Tons), the diesel oil is 13 (Tons), the mass of cargo carried is 130,000 (Tons), and the distance traveled is 7,500 (Nautical Miles) for the target ship. When we compared the fuel consumption value between the results collected from the novelty simulation method and the experimental data then the reduction of the fuel consumption is approximately 550 (Tons) corresponding to save 27.5% from the novelty numerical simulation method. Additionally, the future prediction trends for EEOI have also been approached with the high determination coefficient (R2) 0.99 and 0.9995, respectively. The EEOI index has also been dropped down 5.10−6 compared with the calculated value from the experimental data. So, this one was meaningful to reduce the exhaust gases emission through the reduction of the fuel consumption on ship. The research results will help the ship operators and ship owners to decrease the fuel consumption in the field of ship energy efficiency management.
PUBLIC INTEREST STATEMENT
Climate change is a critical phenomenon impacting on the life environment. In where, the international shipping transportation contributes partly in this climate change. This research has been addressed to decrease the sea environmental pollution due to the ship operation activities nowadays. International Maritime Organization (IMO) pursuits ship energy efficiency measures. In where, EEOI (Energy Efficiency Operational Indicator) is an efficient tool to restrict the environmental pollution from ship operation. The establishment of EEOI model has been researched as well as the analysis on external factors impacting on EEOI model has been investigated. The research results are significant in the sea environment.
1. Introduction
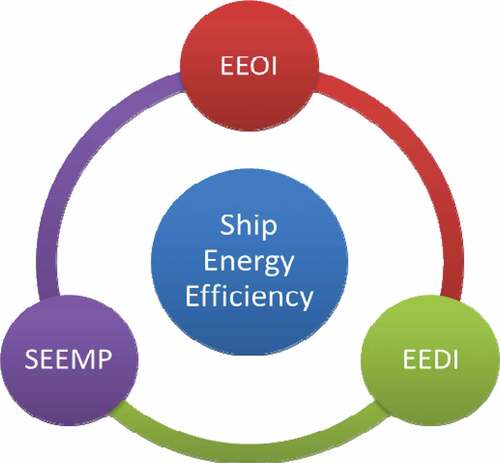
The climate change is a critical phenomenon due to the harmful gases emission from the other industries. The main element causing this phenomenon is carbon dioxide (CO2) gas emissions. In where, the international shipping transportation industries play a significant role in developing the national economy at each country in the world nowadays. The global economy, harmful gases emission, and greenhouse gas emissions are caused by the fuel oil consumption of engines and devices on ships. So, the reduction of ship fuel oil consumption is a main key to limit the exhaust gases emission from shipping operation activities and save the transportation cost. The International Maritime Organization (IMO) requires all ships operate on the international shipping transportation routes which obey MARPOL 73/78. In where, MARPOL 73/78 stands for the International Convention for the Prevention of Pollution from ships (International Convention for the Prevention of Pollution from Ships (MARPOL), Citation1997). Some reports announce that the greenhouse gas (GHG) emissions need to decrease from fifty to eighty percentage below by 2050 (IPCC, Citation2007). The lower of amount of greenhouse gas emissions will restrict the dangerous from climate changes. The emissions from shipping transportation industries are about 30% per totally global exhaust gas emissions (Smith, Citation2014). The reduction of exhaust gases emission from ships is very significant as well as complying with the international laws in the field of ship emission control. It is a main reason that the use of ship energy efficiency measure tools to decrease the exhaust gases emission plays a vital role in the life environmental protection as well as the effective energy usage on ships. These tools have been showed in Figure including EEOI, EEDI, and SEEMP.
Figure 1. Ship energy efficiency management tools including EEOI: Energy Efficiency Operational Indicator; EEDI: Energy Efficiency Design Index; SEEMP: Ship Energy Efficiency Management Plan.
The energy efficiency of ships is a hot topic relating on the optimal energy usage and the exhaust gases emission control from ship operation activities. The improvement of ship energy efficiency management is a target that there are some researchers who are working hard to find out the effective solutions in this field. International Maritime Organization (IMO) proposes the ship energy efficiency measure tools (EEOI, EEDI, SEEMP) in aim with helping the ship operators, ship owners in the field of ship energy efficiency management. Currently, there are some research results published relating on ship energy efficiency. The calculation tools of energy efficiency operational indicator (EEOI) have been established for the some types of ship (Prill et al., Citation2020; Shaw & Tzu, Citation2019; Tran, Citation2017).
The simulation and analysis are the process to investigate the characteristics of object through using the simulation model. The simulation method is a priority solution in order to evaluate the features of that object. From then, the analysis process would be conducted to verify the proposed simulation model. In the field of ship energy efficiency management, the simulation model of EEOI has been designed in the Simulink environment (Tran, Citation2019a). The simulation model fidelity has been addressed to evaluate the ship operational performance by Nielsen (Nielsen et al., Citation2019). Consequently, the regression model of ship performance has been established to predict the ship speed and engine power when considering navigation environment condition (Yoo & Kim, Citation2019).
The bulk carrier is a kind of ship that carries the bulk cargo like as coal, rice, etc. Normally, a bulk carrier will have a lot of cargo holds depending on the specification size of this ship type. The carried capacity mainly intended to carry the unpackaged bulk cargo. The ship structure is a complex internal hull structure to meet the ship efficiency, capacity and storage as well as safety characteristics. This type of ship is usually operated widely nowadays on the international sea ocean areas.
The path planning of mathematical equations has been addressed into this research. There are some computational solution of the time-fractional Schrödinger equation which has been given out by Arqub (Abu Arqub, Citation2019a). The reproducing kernel algorithm has been proposed to obtain the numerical solutions of fractional order systems (Abu Arqub, Citation2019b). Consequently, the reproducing kernel Hilbert space has been proposed to implement a relative recent computational algorithm by Arqub (Abu Arqub, Citation2018). The mathematical application in engineering is a benefit to solve the complicated issue. The efficient reproducing kernel algorithm has been addressed for the numerical solutions in porous media along with Dirichlet boundary conditions (Abu Arqub & Shawagfeh, Citation2019). However, the Monte Carlo simulation method has been investigated in this research. This novelty method is consider as the numerical simulation solution to present the elements of object of study. The numerical simulation method has been investigated in this paper for a target ship of shipping transportation company in Vietnam. The sample data has been performed through the graphical figures as well as validation of the external factors like as the weather conditions, the ship hull condition and propeller roughness on the novelty numerical model. The rest of paper is constructed into the sections in particular section 1, introduction; section 2, materials and methodology; section 3, the case of study; section 4, results and discussion; section 5, conclusion remarks.
2. Materials and methodology
2.1. Energy efficiency operational indicator
EEOI is defined as the ratio of carbon dioxide (CO2) gas emission efficiency per unit of transport work (IMO, Citation2009). EEOI is an important parameter in the field of energy efficiency management of ships. To conduct some tasks for researching this index then some steps should be proposed such as:
Need to determine the time of voyage;
Need to determine the data collected;
Conduct to collect the data from ships;
Transmit to the relevant data if possible;
Compute the EEOI index.
The calculation of EEOI index following EquationEquation 1(1)
(1) below (IMO, Citation2009):
In where:
j: is the fuel type;
i: is the voyage number;
FCij is the mass of consumed fuel j at voyage i;
CFj: is the fuel mass to CO2 mass conversion factor for fuel j;
mcargo: is the cargo carried (tonnes) or work done (number of TEU or Passengers) or gross tonnes for passenger ships; and
D: is the distance in nautical miles corresponding to the cargo carried or work done.
The energy efficiency measures have been supervised and implemented by IMO. It is a reason that to perform EEOI calculations would enable for the operators to measure the energy efficiency of ship and to analyze the effect of any modifies in operation such as voyage planning optimization, hull and propeller cleaning, trim optimization. This EEOI index is the important parameter to evaluate the harmful gases emission from ships due to IMO proposed. Additionally, the amount of carbon dioxide gas emission would be adopted through this EEOI. Additionally, the evaluation of environmental impacting aspect will be based on this EEOI index. From the EquationEquation (1)(1)
(1) , this EEOI index is more lower more better corresponding to the amount of carbon dioxide gas emission would be reduced. Then, the greenhouse gas emission is also decreased through the EEOI value.
2.2. Some properties of the Monte Carlo simulation method
Monte Carlo simulation method is a type of simulation which relies on the repeated random sample and statistical analysis to calculate the results. Monte Carlo simulation method has been developed in the 1940’s. This method has been based on the numerical analysis that employs the statistical sampling techniques to obtain the probabilistic approximation approaches. In this method, the mathematical model and its equations have been utilized according to the sequences of random sample numbers.
Mote Carlo simulation method uses the statistical tool to model systematically for a real data system. It estimates the probability of obtaining a successful outcome. The statistical distribution of process may be determined through Monte Carlo simulation method. Consequently, the random number is used as a tool to calculate the object. This method is a versatile tool to analyze and evaluate the complex measurements and be used as an effective tool to simulate the uncertain object in the field of engineering.
The specification equations of this method are presented through two parameters including the sample mean and standard deviation. The sample mean () is the probability weighted result of the random process.
The sample variance is the mean of sequence difference from the function and its’s mean. Consequently, the second key statistic is the sample variance () which provides the estimate the individual sample spreads around the mean. The equation of sample variance is showed in EquationEquation (3)
(3)
(3) .
The standard deviation () is calculated from the sample variance (
). The equation of standard deviation will be withdrawn from the sample variance. The advantage of standard deviation that it could measure the same units as the data samples. In where, the variance will be measured in the squared units.
2.3. Research gap
The ship energy efficiency plays a vital role in decreasing the greenhouse gas emission and saving the fuel consumption onboard. The existing ocean-going vessels have been investigated and validated through the different methods to optimize the energy efficiency. There are some solutions approaching to this issue by scholars and researchers in the world. The fuel consumption prediction model has been established for bulk carriers when sailing on the specialized ocean areas (Tran, Citation2019b). The establishment of the numerical simulations energy efficiency model has been performed (Coraddu et al., Citation2013). This model would be carried out estimating the fuel consumption on ship. The novelty model of EEOI has been established for two different parts (Tillig et al., Citation2016). Firstly, the assessment of a ship’s energy consumption based on an ordinary static power prediction. Secondly, the advanced operational analysis considers hydrodynamic and machinery systems effect. As well as, a panamax tanker vessel was selected as the case study vessel to prove the versatility of the model for five example simulations for the design and operation of ships. The ship energy efficiency management model has also been established based on the simulink environment platform by Tran (Tran, Citation2019a). The external factors especially impact on the ship energy efficiency management. The study of ship loading has been considered firstly for ship energy efficiency management through evaluating the fuel consumption (Tran, Citation2020). Consequently, the navigation environment conditions have been investigated into the ship energy efficiency model (Tran, Citation2019c). The development of a computer program has been carried out for ship speed and behavior in case of a head waves (Journée & Journee, Citation1979). Additionally, the study of slow-steaming method is an optimal solution to reduce the greenhouse gas emission through energy and cost efficiency for Ro-Ro (Roll-On, Roll-Off) vessels (Ammar., Citation2019). Some these specific results have summarized the significant solution to save the fuel oil consumption and decrease the exhaust gases emission from the ship operation. However, the finding the novelty model for ship energy efficiency is necessary both fuel consumption reduction and future trend prediction. This research has been addressed them in this paper.
3. The case of a bulk carrier
A bulk carrier is chosen to validate the novelty numerical simulation method. This is a large size vessel of shipping transportation company in Vietnam (Figure ). The specification parameters of this vessel have been showed in Table . The data acquisition system has a mission to record the operational data. The fuel oil consumption of diesel engines is measured by the flow meters. The navigation environment condition is determined through the navigation parameters like as wind speed, wind direction, wave height, current tidal, water depth, etc. These parameters will be recorded into voyage log both bridge and engine department. The bridge room of vessel contains the devices in aim with identifying the navigation environment conditions when ship sails (Figure ). The engine room contains a lot of engines and equipments (Figure ).
Figure 2. A certain bulk carrier, M/V NSU JUSTICE of VINIC shipping transportation company, Vietnam.

Table 1. The specific parameters of a certain bulk carrier
(MMSI: Maritime Mobile Service Identity; MCR: Maximum Continues Rating; n: Engine speed)
A certain large size bulk carrier is transported popularly in the international transportation routes nowadays. The transportation efficiency of bulk carriers is the highest comparing with the different types of ship such as container ships, oil tanker vessels, passenger ships, Ro-Ro, etc. The certain vessel is divided into two departments: Bridge and Engine department.
Figure 3. Bridge room.

Figure 4. Engine room.

Figure 5. Flow meter.

Figure 6. GPS device.
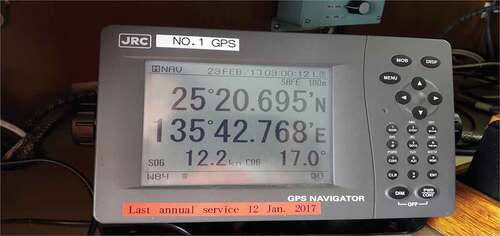
Figure 7. Navigation environment parameter meters.

The data acquisition system of a certain bulk carrier plays an important role in the field of collecting the operational data of ship. These meters are kept constantly and good condition when operating ships. On the other hand, the devices are fitted on the bridge room of ship and supervised by the bridge officers (Figure ,,). The GPS (Global Positioning System) is equipped on ship like in Figure .
The collection of operational database has been conducted firstly in this research. A certain bulk carrier namely M/V NSU JUSTICE has been investigated through its voyages. Each voyage consists of the ballast condition (mcargo = 0) and the laden condition (mcargo≠0). There are eleven voyages which collected from this vessel (voyage N10÷ N20) during Jun 29th, 2014 to Jul 30th, 2016. This ship has been sailed on the fixed routes according to the voyage charter party. The ports of departure and destination are changeable between Japan-Singapore-Australia-Brazil with certain ports: Nagoya, Kisarazu, Oita, Tobata (Japan), Singapore port (Singapore), Ponta Da Madeira (Brazil), Port Walcott (Australia). The detail information of all voyages has been performed in Table .
Table 2. The detail information of data collected from a bulk carrier
4. Results and discussion
According to the experimental data of M/V NSU JUSTICE 250,000 DWT, the range of heavy fuel oil consumption rate is (569.3; 3027.57) (Unit: Tons). The diesel fuel consumption is range of (2.9; 21.9) (Unit: Tons). The weight of cargo carried is a range of (22,500; 247,500) (Unit: Tons) and distance traveled at each voyage is a range of (3456; 12,286) (Unit: Nautical Miles) (Table ). These values have been determined through the actual operational data from a bulk carrier. The detail voyages have been provided in Table with the operational time of ship and the locations of ports. There are total eleven voyages collected to support this research.
Table 3. The values of variable factors of bulk carrier
The novelty simulation method has been proposed through the developing Monte Carlo simulation method. The fundamental theory of this method has been addressed into 2.2 of this paper however the developing method could make the probability regulation of variable through its simulation. The simulation process has been conducted based on the simulation samples which generated from probability data. This sample data generation has been supported by Excel software. The detail has been presented in Table . Totally, there are thirty sample simulations in this research.
Table 4. Samples from Monte Carlo simulation method
In where, the variable Y is an EEOI calculation result corresponding to each certain variable Xi (i = 1 ÷ 4) based on EquationEquation (1)(1)
(1) and represented in EquationEquation (4)
(4)
(4) . In this research, the types of fuel oil are both HFO and DO corresponding to the variables X1 and X2, respectively. The coefficient CF will be taken 3.1144 and 3.206 corresponding to the heavy fuel oil and diesel oil, respectively.
In Table , there are 30 samples that they were simulated by Monte Carlo simulation method. Based on the advantages of Monte Carlo simulation method, which generated the input variables following N = 30 samples to result the output variables generated too. The novelty simulation method will perform the random samples and dealing a large number of experiments. Actually, the number of simulation has been taken from the proposed simulation method. The limit values have been considered according to the collected values from a bulk carrier. The detail of a bulk carrier has been performed into item 3 of this paper. The sample mean ()and standard deviation (
) of variables Xi(i = 1 ÷ 4) and Y have been performed in Table . The determination of these values has been based on EquationEquation (2)
(2)
(2) and EquationEquation (3)
(3)
(3) in this paper.
Table 5. The sample mean and standard deviation of samples
The Monte Carlo simulation method has been applied in this case completely to bring significantly in this research. The graphical results of this simulation have been presented through the box and whiskers plots in Figures –. The function of probability distribution has been applied in order to simulate results collected to find out the optimal values when Monte Carlo simulation method used. The box and whiskers in graphical results have been showed under proposing the normal probability distribution function. The results collected, analyst process will be conducted in aims with energy efficiency of ship. The detail distribution of variances has been showed in Figure . The research results have been collected through the novelty numerical simulation method in the field of ship energy efficiency management. The specific parameters of ship energy efficiency management have been performed through the numerical simulation. The type of fuel used, the volume of fuel consumption, the mass of cargo carried, and the distance traveled have been analyzed through this numerical simulation.
Figure 8. Box plot for HFO consumption.
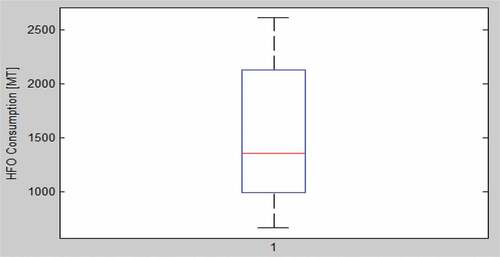
Figure 9. Box plots for DO consumption.
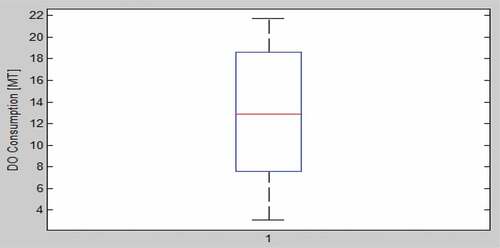
Figure 10. Box plot for cargo carried.
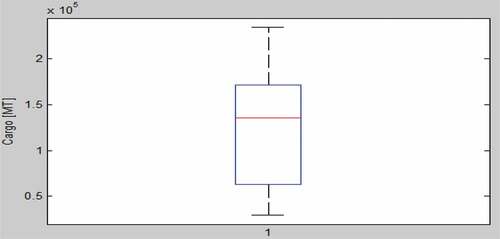
Figure 11. Box plot for distance traveled.
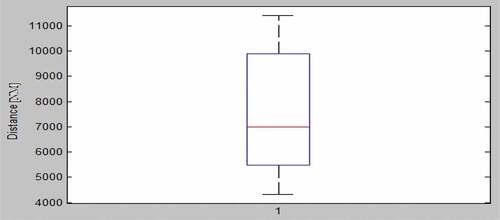
The data mining is useful to analyze research results. The graphical results have been represented by the box plot and the input parameters including heavy fuel oil and diesel oil consumption rate, a mass of cargo carried, and distance traveled at each voyage. The beginning of preprocessing analyzes process, outlier will be eliminated from the sample of all voyages following explanation mentioned above. The box plots of input variables including HFO consumption, DO consumption, cargo carried, and distance traveled have been showed in Figures –. The tops and bottoms of each box plot are 75% and 25% at each the sample, respectively. The novelty method is useful to simulate the internal factors of the investigated field in the shipping transportation. The line in the middle of each box is the sample median. Luckily, the samples have been researched out of outliers above.
The numerical results have been collected from the novelty simulation method for the heavy fuel oil, the diesel oil, the mass of cargo, and the distance traveled at each voyage. From then, the research results have showed the target values to help researchers could fild the working characteristics of each the investigated parameter. The raw simulation data has been summarized through scale values of vertical axis at each graphical figure. The detail values have been showed in Table .
Table 6. The finite element data of each investigated parameter
Moreover, these finite element data are very significant to make a circle to determine the working parameter of each investigated parameter. In this research, the vovelty numerical simulation method is known as the Monte Carlo simulation method which makes the ship operators and ship owners determine the working parameters of main diesel engine during the ship operation time at each voyage. Hence, the value distribution of each finite element data has been presented in Figure . This one is very meaningful to determine both the optimal parameter of each element and the distribution density. The distributive characteristics of each element have been performed through the normal and nonparametric distribution charateristics.
Figure 12. Distribution data of sample variables Xi(i = 1 ÷ 4) and Y through novelty simulation method.
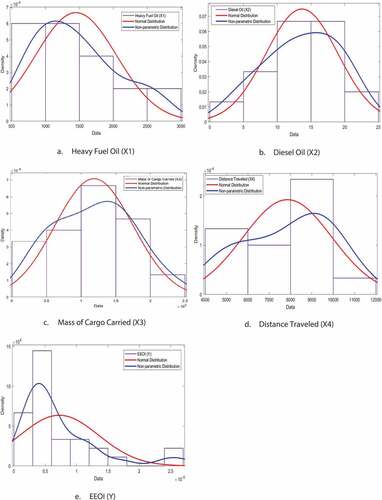
The numerical simulation has been presented in Figure with the investigated parameters in this research. Through the graphical results, the determination of distributation values has been collected from the novelty simulation method. Each value has been classified into the horizontal axis corresponding to the simulated data. The operational data of ship is a specific parameter for EEOI index including fuel oil consumption (HFO and DO), distance traveled of ship. The mass of cargo is a fixed parameter based on the cargo working plan of chief officer and charter party between ship owner and charterer. So, this parameter is not reffered in this research. The fuel oil consumption and distance traveled would be analyzed by statistical analysis method for investigating the probability distribution (Figure ). The distribution curves have been performed through the probability density function (PDF). The normal distribution estimation method is applied to investigate the parametric curve fitting (red line). The kernel density estimation method is used for investigating the non parametric curve fitting (blue line) (Figure ).
Consequently, the novelty numerical simulation method has presented its prioritization with determining the optimal value of each investigated parameter. Through the distributive characteristics of each variable, the performance of optimal value has been showed in Figure . The heavy fuel oil is 1450 (Tons), the diesel oil is 13 (Tons), the mass of cargo carried at each voyage is 130,000 (Tons), and the distance traveled at each voyage is 7500 (NM). Additionally, the EEOI index has also been simulated through the novelty numerical simulation method. Based on the theoretical knowledge of this index, the evaluation of greenhouse gas emission could be conduct through the novelty simulation method.
Then, the characteristics curve between fuel oil consumption and ship speed has been established by statistical regression method with supporting of the Minitab Software (Figure ). The relationship between fuel consumption and ship speed is presented in Equation (13).
In where: is the fuel oil consumption of marine diesel engine (MT)
is the ship speed (Knots)
Figure 13. The number of record of fuel oil consumption (Unit: MT).
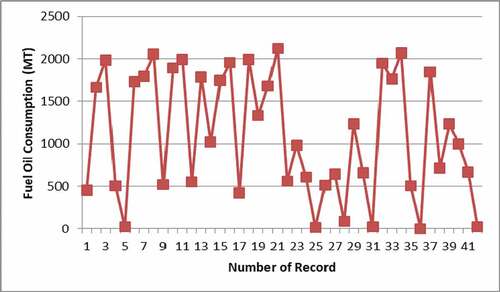
Figure 14. The characteristics curve between fuel oil consumption and ship speed.
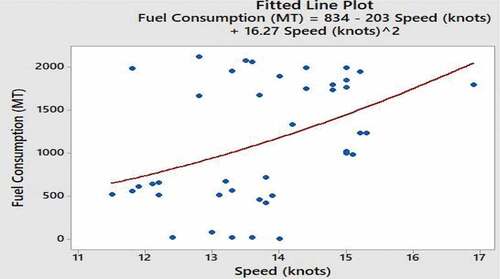
The collected experimental data on a bulk carrier has been performed in Figure ,1 in this research. The heavy fuel oil consumption has been showed based on the collected data of each voyage through the number of record. The experimental data of heavy fuel oil consumption is about 500 ÷ 2000 (Tons) from the collected data. If that, the fuel oil consumption reaches to 2000 (Tons). The comparison of heavy fuel oil consumption between the novelty simulation method and the experimental data has been conducted and then the fuel consumption of engine saves to 27.5% comparing with the optimal fuel consumption value through the novelty numerical simulation method. This novelty simulation method is a significant solution to save the fuel oil consumption of diesel engine on ships. Then, the improvement of ship energy efficiency management has been conducted through the novelty numerical simulation method when comparing with the experimental data collected.
Additionally, the EEOI index has also been determined through the novelty numerical simulation method in Figure ). Then, the maximum value of EEOI could approach through the proposed method is 0.000005. The EEOI value collected from the novelty simulation method is low. This research result is significant to reduce greenhouse gas emission through this EEOI index. From the fundamental theory of this EEOI, the value of EEOI is more smaller more better. This one would present the optimistic characteristics of the environmental aspect in this research.
Figure 15. EEOI index from the actual operation data.
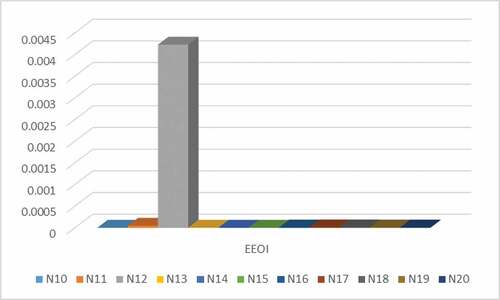
The EEOI calculated from the experimental data has been perfomed in Figure . The maximum value of this index is 0.0045 (Figure ). The EEOI value has been calculated from EquationEquation (1)(1)
(1) of item 2.1 in this paper. Normally, this EEOI index will represent the greenhouse gas emission aspect. This index would be compared with the novelty numerical simulation method. From the graphical result in Figure , the EEOI index of novelty numerical simulation method is lower than the EEOI index from the actual operation data. This one will showed that the novelty numerical simulation method in this paper has the benefit to decrease the greenhouse gas emission from the shipping transportation activities. The novelty method is significant to the environmental aspect in the field of greenhouse gas emission reduction.
On the other hand, the influence of the average weather conditions (wave height and wind speed) of voyages has been investigated in this research. There are total eleven voyages from voyage N10 to voyage N20. The values of wave height (m) and wind speed (m/s) have been represented according to the time of voyage. Each voyage includes ballast condition and laden condition. First of all, this ship will be sailed at ballast condition to a port of destination. Afterward, the process of loading cargo has been happened at that port and then discharging cargo at some different ports depending on each certain voyage of ship. The collected data of a certain bulk carrier has been simulated for the specific weather condition including wave height and wind speed.
Figure 16. Wave height and wind speed of Voyage N10.
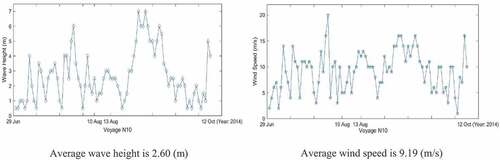
Figure 17. Wave height and wind speed of Voyage N11.
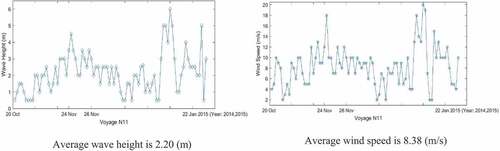
Figure 18. Wave height and wind speed of Voyage N12.
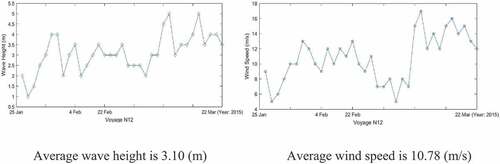
Figure 19. Wave height and wind speed of voyage N13.
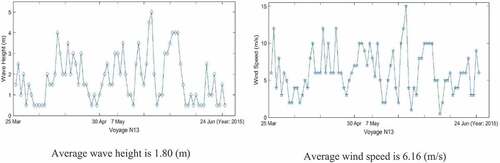
Figure 20. Wave height and wind speed of Voyage N14.
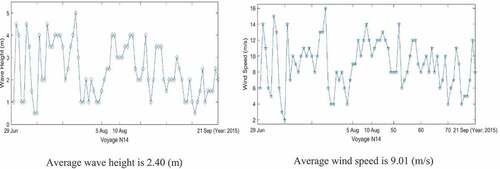
Figure 21. Wave height and wind speed of Voyage N15.
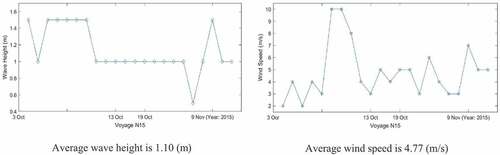
Figure 22. Wave height and wind speed of Voyage N16.
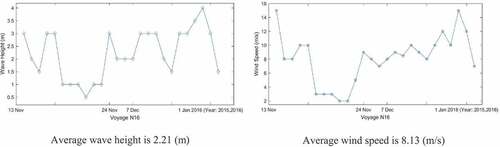
Figure 23. Wave height and wind speed of Voyage N17.
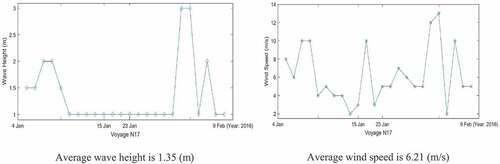
Figure 24. Wave height and wind speed of Voyage N18.
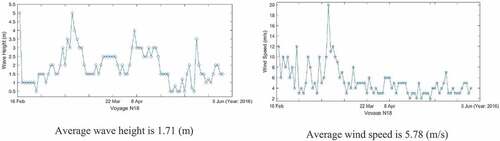
Figure 25. Wave height and wind speed of Voyage N19.
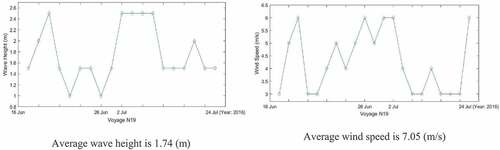
Figure 26. Wave height and wind speed of Voyage N20.
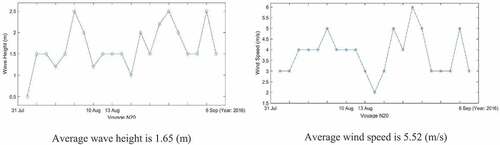
Totally, the values of average wind speed and wave height have been calculated from the weather data collected from a certain bulk carrier. The weather condition of each voyage has been presented in Figure –2. The values of average weather condition have been showed in Table according to the different voyage.
Figure 27. The average wave height and wind speed following different voyages.
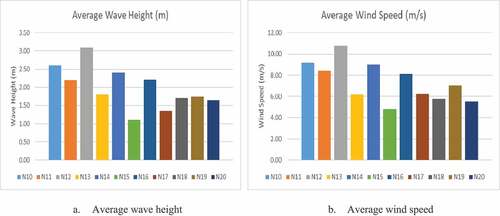
Table 7. Average weather condition of voyages
Table 8. EEOI index calculated for each voyage
The further study of the weather condition has been conducted in this research through the specific parameters including the wave height and the wind speed. These parameters have been collected from the actual operation data of a certain bulk carrier. The detail of each voyage has been showed in Table at the cetain time. Consequently, the calculation of the average wind speed and wave height has been conducted in this research. These average parameters have been described in Table and Figure . Then, the highest values of the average wind speed and wave height at voyage N12 are 10.78 (m/s) and 3.10 (m), respectively. When the time period of sailing voyage has been considered then the voyage N12 is the longest. Since, the fuel consumption of this voyage is high. It is a main reason that the EEOI index of voyage N12 is the highest compared with the other voyages (Figure ).
In a conclusion, the EEOI index will depend the weather condition of ship along with the period time of voyage. This index is very important to evaluate the environmental side in the field of the ship operation activities. Additionally, the study of external factors like as weather condition plays a vital role in the field of ship energy efficiency mangement as well as the environment aspect. The heavy weather condition is an important factor to contribute the volume of exhaust gases emission from ships. The heavy weather condition will be presented through the high average wind speed and wave height. The collection data is very significant to study this impact on the ship energy efficiency management. So, the appropriate selection of weather condition will contribute on saving the fuel oil consumption and decreasing the greenhouse gas emission through EEOI index. Moreover, this work will depend totally on the experienced working of the ship masters/captain.
Finally, the novelty numerical simulation method could predict the future trend of each variables. The probability curves of heavy fuel oil, diesel oil, mass of cargo carried, and distance traveled have been showed in Figure through the novelty numerical simulation method. This one will help the ship operators and ship owners to manage the operational data through the determination of future trend of these data.
Figure 28. Prediction curves of variables through the novelty simulation method.
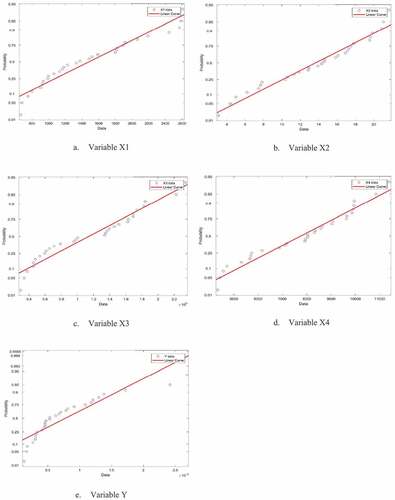
The linear curve of predictive data is quite near with the generated data from the novelty numerical simulation method. This method is a basic tool to determine to the future trend of each parameter in the field of ship energy efficiency management. The variables have been collected easily through the probabilty trend in Figure . Then, the determination of future trend could be predict through the data collected from the novelty numerical simulation method. In a result, the determination coefficient of probability could approach to 0.99 for the heavy fuel oil, diesel oil, mass of cargo carried, and distance traveled. Moreover, the EEOI parameter (Y) could reach to 0.9995 like in Figure ).
5. Conclusion remarks
The novelty numerical simulation method has been addressed in this research to reduce both the fuel oil consumption of main diesel engine on ships and greenhouse gas emission from the ship operation activities. The novelty numerical simulation method is developed based on the Monte Carlo simulation method along with the probability characteristics could be able to predict the future trend. The EEOI index is a fundamental factor to build up this research along with a certain bulk carrier. The numerical simulation results have been collected from this research for the heavy fuel oil, the diesel oil, the mass of cargo carried, and the distance traveled. Addionally, the weather condition has also investigated in this research through the average wind speed and wave height calculated from the actual operation data. From then, the novelty numerical simulation method is very significant to decrease the fuel oil consumption and the greenhouse gas emission.
The reduction of fuel oil consumption reaches to 550 (Tons) with saving to 27.5% from the actual fuel consumption of a certain bulk carrier. The numerical simulation method could generate the simulations from the random variables. The fuel oil consumption will influence on the ship energy efficiency management then the reduction of fuel oil consumption is an effective solution to improve the ship energy efficiency management.
The EEOI index is also droped down through the novelty numerical simulation method. This index is more lower more better to improve the fresh air quality relating on the environmental aspect. This reduction will decrease the greenhouse gas emission from the shipping operation activities. Through the novelty numerical simulation method, the EEOI index is lower with 0.000005 comparing with the calculated EEOI values from the actual operational data (0.0045).
The weather condition is an impotant factor impacting on the EEOI index. The average weather condition could be calculated from the wind speed (m/s) and the wave height (m) collected. Through this research, the EEOI index will be influenced by the weather condition and period of time of each voyage. The heavy weather condition is a main reason to lead the high index. So, the reduction of this EEOI is very significant to decrease the greenhouse gas emission from ships. The ship operators need to pay attention to the navigation environment conditions of ship.
The probability trend of the variables could be collected from the novelty numerical simulation method. The future trend is a benefit to contribute on the significant prediction of the parameters investigated. The determination coefficients of the investigated parameters approach to 0.99 and 0.9995 from the novelty numerical simulation method.
Competing interests
The author declares no competing interests.
Declaration of interest statement
There is no conflict interest of authors in this research.
Acknowledgments
The author would like to thank the Editor-in-Chief, Associate Editors, and anonymous reviewers for their valuable comments to improve the high quality of paper. Finally, the author thanks to colleagues at Marine Research Institute, Vietnam Maritime University, Haiphong city, Vietnam helping me to complete this research.
Additional information
Funding
Notes on contributors
Tien Anh Tran
Tien Anh Tran, Ph.D. He is a University Lecturer/Researcher at Marine Engineering Department in Vietnam Maritime University, Haiphong City, Vietnam. He graduated B. Eng. and M. Eng. in Marine Engineering from Vietnam Maritime University in 2011 and 2014, respectively. He received his Ph.D. degree in Marine Engine Engineering from Wuhan University of Technology, Wuhan City, P.R. China in 2018. Currently, his research interests are Ocean Engineering, Marine Engineering, Ocean Environmental Engineering, Mathematical Model and Control, Renewable Energy, Energy and Fuels, Diesel Engine Speed Control Theory and Algorithm, Computer Science.
References
- Abu Arqub, O. (2018). Numerical solutions of systems of first-order, two-point BVPs based on the reproducing kernel algorithm, Calcolo, 31–24.
- Abu Arqub, O. (2019a). Application of residual power series method for the solution of time-fractional Schrödinger equations in one-dimensional space. Fundamenta Informaticae, 166(2), 87–110. https://doi.org/10.3233/FI-2019-1795
- Abu Arqub, O. (2019b). Numerical algorithm for the solutions of fractional order systems of dirichlet function types with comparative analysis. Fundamenta Informaticae, 166(2), 111–137. https://doi.org/10.3233/FI-2019-1796
- Abu Arqub, O., & Shawagfeh, N. (2019). Application of reproducing Kernel algorithm for solving Dirichlet time-fractional diffusion-gordon types equations in porous media. Journal of Porous Media, 22(4), 411–434. https://doi.org/10.1615/JPorMedia.2019028970
- Ammar., N. R. (2019). Energy-and cost-efficiency analysis of greenhouse gas emission reduction using slow steaming of ships: Case study Ro-Ro cargo vessel. Ships and Offshore Structures, 13(8), 868–876. https://doi.org/10.1080/17445302.2018.1470920
- Coraddu, A., Figari, M., & Savio, S., (2013). Ship energy assessment by numerical simulation. The 5th International Conference on Computational Methods in Marine Engineering, MARINE 2013.
- IMO. (2009). Second IMO GHG Study (2009). International Maritime Organization, 4 Albert Embankment, London SE1 7SR, Published in 2009.
- International Convention for the Prevention of Pollution from Ships (MARPOL). (1997). Annex VI Prevention of Air Pollution from Ships. Technical Report, International Maritime Organization.
- IPCC. (2007). Climate change 2007: Synthesis report. Geneva, Switzerland: IPCC. http://www.ipcc.ch/pdf/assessment-report/ar4/syr/ar4_syr.pdf
- Journée, J. M. J., & Journee. (1979). Prediction of speed and ship behaviour in a seaway. Int Shipbuilding Prog, 23(265), 285–299. https://doi.org/10.3233/ISP-1976-2326501
- Nielsen, J. B., Sandvik, E., Pedersen, E., Asbjǿrnslett, B. E., & Fagerholt, K. (2019). Impact of simulation model fidelity and simulation method on ship operational performance evaluation in sea passage scenarios. Ocean Engineering, 188, 106268. https://doi.org/10.1016/j.oceaneng.2019.106268
- Prill, K., Behrendt, C., Szczepanek, M., & Pozoga, I. M. (2020). A new method of determining energy efficiency operational indicator for specialized ships. Energies, 13(5), 1082. https://doi.org/10.3390/en13051082
- Shaw, H. J., & Tzu, F. M. (2019). The strategy of energy saving for smart shipping. Advances in Technology Innovation, 4(3), 165–176. http://ojs.imeti.org/index.php/AITI/article/view/3918
- Smith, T. (2014, September 15). Third IMO GHG Study 2014. International Maritime Organization (IMO).
- Tillig, F., Ringsberg, J. W., Mao, W., & Ramne, B. (2016). A generic energy systems model for efficient ship design and operation. Proceedings of the Institution of Mechanical Engineers, Part M: Journal of Engineering for the Maritime Environment, 231(2), 649–666. https://doi.org/10.1177/1475090216680672
- Tran, T. A. (2017). A research on the energy efficiency operational indicator EEOI calculation tool on M/V NSU JUSTICE of VINIC transportation Company, Vietnam. Journal of Ocean Engineering and Science, 2(2017), 55–60. https://doi.org/10.1016/j.joes.2017.01.001
- Tran, T. A. (2019a). Investigate the energy efficiency operation model for bulk carriers based on simulink/matlab. Journal of Ocean Engineering and Science, 4(3), 211–226. https://doi.org/10.1016/j.joes.2019.03.004
- Tran, T. A. (2019b). Design the prediction model of low-sulfur-content fuel oil consumption for M/V NORD VENUS 80,000 DWT sailing on emission control areas by artificial neural networks. Proceedings of the Institution of Mechanical Engineers, Part M: Journal of Engineering for the Maritime Environment, 233(1), 345–362. https://doi.org/10.1177/1475090217747159
- Tran, T. A. (2019c). A study of the energy efficiency management for bulk carriers considering navigation environment impacts. Journal of Intelligent & Fuzzy Systems, 36(3), 2871–2884. https://doi.org/10.3233/JIFS-171698
- Tran, T. A. (2020). Effect of ship loading on marine diesel engine fuel consumption for bulk carriers based on the fuzzy clustering method. Ocean Engineering, 207, 107383. https://doi.org/10.1016/j.oceaneng.2020.107383
- Yoo, B., & Kim, J. (2019). Probabilistic modeling of ship powering performance using full-scale operational data. Applied Ocean Research, 82, 1–9. https://doi.org/10.1016/j.apor.2018.10.013