
 ?Mathematical formulae have been encoded as MathML and are displayed in this HTML version using MathJax in order to improve their display. Uncheck the box to turn MathJax off. This feature requires Javascript. Click on a formula to zoom.
Abstract
The concentrations of total petroleum hydrocarbons (TPHs) in surface water samples from ten sampling sites in the streams around the Nigerian National Petroleum Corporation (NNPC) Depot, Apata, Nigeria were examined to evaluate the environmental quality and health risks of TPH using (ninety) 90 samples. Physicochemical parameters such as pH, temperature, acidity, alkalinity, nitrate, phosphate, total dissolved solid (TDS), electrical conductivity (EC) and chemical oxygen demand (COD) were determined using standard methods. Extraction of TPHs from the water samples was achieved by liquid-liquid extraction method and quantified by gas Chromatograph Mass Spectrometry (GC-MS). Results showed that physicochemical parameters determined were within the acceptable limit except phosphate. In addition, the even-numbered aliphatic hydrocarbons (C18-C22) were higher in concentration than their odd-numbered (C15-C19). Mean TPH concentrations ranged from 0.59 ± 0.01 to 34.60 ± 5.50 ng/L were generally below target values. The health risk assessment of non-carcinogenic effects showed HQ and HI values for benzo (a) pyrene and indeno (1,2,3-cd) pyrene were less than 1.0 for adults and children, indicating no adverse effects but the sum of CR was lower than the permissible limit of 1.0 × 10⁻⁴. Although pollution was low, there is a need for monitoring and regular checks to ensure public safety.
PUBLIC INTEREST STATEMENT
TPHs are a large family of several hundred chemical compounds that originally come from crude oil. At low concentrations, they may not pose any immediate threat, but could trigger a great challenge over a long period of time. Activities within the depot have created environmental concern in the area due to leakages and oil spills during loading of petroleum products. Also, oil storage tanks that may sometime contain water are drained of the water prior to truck loading on a daily basis and are emptied into the depot surface water body which negatively affect the environment. Oil containment materials used in the depot to curtail the spread of oil are very effective. Furthermore, the health risk of TPH calculated revealed no adverse effect.
Competing Interests
The authors declare no competing interests.
1. Introduction
Petroleum products as contaminant pose great danger to the immediate and nearby environment and habitats (Akinola et al., Citation2019). They contain priority organic pollutants like aliphatic and aromatic hydrocarbons (of C5–C35 chains) collectively known as total petroleum hydrocarbons (TPHs) that need close monitoring in the environment (Adeniji et al., Citation2018; Sanches et al., Citation2017). TPHs are a large family of several hundred chemical compounds that originally come from crude oil. At low concentrations, they may not pose any immediate threat, but could trigger a great challenge over a long period of time (Adeniji et al., Citation2017; Quevenco, Citation2011; Sari et al., Citation2018). The most important components of the petroleum hydrocarbons in the aquatic environments are the normal alkanes, combusted hydrocarbons and degraded crude oils (Adeniji et al., Citation2017). Environmental pollution is of great concern because petroleum hydrocarbons are toxic to all forms of life. Refined products like petroleum show higher toxicity compared to crude oil since metal speciation is altered and new metals are added to the matrix during the refining process (Adewuyi & Olowu, Citation2012; Edokpayi et al., Citation2016; Uzoekwe & Oghosanine, Citation2011). Petroleum hydrocarbon can cover water surface by forming a thin film, which is harmful to aquatic organisms and hostile to all other biological chain.
TPH is defined as the measurable amount of petroleum-based hydrocarbon (aromatic and aliphatic) in an environmental media such as soil and water, which is dependent on analysis of the medium in which it is found (Guerriero et al., Citation2011; Zrafi et al., Citation2013). TPHs themselves may not be a direct pointer of hazard to humans or the environment (Agency for Toxic Substances and Disease Registry [ATSDR], Citation1999; United States Department of Health and Human Services [USDHHS], Citation1999), but their presence indicates the health status of the water body and is also used for source tracking of the contaminants in coastal water and sediments (Gay et al., Citation2010; Zaghden et al., Citation2005; Zrafi et al., Citation2013). TPHs are hardly degradable for microorganisms and persistent in soil and water (Das & Chandran, Citation2011; Sari et al., Citation2018). Macaulay and Rees (Citation2014) stated that fundamental variation exists in the pathway for the dissipation of TPH when spilled on land and water. Waters associated with hydrocarbons typically contain high concentrations of dissolved organic and inorganic minerals (Özdemir, Citation2018). When these components are released into the water, they affect physical and chemical processes that take place and the impacts on aquaculture could be very severe because oil has a tendency to bio-accumulate in the tissues of fish, mollusks, mussels and other mammals including humans (Adeniji et al., Citation2019; Ahmed et al., Citation2014). Some researchers have reported that some of the TPH compounds such as polycyclic aromatic hydrocarbons (PAHs) are genotoxic, mutagenic, carcinogenic, and/or teratogenic in nature and well implicated in endocrine system disruption at levels higher than the maximum allowable limit within a very short time (Adeniji et al., Citation2018; Brazkova & Krastanov, Citation2013). They can cause anoxic/hypoxic condition that affects the general metabolism of aquatic organisms in the water bodies, which can cause the death of both flora and fauna (Bahadar et al., Citation2014; Guo et al., Citation2011; Ogeleka et al., Citation2016; Stout et al., Citation2004). In addition, petroleum contaminants can bioaccumulate along the food chain and finally threaten the human health (Park & Park, Citation2011). Ingestion of TPH can cause health effects such as neurological disorder, respiratory, cardiac, hepatic and renal disorders, gastrointestinal, cancer and death (Agency for Toxic Substances & Disease Registry (ATSDR), Citation2018). Furthermore, recent investigations suggested that exposure to oils may also increase the risk of nonfatal myocardial infarction within 1–3 years of spillage (Strelitz et al., Citation2018).
TPHs have received much attention in terms of scientific research especially in developed countries because of the adverse effects they have on the environment, animals and human health; however, there is dearth of such knowledge in developing countries like Nigeria. In addition, regulatory concentration limits for TPH have evolved over the last several years from being predominantly based on nuisance (e.g. odour, discolouration) to being increasingly based on human health protection (Interstate Technology & Regulatory Council (ITRC), Citation2018; Tomlinson & Michael, Citation2016). Activities at the several petroleum depots in the country such as loading of fuel into tankers, maintenance of pipelines and accidental discharge and leakages from tanks or tanker trucks contribute to the pollution of the surrounding ecosystem including surface water bodies with hydrocarbons (Daniel & Nna, Citation2016; Olayinka et al., Citation2019). Evaluating the human health risks associated with petroleum releases is the subject of ongoing research (Interstate Technology & Regulatory Council (ITRC), Citation2018) and there have been a considerable number of studies on TPH contamination of surface water and groundwater in Nigeria (Adewuyi & Olowu, Citation2012; Aniefiok et al., Citation2018; Daniel & Nna, Citation2016; Imaobong & Prince, Citation2016; Uzoekwe & Oghosanine, Citation2011). However, most of these studies laid no emphases on health risk assessments. It is therefore pertinent to determine the concentration of TPHs and estimate the human health risk in surface water within the Apata depot and its environs. The study is important in order to determine the required cleaning-up levels and to suggest remediation alternatives to minimize the human health risk.
2. Materials and methods
2.1. Description of study area
The Nigerian National Petroleum Corporation (NNPC) Depot is located between latitude 7° 23′ 26′′ to 7° 24′ 22′′ N and longitude 3°48′ 27′′ to 3°49′ 25′′ E (Figure ). It is situated in Apata area under Ido local government Area of Oyo State, Nigeria. The area used to be a remote location suited for petroleum products depot nevertheless, due to rapid urbanization and increase in population, the sparse land around the depot are now used as residential estates and inhabitants depend on the groundwater and the river for domestic purpose. The depot receives petroleum products from Mosimi Depot in Sagamu, Ogun State through a 12-inch pipe at a distance of 79 km. Total petroleum products storage capacities in Ibadan Depot are; premium motor spirit (PMS) 102,730 m3, dual-purpose kerosene (DPK) 28,740 m3 and automotive gas oil (AGO) 36,400 m3. The depot supplies petroleum products to Oyo, Osun and parts of Northern Nigeria. A shallow stream flows through the depot into a bigger river transversing the residential estates. Activities within the depot have created environmental concern in the area due to leakages and oil spills during loading of petroleum products. Also draining of oil storage tanks that may contain water are drained prior to truck loading on a daily basis and are emptied into the depot surface water body, which negatively affects the environment. Information on containment put in place by the company to control oil spillage was documented as absorbent boom, absorbent rolls, absorbent pads and biosolve (dispersant). However, absorbent boom is used to prevent continuous flow of the spill on running stream while absorbent rolls are used when the spill has a wide spread. Absorbent pads and biosolve are used for oil recovery through damping and squeezing of oil into a container and emulsify escape oil, respectively. Figure shows the Map of the study area indicating the sampling locations.
Figure 1. Map of study area showing sampling points.
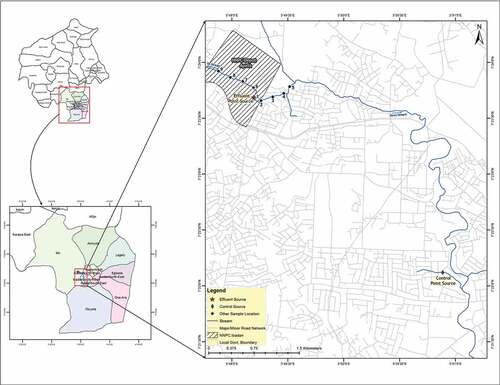
3. Sample collection
Ninety (90) surface water samples were collected in the morning using 250 ml pre-washed amber bottles rinsed with the water sample and dipped around 10 cm below the water level at designated sampling points from the running stream at the NNPC depot in Apata Ibadan between May—July 2019 during wet season. Samples were taken in triplicates from ten different sampling points; point source (PS), downstream (DS), DS 200 m, DS 400 m, DS 600 m, DS 800 m and upstream (UPS), UPS 200 m, UPS 400 m, UPS 600 m and UPS 800. The bottles were tightly covered with screw caps. The control site was located at Obasa community in Oluyole Estate Ibadan, Nigeria and was about 9.5 km away from the depot. On the map of the study area, PS = 1, DS200 m = 2, DS 400 m = 3, DS600 m = 4, DS 800 m = 5, UPS 200 m = 6, UPS 400 m = 7, UPS 600 m = 8 and UPS 800 m = 9. The samples were stored in an ice chest during transportation to the laboratory for extraction of analytes, which was carried out the same day. Physical and chemical parameters of surface water samples such as pH, total dissolved solid (TDS), electrical conductivity (EC), temperature, acidity, phosphate, nitrate, chemical oxygen demand (COD) and alkalinity were determined according to (APHA, Citation2005). pH, TDS, EC, temperature in water samples were determined electronically using a hand-held combined Hanna pH meter (combo Hi 98,130, Hanna USA). The procedure involved measuring of 20 mL of water sample into a clean pre-washed beaker and the electronic probe was inserted for measurement of pH, TDS, EC and temperature in situ. Alkalinity: Exactly 50 mL of the water sample was measured into conical flask. Three (3) ml of mixed indicator; bromocresol green and methyl red, was added to the sample. A green colour was obtained and then titrated with H2SO4 (N/50) until a pink endpoint was observed.
Nitrate: About 1 mL of the sample was measured in a nitrate bottle + 4 ml of distilled water + few drops of conc. HCl + few drops nitrate reagent and was read at a wavelength of 270 nm using in a UV spectrophotometer.
Acidity: Exactly 10 mL of water sample was measured into a conical flask, followed by two drops of methyl orange indicator. The water sample was undiluted and the acidity was determined by titration with 0.02 N sodium hydroxide.
4. Sample extraction
Liquid-liquid extraction was employed for the extraction of TPH in water.
Water samples were extracted according to the method of USEPA Method 3510 C,1996. 250 ml of water sample (unfiltered) was poured into a separating flask. 40 ml of dichloromethane (DCM) was added into the flask and then shaken vigorously for at least 5 minutes and pressure being released at intervals. The sample was allowed to stand for some minutes till two distinct layers were formed in the flask. The lower layer (organic extract) of the sample was filtered into a beaker through a filter paper containing glass wool and anhydrous sodium sulphate. The process was repeated two times with 20 ml of the extracting solvent, DCM added. The extracts were combined and concentrated by evaporation at room temperature overnight in a fume cupboard by covering with a perforated aluminium foil.
5. Sample clean-up
Sample clean-up was done by USEPA Method 3630 C,1996
A 600 × 19 mm clean up column was prepared. The hole was blocked with glass wool, 3 g of activated silica gel (60 mesh) was added and the column was topped with Na2SO4. The column was rinsed by eluting with 20 ml n-hexane and discarded. The concentrated extract was loaded onto the prepared column and eluted with 50 ml n-hexane. The eluates were then concentrated to 1 ml using a rotary evaporator under a gentle stream of pure nitrogen. 1 ml of the extract was transferred into a well-labelled vial and stored at 4°C prior to Gas Chromatograph Mass Spectrometry (GC-MS) analysis.
6. Instrumental and analytical conditions
Analyses by GC–MS were carried out using S6890/5973 N (Agilent, USA) system equipped with a Combi-PAL autosampler (CTC Analytics AG, Switzerland). The auto sampler was equipped with a 32-position 10/20 mL tray, 10/20 mL agitator. The GC was equipped with split/splitless inlet working in splitless mode to a 30 m x 0.250 mm DB-1 MS column with a 0.25 µm film thickness (Agilent, USA). Helium was used as carrier with a constant flow rate of 1 mL/min. GC oven temperature program: 40°C (held for 10 min), heating to 240°C at 20°C/min (held for 20 min), the temperature of the MS interface was kept at 240°C. MS detection was conducted in the mode of scanning ions in the range of m/z 34–600. Working standards solutions for both the alkanes and the surrogate (1-chlorooctadecane) were prepared from the stock solutions and kept in amber bottles at <4 ◦C. The calibration standards in the range of 0.05–20 ng/mL were prepared with n-hexane and used for the calibration of the instrument. The Agilent Chemstation chromatography software was used to generate average response factor for each analyte from the calibration curves plotted which were linear with correlation coefficients ranging from 0.98 to 0.99. The linearity obtained for all analytes were within the acceptable range of R2 ≥ 0.99. TPH was thereafter estimated as the total concentration of the n-alkanes eluting from nC8 to nC40 with the addition of PAHs.
7. Quality control
All reagents and solvents used were of analytical grades. Spiked blank, reagent blank and 1-chlorooctadecane standard solution were included with each set of samples to ensure the integrity of the analytical method and corresponding analytical results. Samples were spiked with concentration of 20 ng/L standard solution of 1-chlorooctadecane to 500 mL pre–extracted water samples. Distilled water (500 mL) was first pre-extracted in triplicate with 30 mL dichloromethane as a blank sample. Spiked samples were then extracted and analysed. There were no target compounds detected in the procedural and solvent blank. Recovery yields varied between 66% and 137%, with an average of 88% for the water. Also, the recovery of 1-chlorooctadecane added to all water samples ranged from 44 to 105% which were within the acceptable range of 40–140% for hydrocarbons (Kansas Department of Health and Environment [KDHE], Citation2015). Limit of detection (LOD) for n-alkanes was estimated using eight replicate injections of a middle-level calibration standard. The LOD was calculated by multiplying the “t” value at 99% confidence level with the instrument response and the values obtained were in the range of 0.06–315 ng/L. The precision of the instrument, which was estimated as the relative standard deviation (RSD), was generally less than the maximum limit of 25%, as it ranged from 3.61 to 8.32% for the n-alkanes.
8. Health risk assessment
Human risk assessment of TPH was calculated for chronic daily intake (CDI), non-carcinogenic hazard quotient (HQ) and hazard index (HI), and cancer risk (CR) using the values described in American Standard Testing Method (ASTM) (Citation2002, Citation2004). The EquationEquations (3)(3)
(3) , (Equation4
(4)
(4) ), and (Equation5
(5)
(5) ) are adopted from US Environmental Protection Agency (USEPA) (Citation1989).
Chronic Daily Intake (CDI) was calculated as:
where, CDI = Chronic Daily Intake in water (mg kg−1 day−1),
IR = Ingestion rate of water (3 L day−1 for adult, 1.3 L day−1 for children,
C = Concentration of PAHs in water (mg L−1) samples,
BW = Body weight (kg) (61.67 kg for adult, 17 kg for a child, F = Exposure frequency (day year−1) = 350 days year−1,
ED = Exposure duration (years) = 24 years for an adult and 6 years for children (American Standard Testing Method [ASTM], Citation2004),
AT = Averaging time = life expectancy (years), 365 days X 75 years,
AT = 75 years for carcinogenic effects in adult, (American Standard Testing Method [ASTM]Citation2002, Citation2004).
Non-carcinogenic hazard index (HI) was calculated as the sum of hazard quotients (HQ).
i = 1 … n
Where, CDI = Chronic Daily Intake (mgkg−1 day−1),
RfD = Reference dose (mgkg−1 day−1) (US Environmental Protection Agency [USEPA], Citation2001) and SF is slope factor are presented on Table ,
N = numbers of elements observed.
HQ>1 denotes non-carcinogenic adverse health effects, HQ<1 denotes no adverse effects (US Environmental Protection Agency [USEPA], Citation2001)
Cancer risk Equationequation 6(6)
(6) is adopted from US Environmental Protection Agency (USEPA) (Citation2011)
Where, CDI = Average daily dose (mg kg−1 day−1),
SF = Slope factor
Risk value> 1.0 × 10⁻⁴ indicates carcinogenic effects, US Environmental Protection Agency (USEPA) (Citation2011)
8.1. Statistical analysis
Data collected were subjected to simple descriptive (Mean and Standard deviation) and inferential statistics. Duncan Multiple Range Test was used for separation of means using SPSS Windows version 21.0.
9. Results and discussion
The mean values of the physical and chemical parameters of water samples within NNPC depot, Apata and its vicinity are presented in Table . It was observed that the average pH of all the samples ranged from 7.27 ± 0.12 to 7.64 ± 0.03 compared to 7.10 ± 0.02 recorded for the control sample. A high pH of 7.64 ± 0.03 was observed at DS 800 m, and this may be because of spillage of petroleum products and draining of oil storage tank while the lowest value was recorded for the control sample. The pH values recorded in this study were slightly alkaline compared to report of Adewuyi and Olowu (Citation2012) who recorded acidic pH (6.35 ± 0.06) on the same location. Uyom et al. (Citation2014) reported that exceptionally high or low pH values in surface waters can be harmful to aquatic organisms. The pH of the water samples may be attributed to anthropogenic activities around the area and the water may serve as a sink for various wastes (Olayinka et al., Citation2018). The pH values reported in this study were within WHO and DPR limits of 6.5–8.5. The pH values observed in this study were within the value (8.60 ± 0.02) reported by Abiodun et al. (Citation2017) for water of Algoa Bay, East Cape, South Africa.
Table 1. Reference dose and slope factor values of PAHs
Table 2. Physicochemical parameters of surface water within NNPC Apata depot
Mean temperature values in this study ranged from (26.40 ± 3.00 to 27.50 ± 0.20 °C), a high-temperature value was recorded at DS 600 m, which may be because of waterfall elevation beneath the cross road bridge. All the values recorded for temperature values were within DPR permissible limit of 30°C. The temperature values recorded in this study were higher than those of Abiodun et al. (Citation2017) who reported 19.00 ± 0.01 for surface water of similar site in Eastern Cape Town South Africa. Electrical conductivity (EC) is the ability of a solution to conduct electricity, which is related to the ions concentration, temperature, and total dissolved solids in the water body (Gupta et al., Citation2013). It roughly indicates the mineral content of the water and could be extremely higher in polluted water or any water body that receives a large quantity of urban run-off (Chapman, Citation1996). It is usually higher in salty water than fresh water (United Nations Environment Programme Global Environment Monitoring System/Water Programme [UNEPGEMS], Citation2008). The EC values in this study ranged from 253 ± 8.00 to 351 ± 7.00 µS/cm. The highest EC value (351 ± 7.00 µS/cm) was recorded at the point source while the lowest value (253 ± 8.00 µS/cm) was recorded at the control site. The EC has a linear relationship with TDS as the higher the TDS the higher was the EC. The EC values reported in this study were below WHO limit of 1000 µS/cm. EC values recorded in this study were however higher than that reported by Abiodun et al. (Citation2017). TDS values ranged from 124 ± 5.00 to 174 ± 11.00 mg/L and it is the measure of the sum of all organic and inorganic substances in a liquid, in molecular, ionized or micro-granular colloidal suspended form. The TDS values reported in this study were within the WHO permissible limit of 600 mg/L.
The acidity values for this study ranged from 2.00 ± 0.02 mg/L to 21.00 ± 5.00 mg/L. The highest value of acidity was recorded at DS 400 m while the lowest was recorded at DS 200 m. A significant (P ≤ 0.05) difference was observed between the mean acidity values for each sampling point. The high values of acidity may be as a result of acidic gases in solution which are released during spillage of petroleum products in the vicinity of the depot and also run-off from surrounding community. The acidity values reported in this study at some of the sampling points were higher than the World Health Organization WHO (Citation2011) limit of 4, while at DS 200 m was lower than the limit. Alkalinity is a measure of rivers buffering capacity or its ability to neutralize acids. Alkalinity comes from rock and soils, salts, certain plant activities and certain industrial waste water discharge. The alkalinity values ranged from 0.8 ± 0.01 mg/L to 15.00 ± 5.00 mg/L with the highest value recorded in control sample as 15.00 ± 5.0 mg/L. This may be from water sheds, domestic or industrial release around the vicinity. The alkalinity values for this study were below acceptable limit of 30–50 mg/L. High alkalinity values have a greater resistance to changes in pH. Ajibare (Citation2014) reported the acid and alkaline death points as 4.0 and 11.0 mg/l, respectively, which were below the values reported in this study. The chemical oxygen demand (COD) values recorded in this study ranged from 20.10 ± 8.00 to 55.20 ± 7.00 which was below WHO tolerance limit of 200 mg/L. Chemical oxygen demand is a measure of organic contamination in water. It is the amount of dissolved oxygen required to cause chemical oxidation of the organic material in water and is a key indicator of the environmental health of surface water. Chemical oxygen demand is a measure of both organic and inorganic agents competing for DO in water. Mean values of nitrate in this study ranged from 1.72 ± 0.05–5.89 ± 0.01, which was far below the WHO tolerance limits of 50 mg/L. The values of nitrate in this study were below that reported by Olayinka et al. (Citation2018) who worked on water samples around Atlas cove, Lagos, Nigeria. Phosphate values ranged from 5.35 ± 0.67 to 12.03 ± 0.08 mg/L. The phosphate values obtained in this study varied between the sampling sites, with the highest value observed at UPS 200 m. Phosphate values obtained in this study were higher than the WHO permissible limit of < 5 mg/l.
10. Concentrations of aliphatic and source identification
A total of thirty-three aliphatic hydrocarbons was detected in the surface water samples and ranged from C8 to C40 (Table ). The total concentration of aliphatic hydrocarbons ranged from 3.11 ± 0.93 to 1,500 ± 255 ng/L. This concentration was lower compared to report of Nazik et al. (Citation2015) who recorded oil content along Suez Gulf as 4105 to 24,664 ng/L and also Shereet (Citation2009) who reported concentration as 14,550 to 65,046 ng/L and mean of 28,660 ng/L. The total concentration at the outlet in this study was 1,458 ng/L, and lower than Nazik et al. (Citation2015) who reported concentration ranged from 5577 to 2365 ng/L at the outlet. For the individual aliphatic compounds C20 (n-eicosane) had highest concentration (118 ± 14.64 ng/L) which was recorded at DS800 m, while C12 (dodecane) had lowest concentration (0.01 ± 0.00ng/L) at control site. The total concentrations obtained in this study were lower compared to Abiodun et al. (Citation2017) who reported higher concentrations (45.07 to 273 µg/L). Generally, the higher molecular weight alkanes were more abundant than low molecular weight ones. In addition, the even numbered aliphatic hydrocarbons (C18-C22) which is an indication of anthropogenic input were higher in concentration than their odd-numbered (C15-C19) counterparts. The presence of lower molecular weight aliphatic hydrocarbon shows the freshness of hydrocarbon in the environment while the higher molecular suggest aged petroleum hydrocarbon of combustion origin (Ahmed et al., Citation2015; Sakari et al., Citation2012). Moreover, the dominance of some specific even-numbered hydrocarbons (C16, C18 and C20) over the odd numbers (nC15, nC17 and nC19) in the sampling sites indicates anthropogenic source pollution.
Table 3. Concentration of aliphatic hydrocarbons in surface water samples (ng/L)
Total mean concentrations recorded for C8 to C40 in this study ranged from 0.10 ± 0.03 to 45.45 ± 7.74 ng/L. The highest concentration (1,500 ± 255 ng/L) was recorded at DS 800 m and the lowest (3.11ng/L) was found in control sample. The highest concentration in DS800 m may be as a result of high retention of petroleum products as oil shin was observed at the point during sampling. There was no correlation between the distance away from the point source and the concentrations detected. It is generally stated that water could be considered polluted when the hydrocarbon concentration is higher than 2.0 µg/L (Keizer & Gordon, Citation1973). The concentrations reported in this study were below 2. 0 µg/L, therefore the surface water within NNPC Apata depot and its vicinity can be said not to be polluted.
11. Concentrations of polycyclic aromatic hydrocarbons (PAHs) in water
The concentrations of PAHs in water samples are presented in Table . Fifteen (15) out of sixteen (16) listed priority pollutant by the USEPA were detected in the water samples such as naphthalene, anthracene, acenapthylene, acenaphthene, phenanthrene, fluorene, pyrene, indeno-1,2,3-cd pyrene, fluoranthene, benzo (a) anthracene, chrysene, benzo(a)pyrene, benzo(g,h,i)perylene, dibenzo (a,h) anthracene, benzo(b)flouranthene. Benzo (k) flouranthene was not detected in any sample. Seven (7) out of eight (8) classified carcinogenic PAHs by USEPA were detected in the water samples. It was observed that both low molecular weight (LMW) and high molecular weight (HMW) PAHs were present in the samples. The concentrations of LMW PAHs were higher than HMW PAHs. The concentrations of PAHs reported in this study were lower than the WHO limit of 50 ng/L for surface and coastal water at some of the sampling points (UPS 200 m and DS 800 m) but higher than WHO limit at the other sampling points; PS, DS 200 m, DS 400 m, DS 600 m which were 52.33, 61.53, 68.25, 143 ng/L, respectively. Phenanthrene had highest concentration (128 ± 15.84 ng/L) in all the PAH congeners across the sampling points.
Table 4. PAH concentrations in surface water samples of NNPC Apata Depot (ng/L)
The concentration of single and total PAHs in this study ranged from not detected–38.07 ng/L and 0.27–135 ng/L which were lower compared with Karyab et al. (Citation2013) who reported the range of concentrations for single and total PAHs as 2.01–38.96 and 32.45–733.10 ng/L, respectively, in drinking water of Tehran, Iran. The concentration of PAHs that are probable human carcinogens according to the US Environmental Protection Agency (USEPA) (Citation2002), were detected in most samples. No PAHs congeners were detected in control sample. All carcinogenic PAHs in each sampling point were added up and the concentration of carcinogenic PAHs ranged from 0.60 ± 0.02 to 40.96 ± 6.31 ng/L. The allowable level of PAHs in European Union’s (EU, Citation1998) drinking water standard is 10 ng/L for BaP and (100ng/L) for carcinogenic PAHs. The concentrations recorded in this study were lower than the EU admissible limit.
12. Total petroleum hydrocarbon
TPHs are the summation of both PAHs and aliphatic hydrocarbons in a sample media (Table ). TPH concentrations ranged from 27.92 ± 0.65 to 1528 ± 258 ng/L and mean concentrations ranged from 0.58 ± 0.01 to 31.85 ± 5.38 ng/L. The mean concentrations of TPH obtained in this study were lower than that of Adewuyi and Olowu (Citation2012) who recorded TPH concentrations as 13.18 ± 1.79 to 27.40 ± 2.21 mg/L on the same study site. TPH concentrations observed in this study were lower than Abiodun et al. (Citation2017) who reported a general TPH concentration ranging from 45.07 to 273 µg/L in surface water of East Cape, South Africa. Adewuyi et al. (Citation2011) reported the mean concentration of total petroleum hydrocarbons in surface water as 73.5 ± 4.8 mg/L, which was higher than the reported concentrations in this study. Suratman (Citation2013) reported the concentration of TPH on the surface river water ranged from 2.0 to 40.8 µg/L (mean 12.9 ± 8.8 µg/L). This was higher than the concentrations reported in this study. There was no consistency observed in the concentrations of TPH from all the sampling points, the highest concentration was observed at DS 800 m and it may be due to low flow rate at the point while the lowest concentration was at UPS 800 m. The detected TPH in this study site could be from washing tank and accidental discharge of petroleum products. Although Abiodun et al. (Citation2017) mentioned a target value for TPH not exceeding 7 µg/L. Department of Petroleum Resources (DPR) (Citation2002) sets its TPH permissible limit in water at 10 mg/L. TPH limit for both drinking water and wastewater discharge is 0.5 mg/L (Sakroon, Citation2008) while the EPA 418.1 TPH limit is 0.5 mg/L in water. The maximum threshold value by the US Environmental Quality Department of Wyoming is 1 mg/L. The concentrations obtained in this study were below the limits. This may be because of proper site cleaning or hydrological impact since the samples were collected during wet season.
Table 5. Total petroleum hydrocarbon concentrations in surface water samples (ng/L)
13. Health risk assessment
Table also shows the cancer risk for adults and children in water. Chronic Daily intake (CDI) of benzo (a) pyrene and indeno (1, 2, 3-cd) pyrene exposure doses through ingestion and their carcinogenic risk were calculated. For ingestion, the CDI calculated for benzo (a) pyrene across the sampling points in adults ranged from 9.04 E-9 to 2.24 E-7 mg/kg/day while in children it ranged from 3.45 E-8 to 1.10 E-6 mg/kg/day. The values for indeno (1,2,3 cd) pyrene in adults ranged from 8.51E- 9 to 4.88 E − 8 mg/kg/day and in children it ranged from 4.18 E − 8 to 2.40 E-7 mg/kg/day. CR in adult ranged from 1.61 E-8 to 5.15 E-7 and in children it ranged from 7.94 E-8 to 2.53 E-6 which follows the same pattern with the values calculated for Indeno(1,2,3-cd) pyrene for both adults and children. From the results obtained, it was shown that the values for ingestion and CR calculated for both benzo (a) pyrene and indeno (1, 2, 3-cd) pyrene for adults and children were below the USEPA acceptable cancer risk which ranged from 1x10⁻⁶–10−4. HQ in adult ranged from 3.13 E-5 to 7.46 E-4 and in children, it ranged from 7.27 E-4 to 3.67 E-3for benzo (a) pyrene. The individual value of HQ and sum of HQ or HI for both benzo (a) pyrene and indeno (1, 2, 3-cd) pyrene were less than the safe limit of 1.0 indicating no adverse health effects.
Table 6. Carcinogenic risk for adults and children (benzo (a) pyrene and indeno (1, 2, 3 cd) pyrene)
14. Conclusion
This study revealed that there has been improvement in the control of oil spill from NNPC Depot, Apata into the surface water compared with previous study carried out on the same site some years ago. The values of some of the physicochemical parameters obtained in this study were below WHO limit except acidity and phosphate. TPH concentrations in this study were lower than permissible values of some regulatory bodies (DPR, EU, WHO, EPA) which could be due to oxidation and volatilization. This concentration may increase with time if not monitored. PAHs carcinogenic risk in water was lower than the USEPA standard; therefore, the water may not have carcinogenic effect. There is a need for the NNPC depot to maintain a low level of oil spillage and reduce the fuel pollution in the area through appropriate operations.
Additional information
Funding
Notes on contributors
O.O. Olayinka
O.O. Olayinka, Oluwafunmilayo O. obtained B.Sc in Chemistry (1996) from Ondo State University Ado-Ekiti, Ekiti State, Nigeria now Ekiti –State University, Masters in Analytical Chemistry (1999) and PhD in Industrial Chemistry (2010), both from University of Ibadan, Nigeria.
O.H. Adedeji
O.H. Adedeji obtained his Masters in Geography (1998) and PhD in (Biogeography) (2008) both from University of Ibadan, Nigeria. He also obtained a Post Graduate Diploma (Natural Resources Management) from Faculty of Geo-Information Science and Earth Observation (ITC), University of Twente, Enschede, the Netherlands.
S. A Ahmed
S. A Ahmed had HND in Chemical Engineering (2014) from Kaduna Polytechnic, Kaduna State, Nigeria and B.EMT (2019) in Environmental Management and Toxicology from Federal University of Agriculture, Abeokuta, Nigeria.
References
- Abiodun, O. A., Omobola, O. O., & Anthony, I. O. (2017). Petroleum hydrocarbon profiles of water and sediment of Algoa bay, Eastern Cape, South Africa. International Journal of Environmental Research and Public Health, 14(1263), 1–19. DOI: 10.3390/ijerph14101263
- Adeniji, A. O., Okoh, O. O., & Okoh, A. I. (2018). Analytical methods for polycyclic aromatic hydrocarbons and their global trend of distribution in water and sediment: A review. In M. E.-S. Abdul-Raouf Ed., Recent insights in petroleum science and engineering. ISBN:978-953-51-5321-4. https://doi.org/10.5772/intechopen.7116
- Adeniji, A. O., Okoh, O. O., & Okoh, A. I. (2017). Analytical methods for the determination of the distribution of total petroleum hydrocarbons in the water and sediment of aquatic systems. A Rev J Chem, 5178937. https://doi.org/10.1155/2017/5178937
- Adeniji, A. O., Okoh, O. O., & Okoh, A. I. (2019). Distribution pattern and health risk assessment of polycyclic aromatic hydrocarbons in the water and sediment of Algoa Bay, South Africa. Environmental Geochemistry and Health, 41(3), 1303–1320. https://doi.org/10.1007/s10653-018-0213-x
- Adewuyi, G. O., Etchie, O. T., & Ademulegun, O. T. (2011). Determination of total petroleum hydrocarbons and heavy metals in surface water and sediment of Ubeji River, Warri, Nigeria. Biorem, Biodiv and Bioavail, 5(1), 46–51.
- Adewuyi, G. O., & Olowu, R. A. (2012). Assessment of oil and grease, total petroleum hydrocarbons and some heavy metals in surface and ground water within the vicinity of NNPC oil depot in Apata, Ibadan metropolis, Nigeria. International Journal of Research and Reviews in Applied Sciences, 13(1), 166–174.
- Agency for Toxic Substances & Disease Registry (ATSDR). (2018). Toxic substances portal – Total petroleum hydrocarbons (TPH). Toxicological profile for total petroleum hydrocarbons. Retrieved March 6, 2020, from https://www.atsdr.cdc.gov/ToxProfiles/TP.asp?id=424&tid=75#bookmark10
- Agency for Toxic Substances and Disease Registry (ATSDR). (1999). Total Petroleum Hydrocarbons (TPH). U.S. Department of Health and Human Services, Public Health Service.
- Ahmed, O. E., Ali, N. A., Mahmoud, S. A., & Doheim, M. M. (2014). Environmental assessment of contamination by petroleum hydrocarbons in the aquatic species of Suez Gulf. International Journal of Organic Chemistry, 3, 1–17.
- Ahmed, O. E., Mahmoud, S. A., & Mousa, A. E. (2015). Aliphatic and Polyaromatic hydrocarbon pollution at the drainage basin of Suez oil refinery company. Current Science International, 4(1), 27–44.
- Ajibare, A. O. (2014). Assessment of Physico-Chemical Parameters of Waters in Ilaje Local Government Area of Ondo State. Nigeria. International Journal of Fisheries and Aquatic Studies, 1(5), 84–92.
- Akinola, J. O., Olawusi-Peters, O. O., & Akpambang, V. O. E. (2019). Ecological hazards of Total petroleum hydrocarbon in brackish water white Shrimp Nematopalaemon hastatus (AURIVILLUS 1898). Egyptian Journal of Aquatic Research, 45(3), 205–210. https://doi.org/10.1016/j.ejar.2019.07.004
- American Standard Testing Method (ASTM). (2002). Standard guide for risk- based corrective action applied at petroleum release sites” E1739-95. ASTM Website (www.astm.org).
- American Standard Testing Method (ASTM). (2004). Standard guide for risk- based corrective action” applied at petroleum release sites” E2081-00. ASTM Website (www.astm.org).
- Aniefiok, E. I., Thomas, A. H., Clement, O. O., Ekpedeme, R. A., & Iniemem, J. I. (2018). Petroleum hydrocarbons contamination of surface water and groundwater in the Niger Delta Region of Nigeria. Journal of Environment Pollution and Human Health, 6(2), 51–61. https://doi.org/10.12691/jephh-6-2-2
- APHA. (2005). Standard methods for the examination of water and wastewater. American public health association.
- Bahadar, H., Mostafalou, S., & Abdollahi, M. (2014). Current understandings and perspectives on non –cancer health effects of benzene: A global concern. Toxicology and Applied Pharmacology, 276(2), 83–94. https://doi.org/10.1016/j.taap.2014.02.012
- Brazkova, M., & Krastanov, A. (2013). Polycyclic aromatic hydrocarbons: Sources, effects and biodegradation. Hayчни Tpyдoвe Ha Pyceнcкия Унивepcитeт, Toм, 10(2), 1–5.
- Chapman, D., Ed. (1996). Water quality assessments- a guide to use of biota, sediments and water in environmental monitoring (2nd ed). E&FN Spon
- Imaobong, E.D. and Prince, J.N. (2016). Total Petroleum hydrocarbon concentration in surface water of Cross River Estuary, Niger Delta, Nigeria. Asian Journal of Environment & Ecology 1(2), 1–7. DOI: 10.9734/AJEE/2016/31102
- Daniel, I. E., & Nna, P. J. (2016). Total petroleum hydrocarbon concentration in surface water of cross river Estuary, Niger Delta, Nigeria. Asian Journal of Environment & Ecology, 1(2), 1–7. https://doi.org/10.9734/AJEE/2016/31102
- Das, N., & Chandran, P. (2011). Microbial degradation of petroleum hydrocarbon contaminants: An overview. Biotechnology Research International, 1–13.
- Department of Petroleum Resources (DPR). (2002). EGASPIN soil/sediment target and intervention values for mineral oil (or TPH), environmental guidelines and standards for the petroleum industry in Nigeria. (Revised ed.). The Petroleum Regulatory Agency of Nigeria.
- Edokpayi, J. N., Odiyo, J. O., Popoola, O. E., & Msagati, T. A. M. (2016). Determination and distribution of polycyclic aromatic hydrocarbons in rivers, sediments and wastewater effluents in Vhembe District, South Africa. International Journal of Environmental Research and Public Health, 13(4), 387. https://doi.org/10.3390/ijerph13040387
- EU – European Communities, (1998). The quality of water intended for human consumption. Official Journal of the European Communities. Council Directive 98/83/EC. http://www.fsai.ie/uploadedfiles/Legislation/Food_Legislation_Links/Water/EU_Directive_98_83_EC.pdf
- Gay, J., Shepherd, O., Thyden, M., & Whitman, M. (2010). The health effects of oil contamination: A compilation of research. Worcester Polytechnic Institute.
- Guerriero, V., Vitale, S., Ciarcia, S., & Mazzoli, S. (2011). Improved statistical multi-scale analysis of fractured reservoir analogues. Tectonophysics (Elsevier), 504(1–4), 14–24. https://doi.org/10.1016/j.tecto.2011.01.003
- Guo, W., He, M., Yang, Z., Lin, C., & Quan, X. (2011). Aliphatic and polycyclic aromatic hydrocarbons in the Xihe River, an urban river in China’s Shenyang city: Distribution and risk assessment. Journal of Hazardous Materials, 186(2–3), 1193–1199. https://doi.org/10.1016/j.jhazmat.2010.11.122
- Gupta, N., Yadav, K. K., Kumar, V., & Singh, D. (2013). Assessment of physicochemical properties of Yamuna River in Agra City. International Journal of ChemTech Research, 5, 528–531.
- Interstate Technology & Regulatory Council (ITRC). (2018). TPH risk evaluation at petroleum-contaminated sites. THPRisk-1. Interstate Technology & Regulatory Council, TPH Risk Evaluation Team. https://tphrisk-1.itrcweb.org
- Kansas Department of Health and Environment (KDHE). (2015). Kansas method for the determination of mid-range hydrocarbons (MRH) and High Range Hydrocarbons (HRH). Kansas Department of Health and Environment (KDHE). Revision 1.0. Kansas.
- Karyab, H., Yunesia, M., Mahvi, A. N., Ahmadkhaniha, R., Rastkari, N., & Nabizadeh, R. (2013). Polycyclic aromatic hydrocarbons in drinking water of Tehran, Iran. Journal of Environmental Health Science and Engineering, 11(1), 25. https://doi.org/10.1186/2052–336X-11-25
- Keizer, P. D., & Gordon, D. C. (1973). Detection of trace amounts of oil in seawater by Fluorescence spectroscopy. Journal of the Fisheries Research Board of Canada, 30(8), 1039–1045. https://doi.org/10.1139/f73-175
- Macaulay, M. B., & Rees, D. (2014). Bioremediation of oil spills: A review of challenges for research advancement. Annals of Environmental Science, 8, 9–37.
- Nazik, A. F., Sawsan, A. M., & Omayma, E. A. (2015). Occurrence and distribution of aliphatic and polycyclic aromatic hydrocarbons in surface waters along coastal area of Suez Gulf. Egyptian Petroleum Research Institute, Nasr City, Cairo, Egypt. Egyptian Journal of Chemistry, 58(1), 43–69.
- Ogeleka, D. F., Edjere, O., Nwudu, A., & Okieimen, F. E. (2016). Ecological effects of oil spill on pelagic and bottom-dwelling organisms in the riverine areas of Odidi and Egwa in Warri. Journal of Ecology and the Natural Environment, 8(12), 201–211. https://doi.org/10.5897/JENE2016.0593
- Olayinka, O. O., Adewusi, A. A., Olujimi, O. O., & Adesida, A. A. (2018). Concentration of polycyclic aromatic hydrocarbons and estimated health risk of water samples around Atlas cove, Lagos, Nigeria. The Journal of Health and Pollution, 8(20), 1–17.
- Olayinka, O. O., Adewusi, A. A., Olujimi, O. O., & Adesida, A. A. (2019). Polycyclic Aromatic hydrocarbons in sediment and health risk of fish, crab and shrimp around Atlas Cove, Nigeria. The Journal of Health and Pollution, 9(24), 1–21.
- Özdemir, A. (2018). Usage of TPH (total petroleum hydrocarbons) in water analysis for oil and gas exploration: First important results from Turkey. Journal of Engineering Sciences and Design, 6(4), 615–636. http://dergipark.gov.tr/jesd
- Park, I. S., & Park, J. W. (2011). Determination of a risk management primer at petroleum-contaminated sites: Developing new human health risk assessment strategy. Journal of Hazardous Materials, 185(2–3), 1374–1380. https://doi.org/10.1016/j.jhazmat.2010.10.058
- Quevenco, R. (2011). Sustainable growth of coastal waters: A profile of the history and levels of coastal pollution in the Caribbean emerges. IAEA Bulletin, 53(1), 32–37.
- Sakari, M., Ting, L. S., Houng, L. Y., Lim, S. K., Tahir, R., Adnan, F. A. F., Alj, Y., Soon, Z. Y., Hsia, B. S., & Shah, M. D. (2012). Urban effluent discharge in to rivers: Aforensic chemistry approach to evaluate the environmental deterioration. World Applied Science Journal, 20(9), 1227–1235.
- Sakroon, S. A. (2008). Effect of oil field brine on groundwater quality in Marmul area [MSc. Thesis]. Sultanate of Oman. United Arab Emirates University. p. 146.
- Sanches, P. J., Filho, P. J., Ohm, E. M. B., Ohm, G. M. B., Montenegro, G. O., Silveira, L. A., & Betemps, G. R. (2017). Determination of hydrocarbons transported by urban runoff in sediments of Säo Gonçalo Channel (Pelotas—RS, Brazil). Marine Pollution Bulletin, 114(2), 1088–1095. https://doi.org/10.1016/j.marpolbul.2016.10.024
- Sari, G. L., Trihadiningrum, Y., & Ni′matuzahroh. (2018). Petroleum hydrocarbon pollution in soil and surface water by public oil fields in Wonocolo Sub-district, Indonesia. Journal of Ecological Engineering, 19(2), 184–193. https://doi.org/10.12911/22998993/82800
- Shereet, S. M. (2009). Pollution of petroleum hydrocarbon in the new Damietta harbor, Egypt, Emirates. Journal of Engineering Research, 14(1), 65–71.
- Stout, S. A., Uhler, A. D., & Emsbo-Mattingly, S. D. (2004). Comparative evaluation of background anthropogenic hydrocarbons in surficial sediments from nine urban waterways. Environmental Science & Technology, 38(11), 2987–2994. https://doi.org/10.1021/es040327q
- Strelitz, J., Engel, L. S., Kwok, R. K., Miller, A. K., Blair, A., & Sandler, D. P. (2018). Deepwater Horizon oil spill exposures and nonfatal myocardial infarction in the Gulf study. Environmental Health, 17(1), 69. https://doi.org/10.1186/s12940-018-0408-8
- Suratman, S. (2013). Distribution of total petrogenic hydrocarbon in Dungun River Basin, Malaysia. Oriental Journal Of Chemistry, 29(1), 77–80. https://doi.org/10.13005/ojc/290112
- Tomlinson, P., & Michael, V. R. (2016). State and federal cleanup levels for petroleum hydrocarbons in soil: State of the states and implications for the future. Human and Ecological Risk Assessment: An International Journal No, 22(4), 911–926. https://doi.org/10.1080/10807039.2015.1120151
- United Nations Environment Programme Global Environment Monitoring System/Water Programme (UNEPGEMS). (2008). Water quality for ecosystem and human health. (2nd ed.). UNEPGEMS.
- United States Department of Health and Human Services (USDHHS). (1999). Toxicology profile for total petroleum hydrocarbons (TPH). Public Health Service Agency for Toxic Substances and Disease Registry.
- US Environmental Protection Agency (USEPA). (1989). Risk assessment guidance for superfund. Vol. 1, Human health evaluation manual (part A) [Internet]. United States Environmental Protection Agency. Retrieved July 2017, from http://rais.ornl.gov/documents/HHEMA. pdf
- US Environmental Protection Agency (USEPA). (2001). Risk assessment guidance for superfund: Process for conducting probabilistic risk assessment (Part A); EPA 540-R-02-002 (Vol. 3). Washington DC, US: Environmental Protection Agency.
- US Environmental Protection Agency (USEPA). (2002). Integrated risk information system (IRIS) database. US environmental protection agency. National Center for Environmental Assessment.
- US Environmental Protection Agency (USEPA). (2011). Exposure factors handbook 2011 edition (final) [Internet]. United States Environmental Protection Agency. Retrieved October 22, 2018, from https://cfpub.epa.gov/ncea/risk/recordisplay.cfm?deid=236252.
- Uyom, U. U., Ama, O. K., & Ephraim, N. I. (2014). Some physical and chemical characteristics of Akpa Yafe River, Bakassi, Cross River State, Nigeria. Journal of Indian Academy, 2(11), 631–637.
- Uzoekwe, S. A., & Oghosanine, F. A. (2011). The effect of refinery and petrochemical effluent on water quality of Ubeji creek Warri, Southern Nigeria. Ethio J Environ Stud Man, 4(2), 107–116.
- World Health Organization WHO. (2011). Guidelines for drinking-water quality [Internet]. (4th ed.). http://www.who.int/water_sanitation_health/publications/2011/dwq_guidelines/en/
- Zaghden, H., Kallel, M., Louati, A., Elleuch, B., Oudot, J., & Saliot, A. (2005). Hydrocarbons in surface sediments from the Sfax coastal zone, (Tunisia) Mediterranean Sea. Marine Pollution Bulletin, 50(11), 1287–1294. https://doi.org/10.1016/j.marpolbul.2005.04.045
- Zrafi, I., Hizem, L., Chalghmi, H., Ghrabi, A., Rouabhia, M., & Saidane-Mosbahi, D. (2013). Aliphatic and aromatic biomarkers for petroleum hydrocarbon investigation in marine sediment. Journal of Petroleum Science Research, 2(4), 145–155.