
 ?Mathematical formulae have been encoded as MathML and are displayed in this HTML version using MathJax in order to improve their display. Uncheck the box to turn MathJax off. This feature requires Javascript. Click on a formula to zoom.
Abstract
Forest is one of the vital resources that determine the livelihood, environmental stability, and societal development. Duguna Fango is biologically diverse and deeply threatened in the region. The area has undergone extensive environmental changes since 1980s due to shifting cultivation, deforestation, urbanization, growing human population and drought. Thus, this research was conducted to investigate the status of forest change and degradation by using available satellite imageries at Duguna Fango Woreda. It was based on the corrected optical satellite data (Landsat 7 ETM of 2000, 2009, and Landsat 8 OLI/TIRS of 2018); available from the Global Land Cover Facility acquired in the drier seasons of the years was used for forest cover change analysis. Besides, normalized difference vegetation index (NDVI) indicators like (NDVI minimum, maximum, mean, and standard deviation) were also computed for the year 2000, 2009 and 2018 to determine the density of vegetation. The results showed in the period between 2000 and 2018, built up and cultivated lands increased with a mean annual rate of 92.18 and 366.96 ha/year, respectively. Followed by the reduction in dense forest with the mean annual rate of −228.27 ha/year. The NDVI minimum value showed a slight reduction from −0.09 in the year 2009 to −0.11 in the year 2018. The mean values are also decreased from 0.29 in 2009 to 0.16 in 2018. As indicated in the result of NDVI value, despite there is restoration, vegetation cover in general was reduced and the forests in particular were depleted from time to time.
PUBLIC INTEREST STATEMENT
This study investigated the status of the forest ecosystem and degradation levels in Duguna Fango, Southern Ethiopia. The study area has diverse agro-ecology and forest resources that have various economic, social, and environmental values to the society. Forests are a multiple-use resource where economic and ecological goals can be achieved but the potential roles that the forest sector plays in poverty alleviation that remains poorly understood in the area. Besides, forests are critical to the daily survival of thousands of people in the study area context. The study has found as there was a continuous forest cover change taken place for the last two decades. Multi-faceted demands have a profound effect on vegetation density and land use changes. Therefore, Forest ecosystems warrant special attention since they are hosting a large fraction of biodiversity and are under particular threats e.g., conversion into built up and cultivated land, unsustainable logging practices and deforestation.
1. Introduction
The recent data on forest resources of Ethiopia reported in FAO (Citation2016) puts Ethiopia among countries with forest cover of 10 to 30%. When compared to Ethiopia’s overall economy, the economic contribution of the forestry sector was 11.60% of the country’s total GDP in 1995 and 9.0 % in 2005. Its economic contribution including watershed services was 27.5% in 1995 and 18.8 % in 2005 as reported by Moges et al., Citation2010 and Sisay et al., Citation2009. Though natural resources in Ethiopia have great potential for socio-economic development, most natural resources are highly exposed to degradation (Demel, Citation2001).
The country’s forest coverage is estimated to be 40% over a century ago and to less than 12% (Gashaw et al., Citation2014); and according to FAO report (FRA (FAO), Citation2015), Ethiopia’s forest cover was 12.4 million hectares (11.5%). Natural resource degradation in Ethiopia has been going on for centuries (Zeleke & Hurni, Citation2001). FAO (Citation2010) estimates that 141,000 ha of forest have been lost annually between 1990 and 2010 and the average annual deforestation rate, based on forest cover change from 2005 to 2010, amounts to 1.11% of total forest cover. With regardless of local and global socioeconomic and environmental value of forest, forest resource is nationally dwindling due to different agents of deforestation and forest degradation. Forest resources in Ethiopia have experienced so much pressure due to increasing need for wood products and conversion to agriculture. According to Abera et al. (Citation2019), in Ethiopia, the cultivated area has increased from 9.44 million hectares in 2001 to 15.4 million hectares in 2009 alone, i.e., 6 million ha in 8 years. In view of resource degradation, FAO (Citation2003), Aklilu et al. (Citation2019), Yitebitu, (Citation2010), Alemu and Abebe (Citation2011), Gessesse and Christiansson (Citation2008), and Million (Citation2011) argued that Ethiopians are facing rapid deforestation and land degradation that has been fueled by increasing population which in turn resulted in extensive forest clearing for agriculture, overgrazing, exploitation of prevailing forests for fuel wood, fodder, and construction materials, setting of fire to create pasture land and expansion of settlements.
Recent watershed-based LULC studies in Ethiopia showed that land cover change is brutal and there has been agricultural land expansion at the expense of natural vegetation cover, while marginal areas are inappropriately utilized (Gessesse & Kleman, Citation2007; Temesgen et al., Citation2014). Tesfahun and Temesgen (Citation2014) have analyzed the effect of land use land cover change of East of Lake Tana; and concluded that soil erosion and land degraded was aggravated as the result of agricultural land expansion on steep slopes of forest, shrub, and grazing land. The land-use change from forest cover to bare land, grassland, and crop land can occur with accessibility forests to the users (Lee et al., Citation2019). On the other hand, lack of incentive-based policies brings affects the conservation interest of the forest residents and can act as driver of deforestation (Conceicao et al., Citation2018).
Duguna Fango was covering a diversified forest on communal and privately owned lands before the current status reached up due to deforestation and forest degradation. Consequently, failure in agricultural sector, i.e., animal and crop productivity and expansion of large portion of unproductive lands are becoming common problems of forest degradation in the area. Clearance for subsistence agriculture is the leading means of forests reduction in Ethiopia (Lemenih et al., Citation2008; Teketay et al., Citation2010), causing the loss of 65,540 ha of high forest, 91,400 ha of woodlands, and 76,400 ha of shrublands annually (Woody Biomass Inventory and Strategic Planning Project [WBISPP], Citation2004). Next to agriculture, forests are mainly used for fuel wood (firewood and charcoal) supply. Biomass is the major source of energy in the country in general and Duguna Fango in particular, accounting for 97% of the total domestic energy consumption, out of which woody biomass covers 78% (WBISPP, Citation2004). Although multifaceted driving factors are expected to be contributing to deforestation in the area, there is no sufficient empirical data available to clearly indicate the level of deforestation and forest degradation. A comprehensive assessment of forest resources in the country is so far made by WBISPP (Citation2004), which estimated an approximate annual loss with a rate of 2%. Similarly, global forest loss was estimated at 1.7% of deforestation from 1990 to 2005 as indicated in FAO (Citation2012). Consequently, the information gap on the degree of forest resource degradation affects the decision of intervention to reverse the worsening situation of forest loss in the Woreda (which is the third-level administrative division of Ethiopia).
Remote sensing data with sufficient spatial and high-resolution satellite datasets are worthful and reliable resources for forest cover mapping and monitoring (Lu et al., Citation2004). As a result, this study was intended to assess the trend of forest cover change and status of vegetation density by using satellite images and remote sensing. Thus, addressing the problems of deforestation and forest degradation will enhance ecosystem services that have knock‐on effect on other sectors such as energy and agriculture. Additionally, the demand for wood and non‐wood forest and tree products could also be satisfied. Besides, identifying the problems of forest cover change, degradation, and forest disturbance at different spatial and temporal scales could provide useful information for sustainable management of forests and fine-tune the interventions to bring change on the forest status of the area. In this context, we argue that satellite RS imagery represents a valuable and cost-effective tool which could be particularly useful in filling the gaps in the availability of data regarding Land Use, Land Use Change, and Forestry (LULUCF) activities IPCC (Citation2003) for different levels of data needs (Achard et al., Citation2008).
2. Materials and methods
2.1. Study area descriptions
Duguna Fango woreda is located 42 km east from the zonal city named Wolaita Sodo, and 73 km south west from Hawassa which is the capital of Southern Ethiopia; and 300 km South of Addis Ababa. It is part of the Wolaita Zone located on the western edge of Great Rift Valley. The woreda is bordered on the southwest by Damot Weyde, on the west by Damot Gale, on the north by the Hadiya Zone, on the northeast by the Oromia Region, and on the east by the Sidama Zone.
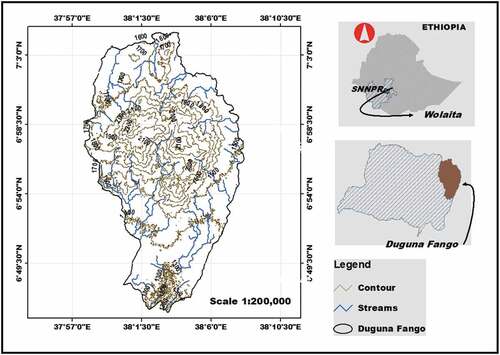
The woreda is known for its undulating topography and diversified features with mountains, valley, and plateau landforms. In terms of altitude, the woreda lies between 1,303 and 2,318 masl as indicated in the above contour map (Figure ). Agro-ecologically, the woreda is dominated by lowland with hot climate of 73% of the total area found within midland (moderate climate) and the rest 27% is highland (moderately cold climate) as point out by (Chernet, Citation2018). The mean annual temperatures of the woreda range from 19.8 to 28.5 °C and the average annual rainfall varies between 800 and 1200 mm (National Meteorological Service Agency [NMSA], Citation2018). The woreda has different land uses such as forest land, grazing land, cultivation, and settlement areas. Maize, wheat, barley, and teff are commonly grown rain-fed crops throughout the woreda. With a total population of 123,033 (61,656 females), the woreda covers a total of 46,660 ha of land and farm sizes are generally small and on average farmers cultivate about 0.5 ha per head (Central Statistical Agency [CSA], Citation2008).
Figure 1. Map of the Study area
2.2. Research methods
2.2.1. Data acquisitions, processing and analysis
In order to investigate spatiotemporal variation of forest cover, a three corrected Landsat series images, that provide data from 2000 Landsat5 TM (Thematic Mapper), 2009 Landsat7 ETM+ (Enhanced Thematic Mapper Plus), and 2018 Landsat8 with spatial resolution of 30 m was employed. Landsat imagery was chosen for the exercise because it is freely available for the time period and adapted to forest land cover detection (FAO, Citation2012); It will also likely be sustainably available in the future (GFOI, Citation2013). For the acquisition of optical satellite data for the study site, i.e., Southern Ethiopia, the months of March to December were considered to reduce the effects of cloud cover, i.e., a source of problem in the tropics. The image was preprocessed and classified by using supervised classification method with the support of unsupervised classification in ERDAS Imagine 2014 software. In preprocessing stage, radiometric and geometric corrections (Yohannes et al., Citation2017) were performed to correct and enhance the image spectral quality. During image preprocessing, image was also layer stacked and create a subset layer image classification was performed by collecting signatures from each class. To change the coordinate system from geographic coordinate system (Longitude/Latitude) to metric coordinate (UTM) system and before classification; both images were rectified using the Universal Transverse Mercator (UTM) map projection (Zone 37), World Geodetic System 1984 datum (WGS 84) co-ordinate system. Before mapping, the land use/land cover classes for the AOI were first defined by considering those included on the existing topographical maps, which are based on the International Institute of Tropical Forestry classification scheme. In order to distinguish forest cover of the site, land cover of the study area was categorized into six types; these are, degraded land, built up, bush land, cultivated land, dense forest, and sparse forest (). After the classification of LU classes the ground truth verification were carried out and the errors in it have been corrected to prepare the accurate forest cover maps. In addition, Normalized Difference Vegetation Index (NDVI) was calculated using bands 4 (infrared band) and band 3 (visible, i.e., red band) in Landsat 5 TM and 7 ETM+. Similarly, in Landsat8, bands 5 and 4 were used as NIR and RED, respectively.
2.2.2. Normalized difference vegetation index (NDVI)
The Normalized Difference Vegetation Index (NDVI) is an index of plant “greenness” or photosynthetic activity and is one of the most commonly used vegetation indices. Vegetation indices are based on the observation that different surfaces reflect different types of light differently. Photo synthetically active vegetation, in particular, absorbs most of the red light that hits it while reflecting much of the near infrared light. Vegetation that is dead or stressed reflects more red lights and less near infrared light. Likewise, non-vegetated surfaces have a much more even reflectance across the light spectrum.
NDVI is calculated on a per-pixel basis as the normalized difference between the red and near infrared bands from an image as:
Where; NIR is the near infrared band value for a cell and RED is the red band value for the cell. The result of equation varies between—1 and + 1, where negative values are representing other than vegetation and positive values are representing less vegetation to dense or healthy vegetation (John & David, Citation2000). Thus, NDVI for a given pixel always results in a number that ranges from minus one (−1) to plus one (+1); however, no green leaves gives a value close to zero. A zero means no vegetation and close to +1 (0.8–0.9) indicates the highest possible density of green leaves. Green and healthy vegetation reflects much less solar radiation in the visible compared to those in the near infrared. More importantly, when vegetation is under stress, the visible value may increase and the near infrared values may decrease. The NDVI were generated using the radiation measured in red and near infrared spectral channels. Because of close relationship between vegetation and available soil moisture, NDVI was widely used to evaluate drought conditions by directly comparing it to precipitation or drought indices. The data used in compiling the NDVIs are closely related to the radiation absorbed and reflected by vegetation in the photosynthetic processes as indicated in Baldi et al. (Citation2008).
2.2.3. Forest cover and change statistics
This study employed the Ethiopian forest definition and forest land cover is primarily classified into different suitable classes, including forest cover classes (i.e., high forests, woodlands, bamboo forests, dense-mixed forest, and sparse mixed forest). The transition from forest to non-forest is considered to be deforestation and dense forest to sparse forest was considered to be degradation Devries et al. (Citation2015). The change in forest cover classes was quantified using the output layers of land cover for three different years and cross tabulation between layers using the spatial analysis tool in ArcGIS. Changes other than forest are beyond the scope of the present work and were not extensively investigated.
2.2.4. Accuracy assessment
The accuracy of land cover maps () developed from Landsat images were assessed by comparing the land cover results with Google and topographical maps to improve the accuracy. While examining the observations possible via Google Earth, a simplified land cover with two classes of forest (i.e., Dense Forest and Sparse Forest) and other reference classes of land cover was compared at each grid centroid for validation. The overall accuracy of the land use maps for 2000, 2009, and 2018 was determined to be 90%, 83.33%, and 81.67%, respectively. The Kappa indices for each map were 0.88, 0.80, and 0.78, respectively. Land use classification accuracy was assessed following examples from Congalton and Green (Citation2009), and Olofsson et al. (Citation2013).
3. Result and discussion
3.1. The trends of forest cover change and degradation
Based on the research objectives, image spatial resolution, and field surveys; a modified version of the Anderson scheme (Anderson et al., Citation1976) was adopted. Accordingly, by using Landsat imageries of 2000, 2009 and 2018, six land use/cover classes comprising of built up area, cultivated land, bush land, degraded lands, dense forest (plantation) and sparse forest/light forest were classified.
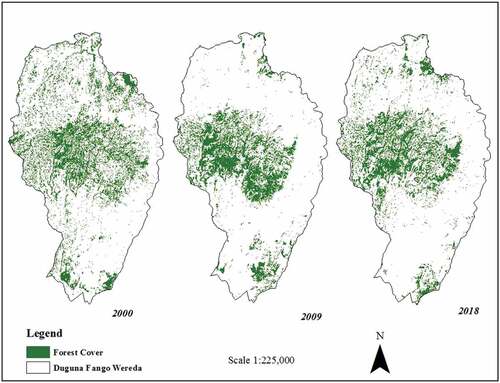
Although global forest loss in developing countries has slowed in recent years, different continents were characterized by different trends in forest coverage. In Duguna Fango, the forest area, i.e., the aggregate of dense and sparse during the study period in 2000 was about 7,963.38 hectares (19.83%), 2009 the coverage dropped to 7,381.35 hectares (18.38%) and in 2018 it considerably fallen into 4,812.12 hectares, which becomes 11.98% of the woreda’s total (Table and Figure ). Majority of the change were observed in down thrown of dense forest cover followed by sparse which have shown the increasing change.
Figure 2. Land use/cover maps of Duguna Fango in 2000, 2009 and 2018
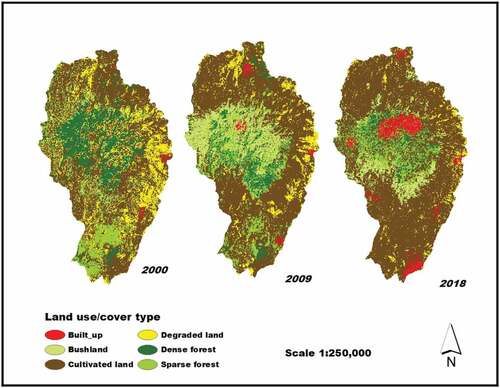
Table 1. Land use/land cover classification scheme
Table 2. Comparison of LULC types between 2000 and 2018 (Source: Computed from satellite imageries of 2000, 2009 and 2018)
As indicated in Table , in the period between 2000 and 2018, built up areas and cultivated lands increased with a mean annual rate of 92.18 and 366.96 ha/year, respectively. Followed by the reduction in dense forest with the mean annual rate of −228.27 ha/year. The reason for the depletion of forest cover occurred could be the destruction of natural forests for farm plots, settlement expansion, and construction materials. There was a continuous LULC change taken place for all classes in those 18 years which is in agreement with the study conducted by Barana (Citation2016) in adjacent watershed. As indicated in Table and Figure , in 2000 the share of forest cover was 2451.65 ha which was 6% but in 2018 the coverage dropped to 1714.69 ha which was 4% even exotic tree plantations and forest protection policies were emphasized. Consequently, the pattern showed a tendency towards more land being brought under cultivated land and settlement at the expense of dense forests.
Figure 3. Forest (Dense and Sparse) cover of the study area since 2000 to 2018
3.2. The status of forest cover density
For Landsat TM and ETM sensors band 4 is regarded as NIR and Band 3 regarded as RED. After successful production of NDVI maps unsupervised classification techniques were used to classify the resultant dataset. Isodata algorithms with Maximum literation 6 and Convergence Threshold 0.950 used to classify each Vegetation Differentiating image. Only positive values were taken in the count to classify each image. Higher positive values are classified as forested vegetation and values close to zero are classified as mix vegetation which might consist of agriculture, degraded land, or any other land cover feature. All the negative values including zero are classified with default legend and then ignored during presentation. Then, forested area was calculated from the classified image to see its aerial extent and trend of cover status (Figure ).
Figure 4. NDVI map of Duguna Fango Woreda for the years 2000, 2009 & 2018 from left to right
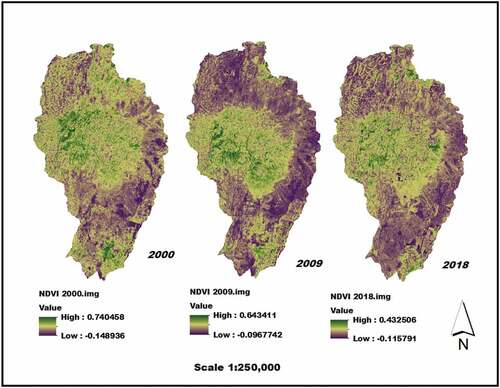
The darker the green color in the image the highest NDVI values were recorded and highest vegetation cover and vice versa. In the same way, the minimum values are increased from −0.15 in 2000 to −0.09 in 2009 (Table ). This means that status of vegetation in 2009 is better than the vegetation in 2000. We can observe the result as well in the map (Figure ) as dark green color. Despite, the NDVI value showed slight reduction from −0.09 in the year 2009 to −0.11 in the year 2018. The darker the brown color, the lower the NDVI value and the less the vegetation and vice versa. This comparison result shows that highest vegetation cover was observed in 2000, whereas average vegetation cover was observed in 2009 but the lowest coverage was observed in the year 2018.
Table 3. NDVI Statistics of 2000, 2009, and 2018 Satellite images
This comparison can be better explained by its mean and standard deviation of the two period images. The mean values are decreased from 0.29 in 2009 to 0.16 in 2018 (Table ). This means that the highest mean value of NDVI in the 2000 image showed that highest level of vegetation and the lowest mean value of NDVI in 2018 satellite image showed the lowest vegetation coverage. Hence, the status of vegetation cover was better in 2000 than 2018 satellite images in the study area. In the same way, the standard deviation of the NDVI value shows that there was a continuous decrease from 0.28 in 2000 to 0.21 in 2009 and 0.15 in the year 2018. This means that the status of vegetation change from its mean value of NDVI is varying more in the 2000 image when it is compared with that of 2009 and 2018 satellite image. Hence, the rate of vegetation change was average in 2018 satellite image than the change of vegetation in 2009 and 2000. The result of the NDVI values showed that the density of vegetation cover, in general, was reduced and the forests, in particular, were depleted from time to time and this inferred that there were continuous deforestation and forest degradation.
4. Discussion
The total dense forest area was 5966.46 ha during the year 2000 and it was 1857.51 ha in the year 2018 while 4,108.95 ha converted into any other land use classes. In case of sparse vegetation there has been observed increase of 957.69 ha over the period of 18 years whereas built-up areas and cultivated lands have expanded at a mean annual rate of 92.18 and 366.96 ha/year, respectively. The increment on sparse forest cover and bush land depicted in 2009 and 2018 may be mainly due to implementation of forest protection policies in the study site. Thus, the 94/1994 Bill, 542/2007 Bill, and the forest law issued in 2007 in Ethiopia all emphasized forest protection and forestry development; the programs have a significant effect on the forest restoration by reducing the forest clearing and transformation into agricultural land which is in agreement with the findings of Takahashi and Todo (Citation2013, Citation2017)). This result is also in agreement with studies like Qianwen and Minghong (Citation2019) stated that in several countries, the sparse forest area increased during the study period, with South Sudan and Ethiopia having the largest increases in forest area. Despite, it’s at infant stage, in the study area the situation has been recently supported by watershed management and reforestation activities. However, the pattern of the forest degradation based on the results of imagery processing and key informants suggest that human activities including increasing demand for farm plots; firewood and charcoal production, construction materials and settlement areas have resulted in loss of dense forests and other land use/cover of the area. In agreement to this finding, a significant loss of dense forest cover was reported by Alemu et al. (Citation2015) in Northwestern lowlands of Ethiopia during 1985–2010. Consistent with this result, study conducted by Aklilu et al. (Citation2020) in the same site, i.e., Duguna Fango by using regression analysis indicated that forest had a direct and indirect role in the community’s livelihood, the dependency on forest and forest products for both income generation and home consumption resulted in massive deforestation and forest degradation. This implies unless appropriate and immediate conservation measures are undertaken, the remaining forest resources of the woreda could lessen within a few years.
Evidently, the integrated effects of land use changes in the study area can lead to the highly variable response of rainfall and temperature over time. Thus, these findings are of great importance for environmental managers to make strategies to sustain forest ecosystems in the area. A sound plantation strategy should not only aim to increase forest biomass, but also recover the function of forests to ensure a stable climate in the area.
5. Conclusion
This study analyzed the trend of forest cover change and status of vegetation cover in Duguna Fango woreda of Southern Ethiopia. There have been dramatic decreases in dense forests to 68.86%, while built-up areas and cultivated lands have increased profoundly to 11.39% and 30.09%, respectively, during the study period. The results of NDVI analysis indicated that despite there is restoration and average increment in sparse forest area, vegetation cover in general was reduced and the dense forests in particular were depleted from time to time. In the present scenario deforestation is a global issue with many implications and large forest area is being encroached, resulted in the loss of overall environmental conditions including vegetation quality degradation and biodiversity loss. As a result, in aspiration to develop a sustainable forest management, degradation of any biological resource i.e. reduction in forest land in the current study area has to be managed with the participation of ultimate beneficiaries of the resources. It is not possible to properly manage a forest ecosystem without inculcated deep-rooted understanding by the land users. Therefore, the study suggests urgent attention on conservation of the remaining vegetation resources for sustainable utilization by mobilizing local community participation through enhancing awareness-raising program. Furthermore, strictly implementing the country’s forest policy, strengthening the customary law, and designing the forest restoration schemes without abruptly depriving the land users socioeconomic dependency is very urgent battle front in the study area. Lastly, research works, which integrate the use of GIS and remote sensing techniques with socio-economic data could provide useful baseline information to understand the patterns of change and driving forces so as to design effective management options and protect the remnant forest resources.
Author contributions
All authors conceived and designed the data analysis, contributed analysis tools, wrote and amended the paper.
Conflicts of interest
The authors declare no conflict of interest.
Cover Image
Source: Author.
Acknowledgements
The authors gratefully acknowledge support from Duguna Fango Woreda. We are also immensely grateful to communities and field assistants to access and collect field data. We hereby declare that all the information and statements made in this research are true and accept that any misinterpretation contained in it may be our obstructions.
Data availability statement
Data that support the findings of this study are available upon request through the corresponding author.
Additional information
Funding
Notes on contributors
Barana Babiso Badesso
Barana Babiso Badesso (B.B.B) has been a senior lecturer and researcher at Jigjiga and Wolaita Sodo University, Ethiopia from September, 2010 till now. He has a Bachelor’s degree in Geography and Environmental Studies and MSc in Natural Resource Management from Dilla University, Ethiopia. He is in charge of providing research, training and consultancy for farmers, experts in Southern Ethiopia for improving resource conservation in general and forest management in particular. Moreover, he has been conducting different researches in the sustainability studies in environmental and socio-economic aspects. Thus, this study was designed, directed, and coordinated by B.B.B., as principal investigator, analyzed the Remote sensing data, and provided technical guidance for all aspects of the project. Aklilu Bajigo Madalcho is an Assistant Professor of Agroforestry and soil science who contributed to the analysis of land use changes. Thus, the manuscript was written by two and commented on by Merkineh Mesene who is an Assistant Professor of Watershed management.
References
- Abera, D., Kibret, K., & Beyene, S. (2019). Tempo-spatial land use/cover change in Zeway, Ketar and Bulbula sub-basins, central rift valley of Ethiopia. Lakes & Reserv, 24(1), 76–12. https://doi.org/10.1111/lre.12240
- Achard, F., Grassi, G., Herold, M., Teobaldelli, M., & Mollicone, D. (2008, May). Use of satellite remote sensing in LULUCF sector (GOFC-GOLD Report No. 33). Global Observation of Forest and Land Cover Dynamics (GOFC-GOLD). p. 25. Retrieved May 12, 2020, from http://www.fao.org/gtos/gofc-gold
- Aklilu, B., Bekele, L., Merkineh, M., & Barana, B. (2019). Is the expansion of eucalyptus tree a curse or an opportunity? Implications from a dispute on the tree’s ecological and economic impact in Ethiopia: A review. Journal of Ecology and the Natural Environment, 11(6), 75–83. https://doi.org/10.5897/JENE2019.0765
- Aklilu, B., Merkineh, M., & Barana, B. (2020). Causes and impacts of deforestation and forest degradation at Duguna Fango Woreda. International Journal of Natural Resource Ecology and Management, 5(1), 14–25. https://doi.org/10.11648/j.ijnrem.20200501.13
- Alemu, B., Garedew, E., Eshetu, Z., & Kassa, H. (2015). Land use and land cover changes and associated driving forces in north western lowlands of Ethiopia. International Research Journal of Agricultural Science and Soil Science, 5(1), 28–44.
- Alemu, M., & Abebe, D. (2011). Private trees as household assets and determinants of tree growing behavior in rural Ethiopia. Environment for development (discussion paper series (EfD DP 11–14)), pp. 1–5.
- Anderson, J. R., Hardy, E. E., Roach, J. T., & Witmer, R. E. (1976). A land use and land cover classification system for use with remote sensor data (USGS Professional Paper 964).
- Baldi, G., Nosetto, M. D., Aragón, R., Aversa, F., Paruelo, J. M., & Jobbágy, E. G. (2008). Long-term satellite NDVI data sets: Evaluating their ability to detect ecosystem functional changes in South America. Sensor, 8(9), 5397–5425. https://doi.org/10.3390/s8095397
- Barana, B. (2016). Socioeconomic driving forces of land use/cover dynamics and its implications in Wallecha Watershed, Southern Ethiopia. Gjhss: B, XVI(VI), 49–58. https://globaljournals.org/GJHSS_Volume16/5-Socioeconomic-Driving-Forces-of-Land.pdf
- Chernet, D. (2018). Micro watershed development using GIS & remote sensing in the case of chille and ocholo watersheds, duguna Fango Woreda, Wolaita Zone, Southern Ethiopia. Journal of Environment and Earth Science, 8(2), 39–47. https://www.iiste.org/Journals/index.php/JEES/article/view/41033
- Conceicao, H. R., Borner, J., & Wunder, S. (2018). REDD+ as a public policy dilemma: understanding conflict and cooperation in the design of conservation incentives. Forests, 2018(11), 725. https://doi.org/10.3390/f9110725
- Congalton, R., & Green, K. (2009). Assessing the accuracy of remotely sensed data: Principles and practices (2nd ed.) CRC/Taylor & Francis.
- CSA (Central Statistical Agency). (2008). Summary and statistical report of the 2007 population and housing census results. United Nations Population Fund(UNFPA).
- Demel, T. (2001). Deforestation, wood famine and environmental degradation in Ethiopia’s highland ecosystems. Northeast African Studies, 8(1), 53–76. https://doi.org/10.1353/nas.2005.0020
- Devries, B., Verbesselt, J., Kooistra, L., & Herold, M. (2015). Remote sensing of environment robust monitoring of smallscale forest disturbances in a tropical montane forest using landsat time series. Remote Sensing of Environment, 161, 107–121. https://doi.org/10.1016/j.rse.2015.02.012
- ESRI (2010). Image classification using spatial analyst. ESRI ArcGIS. http://help.arcgis.com/en/arcgisdesktop/10.0/help/index.html#//00nv00000003000000.htm
- FAO. (2003). Forestry outlook study for Africa – African forests: A view to 2020. African Development Bank, European Commission and the Food and Agriculture Organization of the UN, p. 18 Retrieved August 8th, 2018, from http://ftp.fao.org/docrep/fao/005/Y4526B/y4526b00.pdf
- FAO. (2010). Global forest resources assessment 2010 country report: Ethiopia (FRA2010/065). UN: FAO.
- FAO. (2012). (FAO Forestry Paper No. 169). Agriculture Organization of the United Nations and European Commission Joint Research Centre.
- FAO. (2016). Forestry contribution to national economy and trade in Ethiopia, Kenya and Uganda. By Kilawe, E. and Habimana, D. UN: FAO.
- FRA (FAO).(2015). Global forest resources assessment 2015. UN: FAO. Retrieved Nov 25, 2019, from http://www.fao.org/3/a-i4782e.pdf
- Gashaw, T., Bantider, A., & Mahari, A. (2014). Evaluations of land use/land cover changes and land degradation in dera Woreda, Ethiopia: GIS and remote sensing based analysis. International Journal of Scientific Research in Environmental Sciences, 2(6), 199–208. https://doi.org/10.12983/ijsres-2014-p0199-0208
- Gessesse, D., & Christiansson, C. (2008). Forest decline and its causes in the south-central rift valley of Ethiopia: Human impact over a 100 year perspective. Swedish Academy of Sciences, 37(4), 263–271. DOI: 10.1579/0044-7447(2008)37[263:FDAICI]2.0.CO;2
- Gessesse, D., & Kleman, J. (2007). Pattern and magnitude of deforestation in the south central rift valley region of Ethiopia. Mountain Research and Development, 27, 162–168. https://doi.org/10.1659/mrd.0730
- GFOI. (2013). Integrating remote-sensing and ground-based observations for estimation of emissions and removals of greenhouse gases in forests: Methods and guidance from the global forest observations initiative: Pub: Group on earth observations, Geneva, Switzerland, 2014.
- IPCC. (2003). Good practice guidance for land use, land-use change and forestry. In J. Penman, M. Gytarsky, T. Hiraishi, T. Krug, D. Kruger, R. Pipatti, L. Buendia, K. Miwa, T. Ngara, K. Tanabe, & F. Wagner (Eds.), Managing the Risks of Extreme Events and Disasters to Advance Climate Change Adaptation (p. 632). Retrieved February 12, 2012, from http://www.ipcc-nggip.iges.or.jp
- John, W., & David, H. (2000). Measuring NDVI and EVI. http://earthobservatory.nasa.gov/Features/MeasuringVegetation/measuring_vegetation_1.Php
- Lee, C., Wang, C., Lee, C. H., & Sriarkarin, S. (2019). Evaluating the public’s preferences toward sustainable planning under climate and land use change in forest parks. Sustainability, 2019(11), 3149. https://doi.org/10.3390/su11113149
- Lemenih, M., Tolera, M., Karltun, E. (2008). Deforestation: impact on soil quality, biodiversity and livelihoods in the highlands of Ethiopia. In Sanchez, I. B., Alonso, C. L. (Eds), Deforestation research progress (pp. 21–39). Commack: Nova Science Publishers Inc
- Lu, D., Mausel, P., Brondizio, E., & Moran, E. (2004). Change detection techniques. International Journal of Remote Sensing, 25(12), 2365–2401. https://doi.org/10.1080/0143116031000139863
- Million, B. (2011). Forest plantations and woodlots in Ethiopia. African Forest Forum, 1(12), 11–15. http://www.afforum.org/sites/default/files/English/English_112.pdf
- Moges, Y., Eshetu, Z., & Nune, S. (2010). Ethiopian forest resources: current status and future management options in view of access to carbon finances. Ethiopian Climate Research and Networking; the United Nations Development Programme.
- National Meteorological Service Agency (NMSA). (2018). Rainfall and temperature records of Duguna Fango woreda. National Meteorological Service Agency (NMSA)
- Olofsson, P., Foody, G. M., Stehman, S. V., & Woodcock, C. (2013). Making better use of accuracy data in land change studies: Estimating accuracy and area and quantifying uncertainty using stratified estimation. Remote Sensing of Environment, 129, 122–131. https://doi.org/10.1016/j.rse.2012.10.031
- Qianwen, D., & Minghong, T. (2019). Spatial and temporal variations of forest cover in developing countries. Sustainability, 2019(11), 1517. https://www.mdpi.com/2071-1050/11/6/1517/pdf
- Sisay, N., Menale, K., & Mungatana, E. (2009). Forestry resource accounting: The experience of Ethiopia. Dordrecht,The Netherlands: Springer Science Business Media. In Hassan, R. M., Mungatana, E. D. (Eds.), The Implementing Environmental Accounts (Vol. 28, pp. 103–142). www.ceepa.co.za
- Takahashi, R., & Todo, Y. (2013). The impact of a shade coffee certification program on forest conservation: A case study from a wild coffee forest in Ethiopia. Journal of Environmental Management, 2013(130), 48–54. https://doi.org/10.1016/j.jenvman.2013.08.025
- Takahashi, R., & Todo, Y. (2017). Coffee certification and forest quality: Evidence from a wild coffee forest in Ethiopia. World Development, 2017(92), 158–166. https://doi.org/10.1016/j.worlddev.2016.12.001
- Teketay, D., Lemenih, M., Bekele, T., Yemshaw, Y., Feleke, S., Tadesse, W., Moges, Y., Hunde, T., & Nigussie, D. (2010). Forest resources and challenges of sustainable forest management and conservation in Ethiopia. In Bongers, F., Tennigkeit, T. (Eds.), Degraded Forests in Eastern Africa, Management and Restoration (pp. 19–63). Earthscan, London
- Temesgen, G., Amare, B., & Abraham, M. (2014). Evaluations of land use/land cover changes and land degradation in Dera Woreda, Ethiopia: GIS and remote sensing based analysis. International Journal of Scientific Research in Environmental Sciences, 2(6), 199–208. https://doi.org/10.12983/ijsres-2014-p0199-0208
- Tesfahun, F., & Temesgen, G. (2014). Evaluation of land use/land cover changes of Bantneka Watershed, Ethiopia. Merit Research Journal of Agricultural Science and Soil Sciences, 2(7), 081–085. https://core.ac.uk/download/pdf/234677812.pdf
- Woody Biomass Inventory and Strategic Planning Project (WBISPP). (2004). national strategic plan for the biomass energy sector: Final report; Ministry of Agriculture and Rural Development: 201.
- Yitebitu, M. (2010). Eucalyptus trees and the environment: a new perspective in times of climate change. In L. Gil, W. Tadesse, E. Tolosana, & R. López (Eds.), Eucalyptus species management, history, status and trends in Ethiopia (pp. 104–113). Proceedings from the Congress held in Addis Ababa. September 15–17, 2010. Addis Ababa, Ethiopia
- Yohannes, H., Mohammed, A., & Elias, E. (2017). Land use/land cover dynamics and its impact on biodiversity resources in the Abijata Shalla national park, central rift valley. An Indian Journal Environmental Science, 13(5), 152. www.tsijournals.com
- Zeleke, G., & Hurni, H. (2001, May). Implications of land use and land cover dynamics for mountain resource degradation in the northwestern Ethiopian highlands. Mountain Research and Development, 21(2), 184–191. https://doi.org/10.1659/0276-4741(2001)021[0184:IOLUAL]2.0.CO;2