
 ?Mathematical formulae have been encoded as MathML and are displayed in this HTML version using MathJax in order to improve their display. Uncheck the box to turn MathJax off. This feature requires Javascript. Click on a formula to zoom.
Abstract
The economic value of water is essential for the rational allocation of the scarce water resource as its availability has become a problem in many countries of the world. This study specifically aimed to assess the households’ willingness to pay decision and to estimate farmers’ willingness to pay for improved irrigation water use. The primary was data collected from 210 households selected through a multistage sampling technique followed by a probability proportional to sample size while it was also supplemented by secondary data. Double-bounded dichotomous choices with follow-up open-ended questions of contingent valuation methods were employed. The result of the study showed that all of the households were willing to pay for improved irrigation water use. The mean willingness to pay for the use of improved irrigation water from the double-bounded dichotomous question of Seemingly Unrelated Bivariate Probit model was Birr 829.46 per year per timad (0.25 ha). On the other hand, the mean willingness to pay from open-ended questions was Birr 726.55 per year per timad (0.25 ha). The respective total aggregate value of improved irrigation water use in the study varies from 33,421,300 birr in open ended to 38,155,160 birr from double bound. Thus, appropriate irrigation water pricing will make the user more aware of the resource scarcity. Therefore, the study suggests a good indicator for the concerned body to invest in expanding the current irrigation projects and introducing proper irrigation water pricing, creating more value for improved irrigation, leading to efficient management of the improved system.
PUBLIC INTEREST STATEMENT
Water is depleted rapidly, makes it a scarce good. Its scarcity increases competition and conflicts among end users. It is necessary to make decisions on conservation and allocations compatible with social objectives such as economic efficiency, sustainability and equity, like improved irrigation water, to increase production and productivity. Irrigation plays a vital role to increase production to meet the growing food demand and stabilize agricultural production and productivity. Pricing mechanism of irrigation water is based on non-volumetric measures and the existing irrigation policy of the country gives more emphasis on the construction of small-scale irrigation projects rather than the valuation of the irrigation water. Water pricing can potentially raise significant financial resources to pay for the sustainable management of water resources. With this regard, this study examines farmers’ willingness to pay for improved irrigation water use which is very essential to implement water pricing.
Competing interests
The authors declare no competing interests.
1. Introduction
Water is a finite and vulnerable natural resource, which is an essence of life on earth. It plays an important role in supporting life and maintaining human health and it ensures to have sustainable ecosystem development (Bagatin et al., Citation2014; UNESCO (United Nations Educational, Scientific and Cultural Organization), Citation2015).
Water resources in Africa have become a strategic commodity, with supply limited in terms of quantity and quality, and demand increasing due to population growth and economic development. Africa is home to about 13% of the world’s population, but has only about 9% of the world’s water resources. Per capita level of water availability in Africaislow due to a significant decline in the average rainfall, high evaporative losses and the high variability of supply, due to highly variable rainfall (AMCOW, Citation2012).
Ethiopia is described as the “water tower” of Africa. It has 12 river basins with an annual runoff volume of 125 billion m3 (Bekele et al., Citation2010; EneyewAdugna, Citation2014). The ground water potential is estimated to be more than 2.6 m3, a relatively large volume (Bekele et al., Citation2010). Despite the country’s abundant rainfall and water resources, its agricultural system does not yet fully benefit from the technologies of water management and irrigation.
From the estimated irrigation potential to be about above 5.3 million hectares of arable land, the goal of Growth and Transformation Plan (GTP I) of Ethiopia was to reach the irrigation development to be 15.4%. However, the achievement of the area under irrigation development in 2012/2013 was 10.76%, including several irrigation development projects under construction like, Kesem-Tendaho, Koga, Rib, Gidabo, Megech-Sereba, Kobo-Girana, Raya-Azebo, and Adea-Betcho (Ministryof WaterResources MoWR, Citation2013). This shows that water resources have made little contribution towards the development of irrigated agricultural sector as significant irrigation potential of the country has not been much utilized to raise agricultural production and productivity.
In recent times, the Government of Ethiopia has designed policy and strategy to eradicate poverty in its five-year plan called the Growth and Transformation Plan (GTP II) by maintaining agriculture as a major source of economic growth. In this regard, the government plan to give priority in the second Growth and Transformation Plan period by expanding small-scale irrigation to increase agricultural production and productivity, to enhance the economic contribution of water resources (NPC (National Planning Commission), Citation2016).
In Ethiopia, the pricing mechanism of irrigation water is based on non-volumetric measures and the existing irrigation policy of the country gives more emphasis on the construction of small-scale irrigation projects rather than the valuation of the irrigation water. Water pricing can potentially raise significant financial resources to pay for the sustainable management of water resources. Revenues from water pricing are particularly important for developing countries in which funds from public budgets and from donor sources are unpredictable and may vary significantly from year to year (EC (European Commission), Citation2012). With this regard, this study was conducted in Meskan district, Guraghe Zone, Southern Ethiopia to estimate farmers’ willingness to pay for improved irrigation water use using double-bounded contingent valuation method (CVM) followed by open-ended questions. This research answers the following questions: are the farmers willing to pay for the improved irrigation water use and how much are they willing to pay for the improved irrigation water use.
2. Materials and methods
2.1. Description of the study area
The study was conducted in Meskan district, which is found in Guraghe zone of the Southern Nations, Nationalities and Peoples Regional State, Ethiopia. Its geographical location is situated between 7.993515–8.278101°N Latitude and 38.26–38.5786°E Longitude with an altitude range from 1501 to 3500 m.a.s.l. The mean annual rainfall range between 1001 and 1200 mm with the annual average temperature ranging from 22°C to 25° C. (MeskanWoreda Cooperatives Promotion Office Saving and Credit Cooperative Society document, Citation2015). Meskan district covers 50,177 hectares. The total irrigable area is estimated about 11,500 ha. Perennial rivers and springs are found in the district. The rivers are major source of irrigation water (MWARDO (MeskanWoredaAgriculturaland RuralDevelopment Office), Citation2018). The district has a long history of traditional irrigation practices and indigenous knowledge. River diversion irrigation systems are practiced in the district using the rivers which are the main source of water for irrigation system. However, all of these diversions are not well constructed and proper canal construction is the major and severe problem in the study area (Figure ).
Figure 1. GIS map of the study area
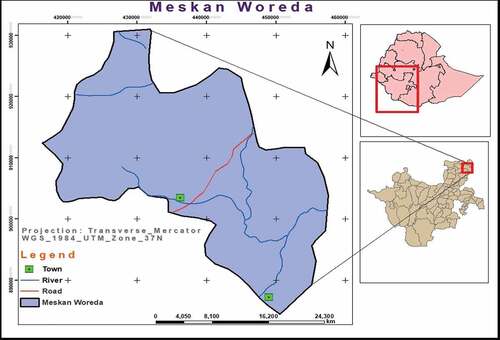
Perennial rivers (Erinzaf, Eresha, Jirbenas, and Akamuja) and springs are found in the district. The rivers are major source of irrigation water (MWARDO (MeskanWoredaAgriculturaland RuralDevelopment Office), Citation2018). The district has a long history of traditional irrigation practices and indigenous knowledge. River diversion irrigation systems are practiced in the district using the rivers which are the main source of water for irrigation system. That is, Yetebone irrigation project was constructed by diverting the riversErinzaf and Jirbenas while Eresha and Akamuja rivers are the source of water for the Dobena Gola and Wita diversion project. However, all of these diversions are not well constructed and proper canal construction is the major and severe problem in the study area.
2.2. Sampling design and sample size
For a quantitative research, the probability sampling technique is appropriate as compared toa non-probability sampling technique because samples drawn by using probability sampling techniques are more representative than non-probability sampling techniques. Accordingly, a multistage random sampling technique was used for this study. In the first step, three kebeles, namely: Yetebon, Wita and DobenaGola of MeskanWoreda were selected. In the second step, three irrigation schemes were randomly selected from each Kebeles. In the third step, 210 randomly selected households were allocated to the sample Kebeles, irrigation water users using probability proportional to sample size. Finally, systematic random sampling was applied to draw sample households from each kebeles.
2.3. Methods of data collections
Quantitative primary data were gathered accompanied by a face to face interview. Focus group discussion and key informant interview were also made as part of data collection method for qualitative primary data. Moreover, secondary data were collected from journals, books and agriculture office of the District. Similarly, quantitative data were collected employing semi-structured questionnaire. The questionnaire was administered in four sections. The first section was general information about the households; the second section incorporates demographic, socioeconomic and institutional variables, the third section contains households’ experience and the fourth section contains contingent valuation scenario and household’s WTP for the improved irrigation water use. The questionnaire was translated into the local language (Guragigna) to ease the data collection process. Then, well-trained enumerators who have good experience in the survey were employed to gather the data required for this study. The actual survey was conducted between January and April 2017.
Dichotomous choice format CVM studies are preceded by a pre-test survey of the small sample population. The discussion by Hoyos and Mariel (Citation2010) indicated that pilot survey with open-ended questions can help to provide some information on the bounds of respondents’ WTP. As a result, the pre-test survey was conducted before the actual survey. A pre-test of the draft questionnaire was done on 30 selected respondents who were assumed to be representative of the households living in the three Kebeles. In addition to the pre-test survey, focus group discussion and key informant interview were held to determine initial bids in terms of cash. Accordingly, five most frequently stated values were then selected as a starting value (price) for the double-bounded dichotomous choice format. These values were 300, 400,500, 600 and, 700 Birr per year per timad (0.25 ha) of irrigable land. Following Cameron and Quiggin (Citation1994), sets of bids were determined for double-bounded dichotomous choice format by making twice the initial bid if the first response is “Yes” and half of it if the response is “No”. These sets of bids were (300, 150, 600), (400,200,800), (500, 250, 1000), (600, 300, 1200), and (700, 350, 1400) Birr per year per timad (0.25 ha) of irrigable land. These bids set were assigned randomly across the respondents to avoid starting point bias (Mitchel & Carson, Citation1989).
2.4. Methods of data analysis
2.4.1. Contingent valuation method
There are different types of elicitation methods used to estimate willingness to pay from a sample of households in contingent valuation surveys. The most commonly and widely used elicitation formats are open-ended and payment card which is incentive compatible, bidding game, single, and double-bounded dichotomous choice methods. Among these especially dichotomous-choice (DC) format is the most widely used one (Ahmed & Gotoh, Citation2006). The NOAA blue ribbon panel of the US advocated DC method as the most appropriate one in most circumstances (Arrow et al., Citation1993). Bidding game, single, and double-bounded dichotomous choice methods have been shown to suffer from incentive compatibility problems in which survey respondents can influence potential outcomes by revealing values other than their true willingness to pay. Both single and double-bounded dichotomous choice approach has become most widely adopted, despite criticisms and doubts, in part because it appears to be incentive-compatible (Haab & McConnell, Citation2003). Incentive compatibility means that the properties of the value elicitation format assure that there is no advantage in answering strategically: the truthful preference revelation is an optimal (and the dominant) strategy for the respondent (Chanel et al., Citation2015).
Single-bounded dichotomous choice method is easy to implement and much more familiar to the respondents because of the similarity to the market condition. Thus, it minimizes non-responses rate and avoids outliers (Chanel et al., Citation2015). In double-bounded dichotomous choice method more statistical efficiency can be achieved than that of SBDC. Moreover, additional information can be elicited on each respondent’s WTP (Ahmed & Gotoh, Citation2006). According to Haab and McConnell (Citation2003) it increases efficiency over single-bounded dichotomous choice method in three ways. First, the answer sequences yes-no or no-yes yield clear bounds on the WTP. Second, efficiency gains for the no-no pairs and the yes-yes pairs; finally, the number of responses is increased. Depending on the above explanation, this study employed double-bounded CVM followed by openended questions.
2.4.2. Statistical analysis
The collected data were fed into SPSS 20 and STATA 13 statistical software and analysed using percentages, frequency, mean and Seemingly Unrelated Bivariate Probit econometric model. The nature of the dependent variable determines the type of econometric model. Consequently, the objective of this study was to estimate households’ willingness to pay for the improved irrigation water use.
The bivariate probit model is used to estimate the mean WTP from the double-bounded dichotomous elicitation method. But, when the estimated correlation coefficient of the error terms in bivariate probit model is assumed to follow normal distributions with zero mean and distinguishable from zero, the system of equations could be estimated as Seemingly Unrelated Bivariate Probit (SUBVP) model (Haab & McConnell, Citation2002). Therefore, in this study SUBVP was employed to estimate the mean WTP of the respondents from the double-bounded elicitation method.
If
otherwise
If
otherwise
Where, y1and y2 are WTP responses corresponding to the initial bid and second bid price. (Rho) is the covariance between the errors term. The double-bounded version of discrete response CV follows up on the initial question with a second question, again involving a specific bid to which the respondent can respond with a “yes” or a “no.” Let B1 denote the amount of the first bid. The amount presented in the second bid depends on the response to first bid; if the individual answered “no” to B1, the second bid is some lower amount, B2< B1, while if respondent answered “yes” it is some higher amount, B2> B1. Thus, there are four possible response sequences: (a) both answers are yes; (b) both answers are no; (c)a yes followed by a no; and (d) a no followed by a yes (Hanemann & Kanninen, Citation1998).
According to (Haab & McConnell, Citation2003), the bounds on WTP are
1., for the yes-no responses;
2., for the no-yes responses;
3., for the yes-yes responses;
4., for the no-no responses;
Where, B1 be the first bid price and B2 be the second. Hence, the probability of the responses is given by
Following Haab and McConnell (Citation2003), the econometric modelling for the formulation of double-bounded data is given as:
Where, represents the jthrespondents willingness to pay, and i = 1 and 2 represent the first and second answers. The u1and u2 are the means for the first and second responses.
This general model incorporates the idea that, for an individual, the first and second responses to the CV questions are different, perhaps motivated by different covariates, perhaps by the same covariates but with different response vectors, and with different random terms.
To construct the likelihood function, we first derive the probability of observing each of the possible two-bid response sequences (yes-yes, yes-no, no-yes, no-no). It is given by;
Where; YY = 1 for a yes-yes answer, 0 otherwise, YN = 1 for a yes-no answer, 0 otherwise, NY = 1 for a no-yes answer, 0 otherwise and NN = 1 for a no-no answer, 0 otherwise.
This formulation is referred to as the bivariate discrete choice model. If the errors are assumed to be normally distributed with means 0 and respective variances of then
and
have a bivariate normal distribution with mean u1 and u2 variances
and
and correlation coefficient ρ.
The likelihood function for the bivariate probit model can be derived as follows. The probability of a no-no response, is
Where, Φε1ε2 is the standardized bivariate normal cumulative distribution function with zero means, unit variances and correlation coefficient ρ. Similarly, the probability of a no-yes response is
The probability of a yes-no response is
And the probability of a yes-yes response is
Defining y1j = 1 if the response to the first question is yes, and 0 otherwise, y2j = 1 if the response to the second question is yes, and 0 otherwise, d1j = 2y1j—1, and d2j = 2y2j—1, the jthcontribution to the bivariate probit likelihood function becomes
After running regression of dependent variable (yes/no indicator), on a constant and on independent variable consisting of the bid levels, the mean WTP value is determined as follows depending on the normality assumption of WTP distributions (Haab & McConnell, 2002):
Where, the mean willingness to pay for improved irrigation water use,
the intercept of the model,
slope coefficient of the bid values.
For the open-ended contingent valuation survey responses the maximum willingness to pay figures reported by the respondents can be simply be averaged to produce an estimate of mean willingness to pay:
Where n is the sample size and each y is a reported maximum willingness to pay amount by surveyed households (Haab & McConnell, Citation2003).
3. Results and discussions
Among the total surveyed households (210), 184 (87.62%) were male-headed households and the remaining 26 (12.38%) respondents were female-headed households (Table ). The mean age of the sampled respondents was 40.36 years with the minimum age of 25 years and a maximum of 65 years old. Family size with age composition is important to carry out different agricultural activities like irrigation farming. So it is necessary to see family size with their active labor. The mean family sizes of the total sample respondents were about 5.25 persons.
Table 1. Definition and descriptive statistics of socioeconomic and demographic variables
From the total household heads, about 52.86% of them did not attend any formal education (illiterate) and the remaining 47.14% household heads attended formal education or they are literate. Educational background is believed to be an important feature that determines the readiness of household heads to accept new ideas and innovations. Also it affects technology adoption decision. It plays major role in decision-making processes that change people life process. In the study area, more educated farmers were high maximum willingness to pay for improved irrigation water use compared to low educational level. This is because more educated farmers are expected to adopt new technologies to increase their land and labor productivity. The mean grade level for the total sample respondents was about 3.42 ranging from illiterate or zero to a maximum of 12 years of schooling. Irrigation farming experience is taken to be the number of years that an individual was engaged in irrigation farming. The mean practical irrigated farming experience of the entire sample was 7.25 years ranging from 1 to 15 years.
Regarding to resource ownership, land is one of the most important factor of physical input of agricultural production for rural households whose primary means of livelihoods is farming and measure of wealth in the study area. It is the main source of income and increases the status of people in the community and potential irrigable land holding shows how farmers intended to produce irrigated commodities. The local unit of measurement for land size in the study area is “timad” which is one timad equal to 0.25 hectare or one hectare equal to 4 timad. Table shows that the mean potential irrigable land-holding size of the sample households was 1.037 ha, ranging from 0.25 to 3.985 ha. Besides this, livestock ownership is an important factor. In the study area, having large number of livestock is seen as a dignity or store of value. The mean livestock ownership in terms of TLU for the total sampled households was 3.97 with the minimum and maximum being 0 and 13.40, respectively.
Table 2. Distribution of yes and no responses for initial and/or follow up bid value
Table 3. Means of money payment for WTP
Table 4. Estimates of the double-bounded dichotomous choice format
Credit is an imperative source for financing the agricultural activities of smallholder farmers. It is one way of improving smallholder farmers’ production and productivity. Farmers having better access to credit can minimize their financial constraints and buy inputs more readily than those with no access to credit. However, only 35.2% of the respondents have taken credit from the available sources in the study area.
Income from agricultural activities was the most important source of income for the farmers interviewed. The mean annual income of the respondents was about 45,134.88 ETB per household. Out of the total respondents, 81.9% of them were dissatisfied with the existing irrigation water supply. After asked whether they are satisfied with the existing scheme, households were asked to specify any challenges and problems they have faced/observed in the existing irrigation schemes. Attempt has been made to rank the major constraints of irrigated schemes from the most severe problems to the least are insufficient water supply, no access to irrigation water, canal problem water distribution and infrastructure constraints which were listed/specified by the sampled respondents.
3.1. The contingent valuation survey results
In the questionnaire, households were asked whether they are willing to pay for the improved irrigation water supply in the command area. Consequently, all of the sample household heads were willing to pay if there is an improvement in the service of the existing irrigation schemes. This indicates that the improvement of the existing irrigation schemes is supported by all households. In order to determine households’ willingness to pay for the provision of improved irrigation water, they were offered with five initial bid values (300, 400, 500, 600, and 700) and the corresponding follow up bids for one timad (0.25 ha) of irrigable land per year. Hence, given the randomly assigned initial bids, Table 7 shows that out of the total household heads who are willing to pay, 73.3% of them said “yes” or they are willing to accept the initial bids. And the remaining 26.7% said “no” or they are not willing to accept the initial bids. The follow-up bids were doubled for those households who were willing to pay the given initial bids and halved for those households that were not willing to accept the initial bids. Thus, there are four possible response sequences in the double-bounded dichotomous choice model: these are; both answers are yes (Yes-Yes); both answers are no (No-No); a yes answer followed by a no answer (Yes-No); and a no answer followed by a yes answer (No-Yes) (Haab & McConnell, Citation2003). Therefore, given the randomly assigned follow-up bids, 72.9 %households said “yes” or they are willing to accept the follow-up bid and 27.1%household heads said “no” or they are not willing to accept the follow-up bids. The result is summarized in Table and .
The distribution of “Yes” and “No” answers to the corresponding initial and follow-up bids are given in Table 7. When the initial bid was Birr 300 per Timad (0.25 ha) of irrigable land per year, 42respondents were randomly offered this bid and only 2 of them did not accept the initial bid. However, when the initial bid was doubled (600 Birr), 4 respondents did not accept it. As shown in Table 8, for the first initial and its follow-up bids, 36 respondents answer “YY” (Yes to both the initial and the follow up bids); 2 respondents answer “NY” (No to initial and Yes to the follow-up bids) but no one answers “NN” (No to both the initial and the follow-up bids).
In the second initial and its follow-up bid values 400/(800/200), 30 household heads answer “YY” and 7, 4 and 1 answer for “YN”, “NY” and “NN”, respectively. The third initial bid, which is Birr 500, 24 out of 42 respondents answer “YY” (yes to both the first bid and the follow-up bids) and 2 households answer “NN” (No to first and No to the follow-up bids). But, only nine respondents answer “YN” (Yes to first and No to the follow-up bids) and seven of them answer “NY” (no to first and yes to the follow-up bids). The above trends are the same in the fourth and fifth initial and follow-up bid levels. Generally, as the initial and follow-up bids increased, the responses to “YY” (Yes to both the initial and follow-up bids) decreased whereas “NN” (No to both the initial and follow-up bids) answer increased. At the first bid, there are 36 “YY” (85.7%) answer which reduced continuously up to the last bid level and reached at 8 (19%). Therefore, this result is consistent with the economic theory of demand which states as the price of the product increases, the quantity demand for that product decreases, keeping other things constant. The distribution of “yes” and “no” responses along the initial bid level also approves the argument that the probability of “yes” responses declines with increased bid price. When the initial bid value 300 Birr, 40 respondents accept it. However, as the bid level rise, “No” response becomes increased while “yes” response decreased.
3.2. Means of money payment for the improved irrigation water supply
Out of the total sample households, majority of the total households (60.5%) were willing to make direct cash payment for the improved irrigation water use while 32.8%, 3.8%and 2.9% of the total households were willing to pay through social associations, on-tax and labor, respectively.
4. Households’Mean willingness to pay for improved irrigation water
4.1. Estimation of mean WTP from double-bounded dichotomous format
The main objective of the double-bounded dichotomous was to estimate the mean WTP from responses of both bids offered. The mean WTP of the respondents for the improved irrigation water use was calculated using the formula specified by Haab and McConnell (2002). The coefficients and
were estimated by running the Seemingly Unrelated Bivariate Probit model using the first bids and second bids as explanatory variables as shown in Appendix 3. Accordingly, the mean WTP estimated from the initial bid and the follow-up bid values ranged from 681.27 to 977.65 Birr per year per 0.25 hectare of irrigated land.
In the double-bounded estimates reported in Table , the initial bid and the second bid have the expected signs and both are statistically significant at 1 % level of significance. Both results imply that higher initial bid and second bid lead to lower probability of accepting that bid. In the Seemingly Unrelated Bivariate Probit Estimates (SUR) Rho (ρ), coefficient of correlation of error terms of the double-bounded model, is positive and statistically significant at 1% level of significance. This basically shows that there is positive linear relationship between the random components of the responses to the initial bid and the second bid. The fact that Rho (ρ) is unity indicates that the correlation between the random components of the responses to the initial bid and the second bid is perfect. This implies that there is perfect positive correlation between the two responses. Using the coefficients of bid and constant in Table 12, the mean WTP for improved irrigation water use from the double-bounded probit estimate was estimated using the formula by Haab and McConnell (2002) and was found to be Birr 829.46per year per 0.25 hectare of irrigable land. At 95% confidence interval, the WTP varies between 681.27 and 977.65 birr per year per 0.25 hectare of irrigable land.
5. Analysis of the open-ended format
In the open-ended question, respondents were asked to state the maximum amount they would like to pay for improved irrigation water use. The maximum amount of Birr that the households were willing to pay for the improved irrigation water use ranges from Birr100 to 1600 per year per one timad (0.25 ha.) of irrigable land. Table shows that all of the farmers were willing to pay for improved irrigation water use. The frequency distribution of the responses of the sampled households of the open-ended responses is also presented below.
Table 5. Frequency distribution of the open-ended format
All of the sample respondents were willing to contribute Birr for improved irrigation water use. The average Birr that farmers were willing to contribute for improved irrigation water use was 726.55. The result shows that the mean WTP from double-bound format was greater than the mean value from the open-ended response which was computed at Birr 829.46per year per 0.25 hectare of irrigated land. Thus, from the double-bounded format, households’ mean annual willingness to pay amount was Birr 3317.84 per hectare, while open-ended format was to be 2906.20 birr per hectare. This result is consistent with the findings of Tolera et al. (Citation2017) and Alem et al. (Citation2013) who suggested a possible reason that respondents may want a free service from the government or become free riding in the open-ended questions.
5.1. Estimating aggregate willingness to pay (Aggregate economic value)
Aggregation of benefit (TEV) of conservation work is the final step in the contingent valuation research. An important issue related to the measurement of welfare using WTP is aggregation of benefit (Alemu, Citation2000). The aggregate willingness to pay for improved irrigation water supply can be estimated by taking total number of beneficiary households and total irrigable land in the command area. According to the MWARDO (MeskanWoredaAgriculturaland RuralDevelopment Office) (Citation2018), the total number of beneficiary households in the district were estimated at about 10,094 and the total irrigable area is estimated about11,500 ha. Based on these figures, Table shows the expected aggregate willingness to pay for improved irrigation water supply using the DBDC and open-ended question was estimated to be38,155,160and 33,421,300 birr per year, respectively.
Table 6. Summary of WTP and its aggregate values
5.2. Estimated demand for the improved irrigation water use
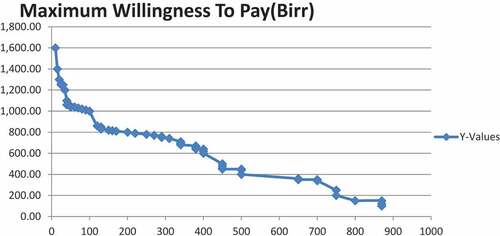
The demand for the improved irrigation water supply at different price level is shown diagrammatically in Figure . This relationship can be more easily observed by deriving a demand curve for the improved irrigation water use. To this end, this can measure the midpoint of maximum WTP along the vertical axis and the number of households who are willing to pay per timad (0.25 ha.) per year along the horizontal axis.
6. Total number of households
As shown in Figure , the demand curve has a negative slope and convex to the origin; it is in line with the economic theory of demand, which is similar to most economic goods under normal conditions. This implies an increase in the price of the improved irrigation water, decreases the quantity demanded for the improved irrigation water, ceteris paribus.
Figure 2. Estimated demand curve for improved irrigation water supply
7. Conclusions and recommendations
Water is a limited and vulnerable natural resource which is an essence of life on earth and it plays a vital role in economic development; making the development of water pricing mechanisms got high priority among various tools for efficient water management. Pricing of agricultural water and cost recovery is important in promoting water use efficiency. If there are no water charges, people tend to use water carelessly. Better water allocation could be achieved if the economic value of water is known by use, region and season. Knowledge of water value can play a significant role for cost benefit analyses of investments in irrigation and formulation of water pricing policies.
The seemingly unrelated bivariate probit model revealed that the mean WTP for the respondents was Birr 829.46 per year per timad (0.25ha.) which is estimated to be about 3317.84 Birr per hectare per year. On the other hand, the mean willingness to pay from open-ended questions was Birr 726.55 per year per timad (0.25 ha.) which is estimated to be about 2906.2 Birr per hectare per year. The respective total aggregate value of improved irrigation water use in the study varies from 33,421,300 ETB in open ended to 38,155,160 ETB from double-bound CVM. Thus, in this study, the mean willingness to pay from open-ended questions is lower than the dichotomous choice questions.
rom double-bounded dichotomous showed that households’ mean annual willingness to pay amount was Birr 3317.84 per hectare per year, while open-ended format was to be 2906.20 birr per hectare per year. This showed that the value of improved irrigation water use from open-ended format was underestimated.
All of the sample household heads have shown their willingness to pay if there is an improvement in the service of the existing irrigation water supply. Thus, the participation of the community should be ensured in every decision making and formulation of policies and strategies which are related to the improved irrigation water use. This encourages the commitment of the community for the conservation programs and helps them to develop a sense of ownership which has its own contribution for the sustainability and effectiveness of improved irrigation water use.
The empirical findings of the study revealed that several socio-economic variables are key factors influencing households’ WTP. Therefore, a well understanding of factors governing farmers’ willingness to pay for improved irrigation water use significantly is a necessary and first step for the concerned body to achieve improved irrigation water and then to implement irrigation water pricing. And would help to implement effective irrigation plans, or improve the management of existing irrigation projects to utilize the resource optimally in a sustainable manner.
The study finding indicates that households in the study area were willing to pay an amount of birr 2906.20 to 3317.84 per hectare per year. Therefore, this shows that there is opportunity for improving irrigation water services through a cost recovery mechanism. Thus, it is better to exploit this opportunity by expanding coverage of irrigation water schemes with the potential of implementing irrigation water fee as supplement to public budget.
Additional information
Funding
Notes on contributors

Mahmud Aman
Mahmud Aman joined Agriculture and Natural Resource College of Asossa University in 2015 after he holds his bachelor degree in Agricultural Economics from Agriculture and Natural Resource College of Hawassa University, Ethiopia. After 1-year work experience, he got an in-country scholarship in Jimma University. Now, he holds his master degree in Agricultural Economics on 3 November 2018. Now, he is engaged in teaching, research, and community service. Specially, measurement and modeling of willingness to pay, food security, value chain analysis, income diversification, livelihood analysis, and poverty analysis are the author’s interest area of research.
References
- Ahmed, S. U., & Gotoh, K. (2006). The choice of elicitation methods in CVM and their impact on willingness to pay in environmental assessment.
- Alem, M., Worku, T., & Zebene, A. (2013). Economic values of irrigation water in Wondo Genet District, Ethiopia: An application of contingent valuation method. Journal of economics and Sustainable Development, 4(2), 2013.
- Alemu, M. (2000). Valuation of community forestry in Ethiopia: A contingent valuation study of rural households. Environment and Development Economics, 5(3), 289–18. http://sci-hub.tw/10.1017/S1355770X00000188
- AMCOW. (2012). Status report on the application of integrated approaches to water resources management in Africa.
- Arrow, K., Sollow, R., Leamer, E., Potney, P., Rander, R., & Schuman, H. (1993). Report on the NOAA panel on contingent valuation. Federal Register, 58, 4601–4604.
- Bagatin, R., Klemeš, J., Reverberi, A. P., & Huisingh, D. (2014). Conservation and improvements in water resource management: A global challenge. Journal of Cleaner Production, 77, 1–9. http://sci-hub.tw/10.1016/j.jclepro.2014.04.027
- Bekele, S., Erkossa, T., & Namara, R. (2010). Irrigation Potential in Ethiopia: Constraints and opportunities for enhancing the system. International Water Management Institute.
- Cameron, T., & Quiggin, J. (1994). Estimation using contingent valuation data from a dichotomous choice with follow-up questionnaire. Journal of Environmental Economics and Management, 27(3), 218–234. http://sci-hub.tw/10.1006/jeem.1994.1035
- Chanel, O., Makhloufi, K., & Abu-Zaineh, M. (2015). Testing the circular payment card elicitation format: Evidence from a contingent valuation on health and pension insurance schemes in Tunisia.
- EC (European Commission). (2012, May 7). The role of water pricing and water allocation in agricultureindelivering sustainable wateruseinEuropefinalreport. p. 152. WWW.Arcadisbelgium.Be
- EneyewAdugna. (2014). Five key constraints to small scale irrigation development in Ethiopia, socio-economic view: Review paper. Global Advanced Research Journal of Management and Business Studies, 3(10), 441–444.
- Haab, T., & McConnell, K. (2003). Valuing environmental and natural resources, the econometrics of non-market valuation. Edward Elgar.
- Haab, T.C and McConnell, K.E. (2002). Valuing Environmental and Natural Resources: The Econometrics of Non-Market Valuation. Northampton: Edward Elgar Publishing. http://dx.doi.org/10.4337/9781843765431
- Hanemann, M. A., & Kanninen, B. (1998). Statistical efficiency of double-bounded dichotomous choice contingent valuation. American Journal of Agricultural Economics, 969, 1255–1263.
- Hoyos, D., & Mariel, P. (2010). Contingent valuation: Past, present and future. Prague Economic Papers, 4(2010), 329–343. http://sci-hub.tw/10.18267/j.pep.380
- MeskanWoreda Cooperatives Promotion Office Saving and Credit Cooperative Society document. (2015).
- Ministryof WaterResources MoWR. (2013). Water sector development program (2002-2016) (Main report). Addis Ababa.
- Mitchell, R. C. and R. T. Carson (1989), Using Surveys to Value Public Goods: The Contingent Valuation Method. Baltimore: John Hopkins University Press
- MWARDO (MeskanWoredaAgriculturaland RuralDevelopment Office). (2018). Agricultural report of Meskan district.
- NPC (National Planning Commission). (2016). Growth and transformation plan II (2015/16-2019/20), Volume I: Main text. Addis Ababa.
- Tolera, T., Legesse, B., Aman, M., & Etensa, T. (2017). Economic valuation of improved irrigation water use: The case of Woliso District, South West Shoa Zone, Oromia National Regional State, Ethiopia. Journal of Economics and Sustainable Development, 8(13), 2017. 2222-1700 (Paper) 2222-2855 (Online).
- UNESCO (United Nations Educational, Scientific and Cultural Organization). (2015). Water for a sustainable world. The United Nations World Water Development Report 2015. http://unesdoc.unesco.org/images/0023/002318/231823E.pdf
Appendix
Table A1. Conversion factors used to estimate man equivalent
Table A2. Conversion factors used to estimate Tropical Livestock Units (TLU)
Table A3. Seemingly Unrelated Bivariate Probit regression
biprobit (BID1ANS = SEX AGE EDU FSIZE LAND TLU INCOME EXP CRDT EXT DMKT DIRS DISSAT BID1) (BID2ANS = SEX AGE EDU FSIZE LAND TLU INCOME EXP CRDT EXT DMKT DIRS DISSAT BID2)
Fitting comparison equation 1:
Iteration 0: log likelihood = -129.1175
Iteration 1: log likelihood = -46.46309
Iteration 2: log likelihood = -37.175562
Iteration 3: log likelihood = -36.077107
Iteration 4: log likelihood = -36.064462
Iteration 5: log likelihood = -36.064456
Iteration 6: log likelihood = -36.064456
Fitting comparison equation 2:
Iteration 0: log likelihood = -127.42283
Iteration 1: log likelihood = -68.432055
Iteration 2: log likelihood = -63.46172
Iteration 3: log likelihood = -63.333466
Iteration 4: log likelihood = -63.333178
Iteration 5: log likelihood = -63.333178
Comparison: log likelihood = -99.397634
Fitting full model:
Iteration 0: log likelihood = -99.397634
Iteration 1: log likelihood = -98.118418
Iteration 2: log likelihood = -97.189215
Iteration 3: log likelihood = -96.279796
Iteration 4: log likelihood = -96.0351
Iteration 5: log likelihood = -95.98673
Iteration 6: log likelihood = -95.977033
Iteration 7: log likelihood = -95.969178
Iteration 8: log likelihood = -95.962373
Iteration 9: log likelihood = -95.959547
Iteration 10: log likelihood = -95.957298
Iteration 11: log likelihood = -95.957099
Iteration 12: log likelihood = -95.957067
Iteration 13: log likelihood = -95.956864
Iteration 14: log likelihood = -95.956859
Iteration 15: log likelihood = -95.956829
Iteration 16: log likelihood = -95.95579
Iteration 17: log likelihood = -95.955789
Seemingly unrelated bivariate probitNumber of obs. = 210
Wald chi2 (28) = 110.99
Log likelihood = −95.955789Prob> chi2 = 0.0000