
 ?Mathematical formulae have been encoded as MathML and are displayed in this HTML version using MathJax in order to improve their display. Uncheck the box to turn MathJax off. This feature requires Javascript. Click on a formula to zoom.
Abstract
Malaria has long been a cause of human suffering and mortality in Sub-Saharan Africa, particularly in Ethiopia. The objective of this study was to assess the spatial distribution of malaria risk using MCE (Multi-Criteria Evaluation). To analyze and generate a spatial malaria risk level distribution map. Factors that affect the spatial malaria hazard and risk distribution have been considered. Such as; temperature, rainfall, altitude, slope, distance from the river, population density, and land use land cover factors were selected to produce a malaria risk map of the Didessa district area. GIS based multi-criteria evaluation method applied using weighted overlay analysis by considering three map layer factors (i.e. malaria hazard map layer, element at risk map layer, and vulnerability map layer), an optimum malaria risk map is produced. The malaria risk map result shows that 0.68%, 36.2%, 30.1%, 27.52% 5.5% of the study area falls under very high, high, moderate, low, and very low spatial malaria risk levels respectively. Our findings indicate that malaria is heavily influenced by major environmental parameters and socio-economic factors and these factors play a vital role either directly or indirectly in the occurrence of this vector-borne disease. In conclusion, 36.88% (31034.88 ha) of the study area has a high potential risk of malaria disease manifestation and occurrence. The result of this report indicates that there are high malaria risk areas in the district. This ascertains the communities living in those areas are prone to the disease. Therefore, there is an urgent need to prevent and progressively reduce malaria disease distribution through policy formulation and health care implementation in prioritized areas. This study is useful to use as a guideline for further research study in combating malaria distribution, particularly in developing countries.
PUBLIC INTEREST STATEMENT
Malaria is one of the most epidemic diseases and affecting many millions of people in sub-Sahara Africa and particularly, Ethiopia. The objective of this research was to assess the spatial distribution of malaria risk in the Didessa district, southwest of Ethiopia. GIS-based MCE method is applied to produce an optimum spatial malaria risk map by considering different factors (e.g. temperature, rainfall, altitude, slope, distance from the river, population density, and land use land cover). Therefore the result of the spatial distribution malaria risk map shows that 36.88 % (31034.88 ha) of the study area has a high potential risk of malaria disease manifestation and occurrence. This asserts that the area requires imideiate progressive attention to control and prevent the rsik of malaria diseases occurrence. The result of this report is useful for planning and implementing malaria intervention work and facilitating health centers to minimize the impacts of malaria disease in the district.
Competing Interests
The authors declare that they have no competing interests.
1. Introduction
Malaria is a mosquito-borne infectious disease of humans and other animals caused by parasites belonging to the genus Plasmodium and introduced into the circulatory body system by the bite from an infected female anopheles mosquito (Mwangangi et al., Citation2013). Human malaria is one of the most widespread vector-borne diseases that are endemic throughout tropical and subtropical regions of the world especially around the equator (Ahmad et al., Citation2011). Plasmodium falciparum, Plasmodium vivax, Plasmodium malariae, and Plasmodium ovale are human malaria species that are spread from one person to another. There are about 400 different species of Anopheles mosquitoes, but only 30 of these are the major important vectors (World Health Organization, Citation2015). Malaria remains a major public health problem in many countries of the world. Despite the progress in reducing malaria cases and deaths, it is estimated that 214 million cases of malaria occurred worldwide in 2015 (Cruz-Coke, Citation2016). Plasmodium falciparum is most prevalent on the African continent and is responsible for most deaths from malaria. Plasmodium vivax has a wider geographical distribution than Plasmodium falciparum because it can develop by the Anopheles mosquito vector at lower temperatures, and can survive at higher altitudes and in cooler climates (World Health Organization, Citation2015). The distribution of the Plasmodium Vivax is concentrated in the horn of Africa including Ethiopia, Djibouti, Somalia, and Sudan, and South Sudan (Jamison et al., Citation2006). In Ethiopia, the problem is particularly severe and it is the major cause of illness and death (Schabenberger & Gotway, Citation2017). (Cressie, Citation1992) discussed that, with 75% of the total area being malarious and approximately 68% of the Ethiopian population live in these affected areas. Annually, about 4 to 5 million Ethiopians are affected by malaria (FMoH, Citation2004). Malaria transmission in Ethiopia is seasonal, depending mostly on altitude and rainfall, with a lag time varying from a few weeks before the beginning of the rainy season to more than a month after the end of the rainy season (Deressa et al., Citation2003; Tulu, Citation1993). From an agroecological perspective, the highest malaria prevalence was reported from a study conducted on mixed regions of low lands and midlands while the least was from low lands (Deress & Girma, Citation2019).
Since malaria is a complex disease due to its multiple interactions among parasites, vectors, human hosts, and the environment, so it is fundamental to study and model these factors together to minimize the impacts of malaria on human health and the economy (FMoH, Citation2009). Climatic and topography factors, particularly rainfall, temperature, altitude, and slope are known to have a strong influence on the biology of mosquitoes’ manifestation and distribution (Afrane et al., Citation2007). GIS and remote sensing can be used to associate such variables and the distribution of mosquitoes responsible for malaria transmission. Other factors like population density, land-use/land-cover, and proximity to different malaria-causing or preventing factors can be also associated with the effect they do have on malaria prevalence. Hence it is advisable to develop a dynamic risk mapping for early warming and proactive operations in different parts of the country. Normally, the magnitude and incidence of malaria cases vary from village to village and from district to district (FMoH, Citation2012). It is always wise to study at a high spatial resolution for better understanding and to formulate a controlling mechanism to reduce and avoid unexpected loss of life.
Several studies have been conducted on malaria epidemic distribution in different parts of the country. However, many of the studies did not include all the necessary factors that could affect the distribution of malaria. (Addisu, Citation2012) and (Desalegn & Shewangizaw, Citation2015) have conducted on knowledge and perception of the community on malaria distribution prevention and control. However, they didn’t use a GIS-based MCE approach in their study. GIS methods integrated with MCE decision techniques are effective tools to quickly and easily use multiple environmental and social data to generate optimum malaria risk maps (Ahmed, Citation2014). It is useful to easily analyze secondary and primary large data. Using an interactive user-friendly computer-aided system. Therefore with minimum time and cost the malaria susceptibility and manifestation areas can be generated for possible intervention work (Rai et al., Citation2013).
Therefore, this study aimed to assess and map spatial malaria risk distribution using a GIS-based Multi-criteria decision modeling approach in Didessa district, southwest Ethiopia. This, in turn, would help to control and identify malaria hotspot areas using an interactive digital map for prevention and preparedness systems of the early warning and emergency response mechanism.
2. Materials and methods
2.1. Description of the study area
This study was conducted in the Didessa district, is one of the districts of Bunno Bedelle Zone, Oromia National Regional State. Administratively the district is divided into 31 rural kebeles and one town. It is located at a distance of 60 Km from the Zonal town (Bunno Bedele) and 420 Km from the capital city (Addis Ababa). Geographically, the Didessa district extends between 7° 59′ 14′′ to 8° 14′ 48′′ North and 36°16′ 56” up to 36° 49′ 21” East. It is bounded by the Gatira district in the west, Gechi in the North and Gummay district in the South, and Goma district in the east ().
Figure 1. Location map of the study area
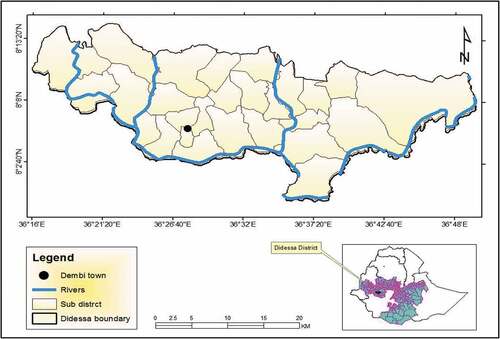
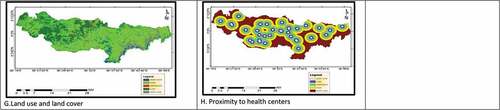
Agro-ecologically, the Didessa district is composed of highland (2300–3200 m), midland (1500–2300 m), and lowland (500–1500 m). The mean annual rainfall is 900–1000 mm and the mean daily temperature is 12–18°C. The mean annual temperature and rainfall are 20.7°C and 1800 mm respectively. There are two distinct seasons: the rainy season starting in late March and ending in October and the dry season occurring from November to early March. Generally, the district has highlands, mid-and low-land agro-ecologies, and its overall elevation range between 1335 and 2417 m.a.s.l (). The total population of the study area is 107,248 (CSA, Citation2005). About 99,740 of the population lives in rural areas and about 7508 live in urban areas. It has an estimated population density of 127.45 per square kilometer (). The main land use of the district is dominated by rain-fed agriculture, which is owned by smallholder farmers. Various crops, vegetables, livestock, oil crops, and coffee are under production. As it’s indicated in () a huge area is covered by farmland, followed by forest. The mid and the lowest elevation area of the study area is covered by water, there is one big river called Didessa and there are also about 12 small rivers, those small rivers are the tributaries of the main river. The district has one Hospital, 3 Health centers, 30 Health posts, and about 7 Clinics ().
Figure 2. Description map of study area. (a) Topographic structure of the study area. (b) Population density map. (c) Land use land cover map of the study area. (d) Spatial distributions of health institutions
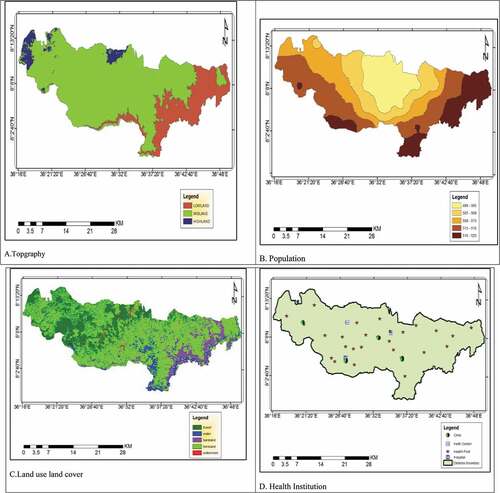
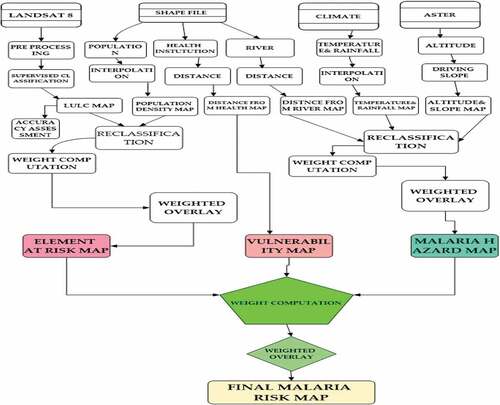
Figure 3. General frame work of the research study
2.2. Data types and sources
This study was based on a partially mixed sequential dominant status-quantitative or technical research design. This is because, as indicated in (Powell et al., Citation2008) quantitative and qualitative phases occur one after the other, with the quantitative phase being given higher priority and mixing occurring at the data interpretation stage. The quantitative phase of research was related to the identification and spatial assessment of the malaria risk factor. Whereas the qualitative data obtained from experts interviews and others were used to verify and validate the analysis results.
The most important data for this study are climate (temperature and rainfall) data, Thermal Emission and Reflection Radiometer (ASTER) DEM of 2017 to derive topographic data (altitude map), Land sat 8 satellite image of 2016 dry season was accessed freely to produce land use or land cover map of the study area. Both ASTER and Landsat 8 was obtained from the website http://www.earthexplorer.usgs.gov/. The primary sources of data are reconnaissance (field) survey and ground control truth points. The secondary data sources were obtained from different websites and organizations to assess and produce a malaria risk map of the Didessa district ().
Table 1. Different types of data sources and their resolutions
In this study different types of application soft wares and accessories were used for different types of activities in the process of generating malaria risk map, such as ERDAS IMAGINE 2014, Arc Map 10.5. Google Earth and Global Positioning System, Garmin 72 H were used for primary data collection (health institutions location point data).
2.3. Methods
In order to analyze and produce a malaria risk map, different socio-environmental factors analysis were considered, namely elevation, slope, river, temperature, rainfall, LULC, population density, and Health centers.
To produce a malaria risk map for the study area, the risk computation model (equation), which is developed by (Shook, Citation1997) was used.
“Hazard (H)” is the probability of occurrence of a potential damaging natural phenomenon within a specified period and a given area.
“Element at risk (E)” includes the population, buildings, and civil engineering works, economic activities, public services, utilities, and infrastructures, etc., at risk in a given area.
“Vulnerability (V)” is the exposure of a given element or set of elements at risk resulting from the occurrence of a damaging phenomenon of a given magnitude.
“Risk (R)” is the expected degree of loss due to a particular natural phenomenon. It may be expressed as the product of hazard (H), vulnerability (V), and element at risk (E).
To produce malaria hazard areas, some environmental factors (includes temperature, rainfall, elevation slope, and distance from rivers) were selected that affect malaria disease incidence based on related previous works (FMoH, Citation2009; FoMH, Citation2004). The malaria hazard area mapping was done by using the Multi-Criteria Evaluation (MCE) approach by reclassifying all the above factors and giving weight. MCE, in IDRISI software the selected factors were weighted according to their suitability for the vector mosquito and the prevalence of malaria, and then the overlay analysis was carried out using ArcGIS spatial analyst tool. The results of these processes provided us the malaria hazard map. To produce an element of at-risk map population density layer and LULC were reclassified based on the risk level of malaria and weighted for their relative importance. The final malaria risk map was produced from the malaria hazard layer, an element at risk layer, and a vulnerability map that was produced by reclassifying distance from health institutions layers. The general frame work of the study is presented in ()
2.3.1. Analytical Hierarchical Process (AHP)
AHP is a multi-criteria decision method that uses hierarchical structures to represent a problem and makes judgments based on experts to derive priority scales (Saaty & Vargas, Citation2001). This method is widely used in MCDM to obtain the required weightings for different criteria(Mendoza & Martins, Citation2006). It has been successfully employed in GIS-based MCDM since the early 1990s (Cressie, Citation1992). This approach enables us to compare different variants and rank the factors, criteria, and parameters according to their importance. The AHP method calculates the required weights associated with the respective criterion map layers with the help of a preference matrix, in which all relevant criteria identified are compared against each other based on preference factors. The weights can then be aggregated. GIS-based AHP has gained popularity because of its capacity to integrate a large quantity of heterogeneous data, and because obtaining the required weights can be relatively straightforward, even for a large number of criteria. It has been applied to a variety of decision-making problems (Chen et al., Citation2009; Feizizadeh & Blaschke, Citation2013).
According to (Chikodzi, Citation2013), the AHP was used to obtain the mapping weight or importance of each malaria risk factor. The process of deriving the weights of each factor involved the following steps:
Formulation of a pairwise comparison matrix for each of the eight input parameters.
Establishment of the relative weights of each input parameter.
Checking for consistency in the pairing process.
The risk factors do not have the same role and weight in the modeling of the final malaria risk zones. So, to designate the importance of each parameter, he has weighted them using a pairwise comparison method which is one of the components of AHP. To assist in the weighting process of the pairwise matrix, Saaty’s pairwise comparison table () was used in the research.
Table 2. Saaty’s pairwise comparison table with 9 degrees
After computing the pairwise matrix, a measure of consistency was used to check if the matrix was derived at an acceptable level of consistency. EquationEquations (2)(2)
(2) and (Equation3
(3)
(3) ) (Saaty & Vargas, Citation2001) shows how the consistency index was calculated:
Where CI is a consistency index, CR is a consistency ratio, it uses to aid the decision on revising the matrix or not. CR is a random index, it is the ratio of the CI to the so-called random index(RI) which is a CI of randomly generated matrices. n is the dimension of the comparison matrix, lambda max is the maximum eigenvalue of the comparison matrix. The consistency of a pairwise matrix is interpreted in . It is important to understand and measure the consistency ratio and assure its value is correct. The main objective is to make sure that the original preference ratings were consistent. There are three major steps required to reach at the consistency ratio. i.e. calculate the consistency measure, calculate the consistency index (CI), then calculate the consistency ratio (CI/RI), where RI is a random index (EquationEquation 2(2)
(2) ).
Table 3. Consistency index interpretation (Saaty & Vargas, Citation2001)
To derive the exact weighting for each parameter map, the matrix was raised to large powers and summing each column and dividing each by the total sum of all the columns, or by adding each column of the matrix and dividing by their total. The total weight of the entire factors must add up to 1 and range from 0.01–1(Ahmed, Citation2014). In the index overlay method, each of the input maps is allocated a weight as well as every class and spatial units existing in each factor map. In other words, the different classes on a single map have different weights and each parameter map also has its own weight. The method produced the final malaria risk map by summing up all the input parameter maps after each had been multiplied by its overall weight (EquationEquation 4(4)
(4) ) (Gamage-Mendis et al., Citation1991).
Where:
Wi = The weight of ith factor map
Sij = The ith spatial class weight of jth factor map
S = The spatial unit value in the output map.
2.3.2. Weighted overlay analysis
A weighted overlay is a technique for applying a common measurement scale of values to diverse and dissimilar inputs to create an integrated analysis. To prioritize the influence of different factors or inputs to produce a malaria risk map using weighted overlay analysis uses an evaluation scale from 1 to 9. For example, a value of 1 represents the least suitable factor in evaluation while a value of 9 represents the most suitable factor in evaluation (Janssen & Rietveld, Citation1990). The model results of the overlay analysis are presented in Appendix 1.
2.3.3. Environmental and social data analysis
The temperature and rainfall map of the study area was generated from world climate data. The average monthly rainfall and temperature of the 30 years were overlaid by the spatial analyst of Arc GIS weighted sum tools (Akkala, Citation2010). There are various interpolation methods, but in this study kriging interpolation which works well in geosciences when the data is sparse and assumes that the spatial variation of a continuous attribute is difficult to model by a simple function due to the irregular data distribution (Sluiter, Citation2009). Both the derived temperature and rainfall data were reclassified common measurement scale of 1 to 5 by 1, 1 implies a very low level and 5 vice versa. Generally, when Temperature increase, the period of the saprogenic cycle will be shorted (Ahmed, Citation2014; FMoH, Citation1999). Even though an increase in temperature and rainfall increases mosquito breeding, it should be known that this is up to some maximum limit beyond which the relationship could be reversed. High rainfall destroys mosquito larvae from their stable habitats (Alemayehu, Citation2011). Land use and land cover types of area are important risk factors for malaria transmission. Places of croplands, grasslands, bare, urban settlements and water bodies were classified as high-risk areas. Places classified as shrublands, mosaic vegetation cover were deemed to be of moderate risk while those under forests were classified as low risk (Chikodzi, Citation2013). LULC (Land use land cover change) layer was reclassified into five classes based on the order of susceptibility to be suitable for mosquito breeding sites, source of food, and use as a shelter from a climatic condition for the vector mosquito. Thus, the new values were assigned to each as 1, 2, 3, 4, and 5. The value 5 was assigned for a water body, 4 assigned for farmland value 3 for settlement, value 2 forests, and 1 for bare land.
The gross population density calculation method is used to calculate the number of persons per square kilometer. The population shapefile of Ethio-GIS data x and y coordinate of the Oromia regional states was calculated from attributes. The population density reclassification is based on the assumption that the denser the population, the more it will be at risk of malaria(Wondim et al., Citation2017).
There is a proven relationship between increasing altitude and decreasing mosquito abundance in many parts of Africa (Ebi et al., Citation2005). The elevation map is reclassified into five classes (Crees & Mhlanga, Citation1985).
Slope together with rainfall amounts received at a place can influence the spread of malaria. Areas on flat ground are most likely to accumulate and dam rainwater thereby increasing the risk of malaria (Freeman, Citation1995). Since stagnant water is a great breeding ground for mosquitoes, low slopes are more likely to have a higher risk of malaria because it allows water to pool. It was also reclassified into five categories.
One of the various water bodies which are used for mosquito breeding is river (Negassi, Citation2008). For breeding, Mosquito needs stagnant or slow-moving water to lay its eggs and to complete its life cycle to be an adult. Unlike other water bodies, the river is not conducive to this since it disturbs and destroys the eggs and larvae during the downslope movement. But when the water is diverted from rivers for different purposes and in case of flood inundations it decreases its speed and becomes comfortable for mosquito egg-laying. This condition may affect a particular area by increasing mosquito breeding sites and malaria prevalence (Ra et al., Citation2012). Proximity to rivers will be generated by using Euclidean distance in spatial analyst tools of ArcMap. According to Christian and Hans (Kaufmann & Briegel, Citation2004; Van der Hoek et al., Citation2003), the maximum flight range of Anopheles mosquitoes is 2 km. Thus, based on the flight range of mosquito the study area was reclassified into five and these classes were assigned new value 5, 4, 3, 2, and 1, based on malaria risk levels, these classes: 0–500 m, 500 m- 1000 m, 1000 m- 3000 m, 3000 m—4000 m and 4000 m—8176 m was labeled as very high (short distance), high, moderate, low, and very low (long-distance) river-related malaria risk levels respectively.
Areas nearest to health institutions are less vulnerable to malaria risk than areas furthest from health institutions, for example, areas > 30 km, 24–30 km, 12–24 km, 6–12 km, 0–6 km distance were labeled with risk level as very high, high, moderate, low, very low respectively [30]. The proximity to health institutions was buffered by 500 m, 1000 m, 2000 m, 3000 m, and 20,000 m. The results of multiple ring buffers were clipped to the study area extent. After reclassifying into five classes the result < 500 m, 500 m to 1000 m, 1000 m to 2000 m, 2000 m to 3000 m, and >3000 m was labeled as very high, high, moderate, high, and very high respectively.
3. Results and discussions
3.1. Analysis of socio-environmental risk factors of spatial malaria risk occurrence
() malaria risk occurrence of temperature factor shows that from the total of the study area, 22720.77 ha (27%) and 14305.67 ha (17%) lie under very high and high levels of malaria risk areas respectively. 21037.75 ha (25%),12622.65 ha (16%), 13464.16 ha (15%), cover moderate, low, and very low levels of malaria risk respectively. This indicates that the temperature of the study area falls under a suitable temperature for mosquito breeding. (Afrane et al., Citation2007) also discussed in their research study that the development rate of immature mosquitoes is very much temperature-dependent and below 16°C, a malaria vector in most parts of Africa will completely stop, and the larvae will die in wet temperature below 14°C. () shows that 26086.81 ha (31%) 24403.79 ha (29%),18513.22 ha (22%),8415.1 ha (10%),6732.08 ha (8%) areas mapped as very high,high,moderate,low and very low malaria risk occurrence due to precipitation factor respectively. Thus, the result apparently shows that the rainfall situation of the district favor mosquito growth and development which favors malaria prevalence. The abundance of Anopheles mosquitoes is strongly affected by rainfall events. High precipitation increases water surfaces that harbor the malaria vector. Mosquitoes breed in standing waters such as freshwater pools or marshes and also in temporal and polluted water surfaces (Martens et al., Citation1999; De Silva & Marshall, Citation2012).
Figure 4. Malaria risk occurrence factors. (a) Temperature (b) Precipitation (c) Slope (d) Altitude (e) DTR (f) Population (g) Land use land cover (h) Proximity to health centers
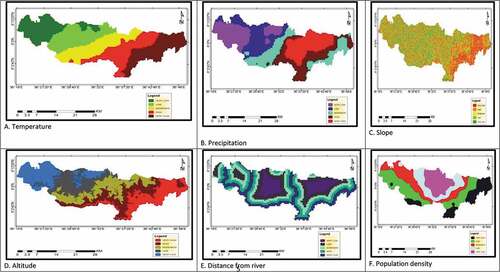
() indicates that 15635 ha (18.6%), 17671 ha (21%), 16815 ha (20%), 17542 ha (20.8), and 16488 ha(19.6%) mapped as very high, high, moderate, low, and very low of spatial malaria risk based on slope distribution respectively. The slope is one of the topography of the land plays an important role that inhibits or enhances the malaria breeding site in a certain locality. Sloped areas create poor mosquito breeding grounds, reducing the threat of malaria transmission (Burlando, Citation2012; Munga et al., Citation2006). This study finding is comparable with a study conducted by (Wondim et al., Citation2017)Y, in northern parts of Ethiopia, gentle slope areas mapped as high and areas in steep slope mapped as a low level of spatial malaria risk distribution.
() shows that 16844 ha (20%), 16850 ha (20.2%), 16861 ha (20%), 16861 ha (20%), and 16735 ha (19.8) mapped as very high, high, moderate, low, and very low malaria risk distribution due to altitudinal factor respectively. Altitude is generally considered to play an important role in limiting malaria in the tropical highlands by negatively influencing the breed of vector species [39]. The increased water run-off downstream and warmer temperature in lowlands makes low altitude areas a preferred breeding location for malaria parasite, however, according to (FMoH, Citation2009) malaria transmission in Ethiopia mainly occurs up to the 2000 meter elevation but can also occasionally affects areas up to 2300 m elevation. So depending on this idea the elevation map of the study area > 2300 was identified as the very low-risk level of spatial malaria risk distribution.
() shows that 28890 ha (34.3%), 27893 ha(33.1%), 19963 ha (23.7%), 6997 ha (8.3%), and 408 ha (0.5%) mapped as very high, high, moderate, low, and very low spatial malaria risk distribution as the distance from the river as risk factor respectively. Some study reports show that people who live close to rivers or water bodies are prone to high spatial malaria risk (Santos et al., Citation2016). Similarly, in this study areas closest to water bodies have a high spatial malaria risk distribution. This research study finding is also similar to the study conducted by (De Silva & Marshall, Citation2012), people living close to vector breeding sites are at higher risk of contracting malaria parasites than those living further away.
High population density areas that are prone to malaria manifestation may increase the rate of malaria risk (Kreuels et al., Citation2008). For instance, urban environments create complex socio-economic interaction and development conditions that would influence the transmission of vector-borne diseases due to unprotected water storage and poor waste disposal system(Santos et al., Citation2016). This is true in high-density slum areas of India (Santos et al., Citation2016). () shows that 14389.8 ha (17.1%), 23814.7 ha (28.3%), 17671.7 ha (21%), 13548.3 (16.1%), and 14726.4 ha (17.5%) of the study area mapped as very high, high, moderate, low and very low malaria risk level as population density as risk factor respectively. Malaria risk level identification is related to the assumption that a high population density more vulnerable to malaria risk compared to a low population density. Malaria incidence showed a strong correlation with population size and the area of the villages (Kreuels et al., Citation2008).
() indicates that 4913 ha (5.8%), 47391 ha (56.3%), 1720 ha (2%), 21991 ha (26%), and 8108 ha (9.6%) mapped as very high, high, moderate-low, and very low spatial malaria risk distribution level as land use land cover as malaria risk factor respectively. As stated in several types of research, different kinds of land cover indicate different types of residential areas suitable for various vectors (Zeng et al., Citation2006). It affects the temperature of larval habitats directly and food conditions and other factors indirectly, but the synergistic effects of these factors may be more significant to larval survivorship. Waterbody favors mosquito breeding to the level highly risk full for the local populations. Bush shrubland and acacia woodland in the study area favor mosquito breeding at a low level. Accordingly, areas of water bodies and farmland are classified as very high and high respectively. Land use/cover classification is not free from errors; errors may appear from the method of image capturing to the classification technique implemented. Therefore, LULC image classification accuracy assessment was done for spatial malaria risk distribution analysis. The overall classification accuracy is 95% and the Kappa coefficient is 0.936 %, which is acceptable for further analysis.
() shows,26652 ha (31.7%),24223 ha (28.8%),23594 ha (28%),7090 ha (8.4%),2592 ha (3.1%) mapped as very high,high,moderate,low and very low malaria risk level distribution as proximity to health center as a risk factor respectively. Access to health centers especially for children under the age of 5 has the potential of reducing significantly the number of malaria cases and death(Rutherford et al., Citation2010) [45]. Proximity to health institutions of the study area was considered as vulnerable since the areas furthest from the health set population to be vulnerable to malaria risk due to the absence of health institutions.
3.2. Analysis of spatial malaria hazard and risk level distribution using MCE
Hazard is the probability of occurrence of a potentially damaging natural phenomenon within a specified period and within a given area. As a hazard, malaria incidence is mapped by depending on some climate and environmental factors that create favorable conditions for the survival of mosquitoes. These factors include temperature, rainfall, elevation slope, and distance from rivers. The malaria hazard area mapping was done by using Multi-Criteria Evaluation (MCE) by reclassifying all the above factors and weighted overlay analysis in the ArcGIS environment using a spatial analyst tool after each factor was given the appropriate weight. The weights given for each climate and environmental factors are 23%, 38%, 18%, 15%, and 6% for temperature, rainfall, altitude, slope, and distance from rivers respectively. This study is parallel with the study conducted by (Emebet et al., Citation2016) using factors like rainfall, altitude, streams, temperature, swamps, and ponds were the predictors of the presence of malaria with percentage influence of 44%, 38%, 4%, 7%, and 7%, respectively. In this study also as compared to our study, climate and topographic factors have a high probability of a percentage of influence for malaria hazard level distribution. There is a high chance of malaria hazard occurrence in the east part of the study area ().
Figure 5. Spatial malaria risk level distribution (a) Malaria hazard (b) Element at risk (c) Malaria risk
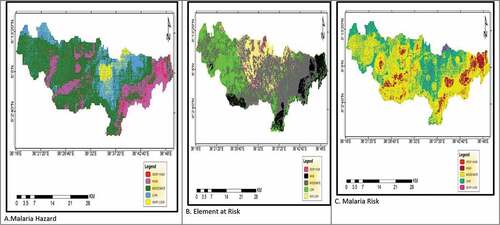
The relative weights of the element at risk factors were compared with each other by reviewing from literature and through discussing with malaria experts of the study area. Accordingly, 60% and 40% were given for LULC and population density factors respectively. Then both factors were overlaid in the ArcGIS environment to produce elements at risk map of the Didessa district. (), shows that 2.1%, 10.3%, 53.8%, 22.5%, and 11.3% of the total area, the malaria risk level is very high, high, moderate, low, and very low respectively. (Emebet et al., Citation2016) considered only LULC to produce elements at risk map of malaria but this study used population density and LULC to produce elements at risk map of the study area. This result also reveals that the eastern, some parts of the south, and the middle parts of the study areas would have a high chance of probability for malaria incidence and risk.
Malaria risk mapping which is based only on natural conditions is not sufficient to locate the malaria risk area but needs to include socio-economic factors that have a profound effect on the survival of the vector Anopheles mosquitoes. The basis for the production of the map is the risk computation model i.e. (Risk = Hazard * Element at Risk * Vulnerability).
The malaria risk map of the study area was produced and analyzed using weighted overlay methods. Therefore, Malaria hazard, the element at risk, and vulnerability layers were overlaid based on their weights. The corresponding weight assigned to each of the factors was computed which is based on the pairwise comparison of the three parameters. Accordingly, 40%, 20%, and 20% were given for malaria hazard, vulnerability, and element at risk respectively. Malaria risk map of the study area () shows 0.68% (572.2 ha), 36.2% (30462.7 ha), 30.1% (25329.5 ha), 27.52% (23158.4 ha) and 5.5% (4628.3 ha) risk level of very high, high, moderate, low and very low respectively. Hence, it is possible to conclude that from the total area of the district about 36.88% is under high and very high risk of malaria incidence. The risk level in this study was relatively lower than reported by (Arega, Citation2009) in Awassa Zuria and Wondogenet districts, which was more than 62 percent of the total area. In another study conducted by (Tiruneh, Citation2010) Boricha District, Sidama Zone more than 51percent of the total area has a high tendency of malaria risk incidence. The difference is in between the present study compared with (Arega, Citation2009) and (Tiruneh, Citation2010) study area could be due to the higher presence of wetlands, swampy areas, and small schemes irrigation activities in their study areas.
4. Conclusions
The results of this study indicated that the distribution of malaria is mainly attributed to different elements related to environmental, social, and economic factors. These factors contribute a significant role in the occurrence, and manifestation of vector born disease. The practical application of GIS techniques plays a massive role in spatial analysis for prior identification of potential areas for better disease control and effective management (Saxena et al., Citation2009). In this study, 36.88% (31034.88 ha) of the area in the Didessa district is highly prone to malaria incidence. The results of this study also in line with the study conducted by other researchers namely; (Arega, Citation2009) and (Tiruneh, Citation2010) who studied in the southern part of Ethiopia, where there is a high rate of malaria prevalence and incidence. Hence, we concluded from the produced malaria risk map that there is a high probability of malaria risk in the eastern and central parts of the study area. This study result will help the concerned stalk holders to instantly take a precaution measure in minimizing the expansion of the malaria epidemic particularly in typically developing countries like Ethiopia. Currently, the use of geospatial has grown in the field of epidemic assessment due to its fewer requirements of cost and time. It would help to absolutely identify and prioritize malaria-prone areas for mobilization of resources to tackle malaria disease incidences. (Carter et al., Citation2000) Had reported this strategy to minimize the transmission of a malaria epidemic. This research output provides guidelines to assess the progress of control and indicates which geographic area should be prioritized in the Didessa district to reduce and minimizes the effects of malaria on the community for the well-being of the socio-economic development of the region. The application of geoinformation to produce malaria risk or susceptibility area modeling is important to identify ahead of time in improving the healthcare facilities and it helps for early detection and to apply prompt response measures. Generally, this study only considered few socio-environmental factors, so it is advisable to recommend that in the future further study ought to include other factors for better malaria risk analysis of the study area.
Author contributions
SG contributed to the analysis and prepared and wrote the manuscript and reviewed. NT collected the data and analyzed it, AR participated in reviewing the research paper.
Consent for publication
Not applicable.
Ethics approval and consent to participate
Not applicable.
Acknowledgements
The authors would like to thank Jimma University for providing conducing facilities to conduct the research study.
Additional information
Funding
Notes on contributors
Sintayehu Legesse Gebre
Sintayehu Legesse Gebre is an assistant professor in Hydrology and water resource engineering at the Department of Natural resources management, Jimma University, Ethiopia. He has multidisciplinary academic background and professional experiences. He has an M.Sc degree in Irrigation Engineering, Arbaminch University, M.Sc in Earth and Environment (esp. in Hydrology and quantitative water management from Wageningen University, a post-graduate certificate in remote sensing and digital image processing from the University of Twente, The Netherlands, and a Post-graduate certificate in water technology from Antwerp University. Currently, he is a fellow researcher at KU Leuven University, Belgium. He has a research interest in optimization, irrigation water management, climate science, geospatial application, and hydrological modeling. Neserdin Temam was a researcher at Jimma University. Dr.Alemayehu Regassa is an associate professor in soil science at the department of Natural resources management, Jimma University.
References
- Addisu, J. (2012). Knowledge, attitude and practice of malaria prevention among communities of Burka Jalela kebele Didessa woreda, south west of Ethiopia. Jimma University.
- Afrane, Y. A., Zhou, G., Lawson, B. W., Githeko, A. K., & Yan, G. (2007). Life-table analysis of Anopheles arabiensis in western Kenya highlands: Effects of land covers on larval and adult survivorship. American Journal of Tropical Medicine and Hygiene, 77(4), 660–18. https://doi.org/10.4269/ajtmh.2007.77.660
- Ahmad, R., Ali, W. N. W. M., Nor, Z. M., Ismail, Z., Hadi, A. A., Ibrahim, M. N., & Lim, L. H. (2011). Mapping of mosquito breeding sites in malaria-endemic areas in Pos Lenjang, Kuala Lipis, Pahang, Malaysia. Malaria Journal, 10(1), 361. https://doi.org/10.1186/1475-2875-10-361
- Ahmed, A. (2014). GIS and remote sensing for malaria risk mapping, Ethiopia. International Archives of the Photogrammetry, Remote Sensing and Spatial Information Sciences - ISPRS Archives, 40(8), 155–161. https://doi.org/10.5194/isprsarchives-XL-8-155-2014
- Akkala, A. (2010). Development of artificial neural networks based interpolation techniques for the modeling and estimation of radon concentrations in Ohio. The Open Environmental & Biological Monitoring Journal, 4(August), 21–31. https://doi.org/10.2174/1875040001104010021
- Alemayehu, L. (2011). Gis and remote sensing based malaria risk mapping in Fentale Woreda, East Shoa Zone, Ethiopia. Addis Ababa University.
- Arega, D. G. (2009). Vulnerability analysis and malaria risk mapping in Awassa and Wondogenet Woredas. Ethiopia: Addis Ababa University.
- Burlando, A. (2012). The impact of malaria on education: Evidence from Ethiopia. SSRN Electronic Journal, (541),346–1351. https://doi.org/10.2139/ssrn.2164475
- Carter, R., Mendis, K. N., & Roberts, D. (2000). Spatial targeting of interventions against malaria. Bulletin of the World Health Organization, 78(12), 1401–1411. https://doi.org/10.1590/S0042-96862000001200007
- Chen, Y., Yu, J., & Shahbaz, K. (2009). A GIS-based sensitivity analysis of multi-criteria weights. In 18th World IMACS/MODSIM congress (pp. 13–17). Cairns, Queensland,Australia.
- Chikodzi, D. (2013). Spatial modelling of malaria risk zones using environmental, anthropogenic variables and geographical information systems techniques. Journal of Geosciences and Geomatics, 1(1), 8–14. https://doi.org/10.12691/jgg-1-1-2
- Crees, M. J., & Mhlanga, C. (1985). Malaria prevalence in Zimbabwe and parasite survey of 1983. Zim Sci News, 19(1), 114–117.
- Cressie, N. (1992). Statistics for spatial data. Terra Nova, 4(5), 613–617. https://doi.org/10.1111/j.1365-3121.1992.tb00605.x
- Cruz-Coke, R. (2016). (WHO, World Malaria Report 2016). World Health Organization. https://doi.org/10.4135/9781452276151.n221
- CSA. (2005). National census 2005.Addis Ababa,Ethiopia: Ethiopian Central Statistical Agency.
- De Silva, P. M., & Marshall, J. M. (2012). Factors contributing to urban malaria transmission in sub-Saharan Africa: A systematic review. Journal of Tropical Medicine, 2012(1), 1–10. https://doi.org/10.1155/2012/819563
- Deress, T., & Girma, M. (2019). Plasmodium falciparum and Plasmodium vivax Prevalence in Ethiopia: A systematic review and meta-analysis. Malaria Research and Treatment, 2019(1), 12. https://doi.org/10.1155/2019/7065064
- Deressa, W., Ali, A., & Enqusellassie, F. (2003). Self-treatment of malaria in rural communities, Butajira, southern Ethiopia. Bulletin of the World Health Organization, 81(4), 261–268. https://doi.org/10.1590/S0042-96862003000400007
- Desalegn, A., & Shewangizaw, A. (2015). Assessment of knowledge, attitude and practice towards malaria prevention and control among Assosa woreda communities, Benishangul gumuz region al state, western Ethiopia. Wjpls, 1(1), 117–134.
- Ebi, K. L., Hartman, J., Chan, N., McConnell, J., Schlesinger, M., & Weyant, J. (2005). Climate suitability for stable malaria transmission in Zimbabwe under different climate change scenarios. Climatic Change, 73(3), 375–393. https://doi.org/10.1007/s10584-005-6875-2
- Emebet, D., Suryabhagavan,K.V., & M. Balakrishnan,M. (2016). Malaria-risk assessment using geographical information system and remote sensing in © Indian Society of Geomatics. Geomatics, 10(1), 55–64.
- Feizizadeh, B., & Blaschke, T. (2013). Land suitability analysis for Tabriz County, Iran: A multi-criteria evaluation approach using GIS. Journal of Environmental Planning and Management, 56(1), 1–23. https://doi.org/10.1080/09640568.2011.646964
- FMoH. (1999). Malaria and other vector-borne diseases prevention and control unit: Guidelines for malaria epidemic prevention and control in Ethiopia. Ethiopian Ministry of Health.
- FMoH. (2004). Federal Ministry of Health: Guideline for malaria epidemic prevention and control in Ethiopia (2nd ed.). Ministry of Health.
- FMoH. (2009). National strategic plan for malaria prevention, control and elimination in Ethiopia 2010 – 2015.Ethiopian Ministry of Health.
- FMoH. (2012). National malaria guidelines.Ethiopian Ministry of Health.
- FoMH. (2004). Diagnosis and treatment guidelines for health workers in Ethiopia 2nd Edition In Health (San Francisco) (2nd ed.). Federal Ministry of Health.
- Freeman, T. W. (1995). Binga District - Base line survey of the malaria situation. UK: Save The Children.
- Gamage-Mendis, A. C., Carter, R., Mendis, C., De Zoysa, A. P. K., Herath, P. R. J., & Mendis, K. N. (1991). Clustering of malaria infections within an endemic population: Risk of malaria associated with the type of housing construction. American Journal of Tropical Medicine and Hygiene, 45(1), 77–85. https://doi.org/10.4269/ajtmh.1991.45.77
- Jamison, D. T., Feachem, R. G., Makgoba, M. W., Bos, R.E., Baingana, K.F., Hofman J.K. &Rogo, O.K. (2006). Disease and mortality in Sub-Saharan Africa (2nd ed.). The International Bank for Reconstruction and Development/The World Bank.
- Janssen R., &Rietveld P. (1990) Multicriteria analysis and geographical information systems: an application to agricultural land use in the netherlands. In: Scholten H.J., Stillwell J.C.H. (eds) Geographical Information Systems for Urban and Regional Planning. The GeoJournal Library, vol 17. Springer, Dordrecht. https://doi.org/10.1007/978-94-017-1677-2_12
- Kaufmann, C., & Briegel, H. (2004). Flight performance of the malaria vectors Anopheles gambiae and Anopheles atroparvus. Journal of Vector Ecology: Journal of the Society for Vector Ecology, 29(1), 140–153. http://www.ncbi.nlm.nih.gov/pubmed/15266751
- Kreuels, B., Kobbe, R., Adjei, S., Kreuzberg, C., von Reden, C., Bäter, K., Klug, S., Busch, W., Adjei, O., & May, J. (2008). Spatial variation of malaria incidence in young children from a geographically homogeneous area with high endemicity. The Journal of Infectious Diseases, 197(1), 85–93. https://doi.org/10.1086/524066
- Liu, X., Zeng, W., Cui, X., Liu, X., Cui. H., & Wang, P. (2006). Remote Sensing and GIS for Identifying and Monitoring the Environmental Factors Associated with Vector-borne Disease: An Overview. IEEE International Symposium on Geoscience and Remote Sensing, pp. 1443–1446. Denver, CO. doi:10.1109/IGARSS.2006.372
- Martens, P., Kovats, R. S., Nijhof, S., De Vries, P., Livermore, M. T. J., Bradley, D. J., COX, J., & McMichael, A. J. (1999). Climate change and future populations at risk of malaria. Global Environmental Change, 9(SUPPL.), S89-S107. https://doi.org/10.1016/S0959-3780(99)00020-5
- Mendoza, G. A., & Martins, H. (2006). Multi-criteria decision analysis in natural resource management: A critical review of methods and new modelling paradigms. Forest Ecology and Management, 230(1–3), 1–22. https://doi.org/10.1016/j.foreco.2006.03.023
- Munga, S., Minakawa, N., Zhou, G., Mushinzimana, E., Barrack, O. O. J., Githeko, A. K., & Yan, G. (2006). Association between land cover and habitat productivity of malaria vectors in western Kenyan highlands. American Journal of Tropical Medicine and Hygiene, 74(1), 69–75. https://doi.org/10.4269/ajtmh.2006.74.69
- Mwangangi, J. M., Muturi, E. J., Muriu, S. M., Nzovu, J., Midega, J. T., & Mbogo, C. (2013). The role of Anopheles arabiensis and Anopheles coustani in indoor and outdoor malaria transmission in Taveta District, Kenya. Parasites & Vectors, 6(114), 1–9. https://doi.org/10.1186/1756-3305-6-114
- Negassi, F. (2008). Identifying, mapping and evaluating environmental factors affecting malaria transmission using GIS and RS in selected Kebeles of Adama district, Oromia Region. Ethiopia: Addis Ababa university.
- Powell, H., Mihalas, S., Onwuegbuzie, A. J., Suldo, S., Daley, C. E.,(2008). Mixed methods research in school psychology: A mixed methods investigation of trends in the literature. Psychology in the Schools, 45(4), 291–309. https://doi.org/10.1002/pits.20296
- Ra, P. K., Nathawat, M. S., & Onagh, M. (2012). Application of multiple linear regression model through GIS and remote sensing for malaria mapping in Varanasi District, INDIA. Health Science Journal, 6(4), 731–749.
- Rai, P. K., Nathawat, M. S., & Rai, S. (2013). Using the information value method in a geographic information system and remote sensing for malaria mapping: A case study from India. Informatics in Primary Care, 21(1), 43–52. https://doi.org/10.14236/jhi.v21i1.38
- Rutherford, M. E., Mulholland, K., & Hill, P. C. (2010). How access to health care relates to under-five mortality in sub-Saharan Africa: Systematic review. Tropical Medicine and International Health, 15(5), 508–519. https://doi.org/10.1111/j.1365-3156.2010.02497.x
- Saaty, T. L., & Vargas, L. G. (2001). Models, methods, concepts, and applications of the analytic hierarchy process. Kluwer Academic Publishers.
- Santos, V. M., Bouma, M. J., Kohli, V., & Pascual, M. (2016). Population density, climate variables and poverty synergistically structure spatial risk in urban Malaria in India. PLoS Neglected Tropical Diseases, 10(12), e0005155. https://doi.org/10.1371/journal.pntd.0005155
- Saxena, R., Nagpal, B. N., Srivastava, A., Gupta, S. K., & Dash, A. P. (2009). Application of spatial technology in malaria research & control: Some new insights. Indian Journal of Medical Research, 130(2), 125–132.
- Schabenberger, O., & Gotway, C. A. (2017). Statistical methods for spatial data analysis. Statistical Methods for Spatial Data Analysis. Texts in Statistical Science (1st ed.). CRC Press. https://doi.org/10.1201/9781315275086
- Shook, G. (1997). An assessment of disaster risk and its management in Thailand. Disasters, 21(1), 77–88. https://doi.org/10.1111/1467-7717.00045
- Sluiter, R.(2009). Interpolation Methods for Climate Data: Literature Review. KNMI, R&D Information and Observation Technology De Bilt, International report; IR 2009-04
- Tiruneh, A. (2010). GIS and remote sensing based assessment of malaria risk mapping for Boricha Woreda, GIS and remote sensing based assessment of malaria risk mapping for Boricha Woreda, Ethiopia. Ethiopia: Addis Ababa University.
- Tulu, N. (1993). Malaria: In the ecology of health and disease in Ethiopia (2nd ed.). Westview Press Inc.
- van der Hoek, W., Konradsen, F., Amerasinghe, P. H., Perera, D., Piyaratne, M. K., & Amerasinghe, F. P. (2003). Towards a risk map of malaria for Sri Lanka: The importance of house location relative to vector breeding sites. International Journal of Epidemiology, 32(2), 280–285. https://doi.org/10.1093/ije/dyg055
- Wondim, Y. K., Alemayehu, E. B., & Abebe, W. B. (2017). Malaria hazard and risk mapping using GIS based Spatial Multicriteria Evaluation Technique (SMCET) in Tekeze Basin Development Corridor, Amhara Region, Ethiopia. Journal of Environment and Earth Science (JEES), 7(5), 76–87. https://www.researchgate.net/publication/331555980_Malaria_Hazard_and_Risk_Mapping_Using_GIS_Based_Spatial_Multicriteria_Evaluation_Technique_SMCET_in_Tekeze_Basin_Development_Corridor_Amhara_Region_Ethiopia
- World Health Organization. (2015). (World Malaria Report 2015: Annex 1).
Appendix
1.Aggregating criteria weights and Overlay analysis
A. Malaria Hazard Factors
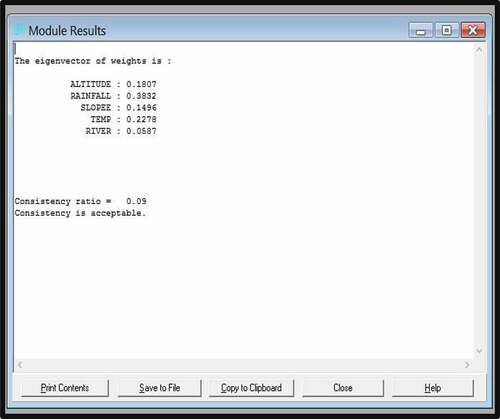
The malaria hazard as composed of some major environmental and climate factors including temperature, rainfall, altitude, slope, and distance from rivers was rated for their relative importance on IDRISI Selva 17.0 decision support system based on Pairwise Comparison 9 Point Rating Scale. The value assigned for each of them is based on the level of their influence on malaria prevalence relative to each other. the weights were computed on AHP weight derivation and then the consistency ratio’s acceptability of the eigenvector weights was checked as it’s described in figure Appendix 1and Appendix 2 respectively
Figure A1. Malaria hazard AHP weight derivation
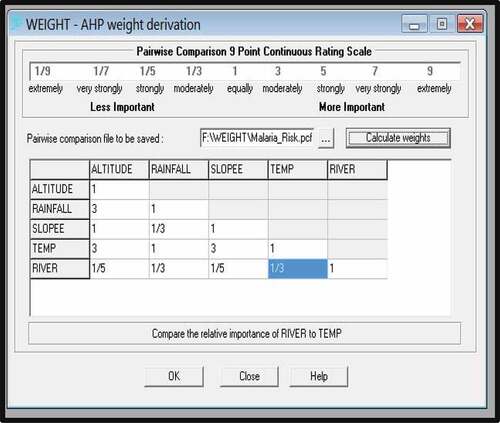
Figure A2. Modle results of malaria hazard risk factors weight description
B. Element at Risk Factors
LULC and population density were rated for their relative importance based on previous works with the contribution of the malaria expert. The value assigned for each of them is based on the level of their influence on malaria prevalence relative to each other accordingly 60% and 40% assigned for LULC and population density respectively. Weighted overlay analysis was carried out to produce element at risk map of the study area.
C. Final Malaria Risk Mapping
Malaria hazard, element at risk, and vulnerability (proximity to health institutions reclassified) were rated for their relative importance on IDRISI Selva 17.0 decision support system based on Pairwise Comparison 9 Point rating Scale. The value assigned for each of them is based on the level of their influence on malaria prevalence relative to each other. These were reviewed from prior researches and through discussion with malaria experts working in the study area. Here one should consider that different factors‟ influence level may vary from place to place so that the local condition should be considered carefully before deciding for their relative influence.
Accordingly, the weight was computed on AHP weight derivation and then the consistency ratio’s acceptability of the eigenvector weights was checked as indicated in figure Apendix 3 and 4 respectively.
Figure A3. Malaria risk map AHP weight derivation
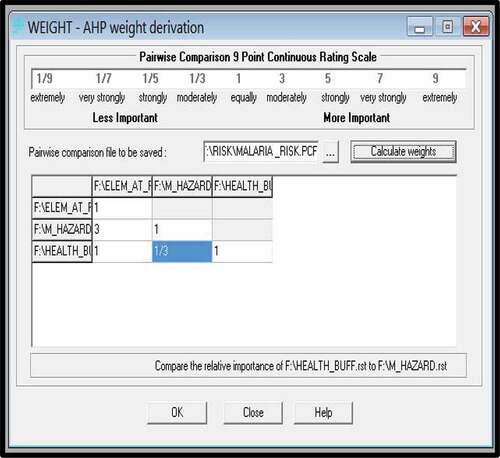
Figure A4. Module results of overall malaria risk factors weight description
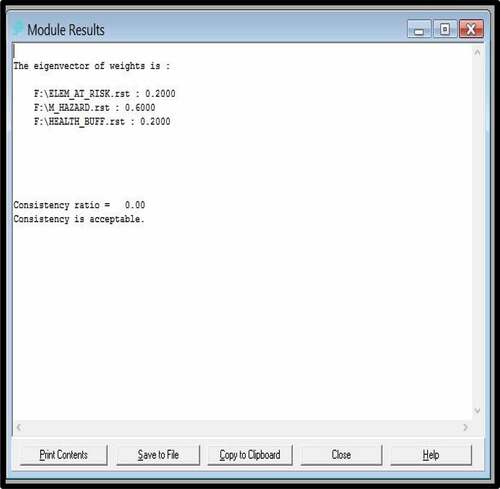
The consistency ratio is 0.00, which shows that judgments are perfectly consistent and acceptable as it is consistency ratio is 0. These values were used in the ArcGIS environment of spatial analyst tool for weighted overlay analysis to produce the final malaria risk map of the Didessa district. The eigenvector weights of each factor both on malaria hazard and malaria risk map were multiplied by 100 for Overlay analysis on ArcGIS environment.