Abstract
Every sound is made up of pitch, intensity and length (P, I and L). These universal parameters work together to give a sound its sensation. This paper presents a case of using P, I and L, and a hypothetical measure, “SC” (“Stress Composite”), to appraise the effect of prosodic training. The main question this paper explores is whether or not a training activity can cause P, I and L to vary in certain ways. The research is set in a “singing classroom”, which is an ideal context for learners to exercise their P, I and L. The research instruments included a perception test and a production test. Two major findings were yielded: First, while the learners judged pitch variation to be important, they relied on length variation when encoding prosody. Second, singing did not alter the fact that length variation was a dominant encoder, and pitch only came second to length. These findings can lead to several interpretations. They may indicate that singing could affect prosody in other ways, but not how P, I and L are varied in the voice; or, indeed, they may point to a “normal” way of encoding speech. The current method of analysis has implications for prosodic assessment. The mismatched results between the learners’ perception and production of P, I and L will be explained, and the potential use of the SC measure is discussed.
Public Interest Statement
Every sound a human makes can be quantified in terms of its pitch level and intensity (loudness), and the length of its production. This research asks whether or not examining the changes in these small parts of a sound enables a teacher to understand how a learner uses his or her voice in different teaching situations. The teaching situation in question was a singing classroom involving 32 Cantonese learners. The results do not suggest that singing can significantly alter how one uses his or her voice. Instead, they reveal a pattern of how the voice is “usually” used: People used length variation the most, followed by pitch and intensity variations. This result counters our expectation that pitch variation is the most important quality during speaking. Furthermore, the paper demonstrates how an “all-in-one” measure, Sc, can be used to quantify voice changes, and therefore be useful in a singing classroom.
1. Assessing prosody through pitch, intensity and length
This paper proposes a case of using “stress cues”Footnote1, pitch, intensity and length (P, I and L), to assess the effect of a prosodic training activity: singing. These three dimensions correspond to the acoustic parameters of a sound wave: fundamental frequency (number of vibrations), amplitude (height of vibrations) and duration (Roederer, Citation2008). Although all three parameters contribute to the sensation of a sound (e.g. Cruttenden, Citation1997; Fry, Citation1979; Ladefoged, Citation2003; Rogerson-Revell, Citation2011), the ways in which they are “distributed” in a sound has not been thoroughly explored. For example, a low-pitched sound can be quite loud (such as “thump!”), a long sound can be low-pitched (e.g. a mooing cow) and a high-pitched sound may not be loud (e.g. a hissing snake). These are some rough-and-ready descriptions of sounds; the composition of a sound can be determined via speech analysis software, such as Praat (Boersma & Weenink, Citation2016). It is generally uncontested that pitchFootnote2 is the most effectiveFootnote3 way of eliciting a stress sensation (e.g. a high-pitched siren), while intensity and length are less effective than pitch (e.g. Chun, Citation2002; Fry, Citation1979; Hirst & Di Cristo, Citation1998; Pennington, Citation1996). Pitch variation is also the main property used to distinguish tones (e.g. a level tone and a high-rise tone carry different pitches) (Roach, Citation2009). Pitch variation over a stretch of speech, rather than variations in intensity or length, dictate an intonation movement (e.g. Pierrehumbert & Hirschberg, Citation1990). As far as speech perception is concerned, pitch is an important cue, but little is known about whether or not pitch variation is used at an all-time high level in speech production, compared with intensity or length variation (fewer acoustic phonetics studies have employed a production test; those that did include Lieberman (Citation1960) and Zhang, Nissen, and Francis (Citation2008); however, they did not directly compare P, I and L like the present study did).
Given that a sound is pluri-acoustic in nature (consisting of P, I and L), this research asks whether or not knowing the changing variations of P, I and L in one’s voice before and after singing may inform how the voice reacts to the training activity. Since this research examines the holistic quality of a sound, the rest of the paper shall refer to the object of investigation as “prosody” or “prosodic change”, rather than “intonation”, which suggests pitch changes only. Prosody is the “backbone of speech, providing the structure that links the individual sounds to one another and to the linguistic substrate” (Eskenazi, Citation2009, p. 0.837; italics added). Prosody represents the “collective outcome” of various inner contributing systems, including vowel quality, lexical stress, pitch change (intonation) and rhythm (e.g. Chun, Citation2002; Crystal, Citation1969; Pennington, Citation1996; Trask, Citation1996). To assess the prosodic effects of singing, the present researcher employed a reading (production) test before and after the singing activity. A comparison of the pre- and post-singing results will make evident whether or not singing caused noticeable changes to the learners’ voices in terms of their use of P, I and L variations. Second, the learners also undertook a perception test, in which they judged whether or not P, I and/or L were effective stress signals. The perception–production relationship reveals whether or not the way in which they used their voices could be explained by their perceptual preferences.
2. Creation of the “Stress Composite” (“SC”) metric
There is one problem with referring to P, I and L variations; doing so will inevitably lead the reader to focus on the individual quality of P, I and L, rather than seeing them as reinforcing each other in the shaping of a sound (see references in the last Section). In fact, there is no known “metric” that will describe the “final quality” of this mix (one can examine general phonetics or acoustic phonetics texts, e.g. Ladefoged and Johnson (Citation2011)). This creates a further problem for pronunciation teaching. If a teacher only asks a learner to pay attention to a certain technique (e.g. lowering and raising her pitch), such a description may be incomplete, since the other two aspects, I and L, are not considered. Ladefoged (Citation2003, p. 93) and Levis (Citation1999, p. 43) also caution against treating pitch as the only means of producing stress, as, in many cases, length is substitutable. Combining the factors (P, I and L) in some way may be desirable in obtaining a more accurate description of a sound.
A second problem with a lack of a metric is that there is no reasonable way to figure out how P, I and L variations contribute to the sensation of prosody (i.e. the aim of this study). On what basis can a researcher determine the relative importance of P, I and L variations if one cannot confirm what they result in? In this connection, the present research proposes to multiply the P, I and L of a syllable to compute the “Stress Composite” measure (or “SC” below). The use of a multiplication is to recognise that these forces might enhance, subtract, or trade off one another (e.g. Liu & Samuel, Citation2004, p. 112), as well as due to a mathematical consideration that the different units of measurement (i.e. Hz, dB and seconds) are best combined with a multiplication. To illustrate this with an example: A “high-pitched long sound” is qualitatively different from a “high-pitched short sound”; therefore, length can severely subtract the magnitude of the latter sound, and the difference can be readily perceived by a normal hearer. “SC” is used in this paper as an index of a sound’s overall magnitude, which is caused by both the shape of a wave form (i.e. frequency of vibrations, “P”, and their heights, “I”), and how far it travels (“L”). The changing magnitudes over a series of sounds constitute a prosodic contour.
In summary, the SC measure (P × I × L) serves two purposes: It allowed the present singing instructor to display an “all-in-one” contour to be used in the singing session (see Section 6.3). The SC also addresses the second problem (last paragraph). It enabled the present researcher to inspect how P, I and L were distributed in the learners’ voices through regression analyses (P, I and L as “predictor variables” and SC as a “dependent variable”; see Section 6.3). The relative importance of P, I and L variations can now be determined.
3. The case of singing and its predicted effects
The choice of singing for this study is not coincidental. The present research considers a singing session as a natural context for practising P, I and L, one for which a contour that can be visualised is needed (one can imagine that the need to refer to a contour would be diminished, when, for example, one is to practise speaking for a PowerPoint presentation). Singing promotes an “engaging”, “lively” way of using language, and provides a natural reason for choral repetition without causing too much boredom. As a popular language arts activity, singing has wide appeal in public domains (e.g. websites), news reports and teacher-oriented literature; it is often believed to be a good way to introduce melodic sound patterns to learners (e.g. Brown, Citation2012; Celce-Murcia, Brinton, & Goodwin, Citation2010; Kenworthy, Citation1987). A search of the literature on the “effects of singing” returns these benefits: improving “rhyming scheme”, “fluency”, “stress patterns”, “intonation” and “rhythm”, among other benefits (e.g. Gan & Chong, Citation1998; Iwasaki, Rasinski, Yildirim, & Zimmerman, Citation2013; Paquette & Rieg, Citation2008). Yet, this teaching literature seldom suggests ways to measure these many benefits of singingFootnote4. To date, most empirical studies involving the use of songs and experimental setups have focused on how songs aid lyric recall. Mixed results have been reported. Some studies have produced clear, affirmative evidence of mnemonic effects (e.g. Good, Russo, & Sullivan, Citation2015; Ludke, Ferreira, & Overy, Citation2014; Wallace, Citation1994); some have produced partial support, such as evidence to suggest that music has no immediate effect but a delayed effect (e.g. Medina, Citation1990; Rainey & Larsen, Citation2002); others (e.g. Lehmann & Seufert, Citation2018; Racette & Peretz, Citation2007) have found that music does not possess any mnemonic effects. One study with a stronger focus on pronunciation is that of Good et al. (Citation2015), who analysed learners’ production of vowels and consonants after 400 minutes of singing training. Singing to the lyrics was found to be more favourable in regard to the pronunciation of vowels than simply asking learners to say the lyrics out loud; neither singing nor speaking had any effect on improving the pronunciation of consonant sounds. Overall, these experimental studies focused on rather tangible outcomes of using songs; the implicit prosodic changes occurring in the voice, such as those this study intends to measure, are largely unexplored.
To undertake the current analysis, the researcher will start with a basic assumption about singing: A melody exhibits a rich array of prosodic information for the perceiving ears (e.g. Goodwin, Citation2014, p. 147) and, therefore, singing along to it, by fusing the words with the music, will make evident the P, I and L of the music in regard to the sung words (e.g. Schön & François, Citation2011), but in itself does not change the content of the words. Singing, by this account, should provide a natural occasion in which to exercise P, I and L (i.e. it requires the learners to vary their voices at different points without changing the words themselves). One can further make three specific predications about singing: (a) Singing may promote greater fluctuations of P, I and L in one’s voice; (b) Singing may widen weak-strong syllable differences (for example, in the word tonight, “night” is much stronger than the weak syllable “to”); and/or (c) Singing may cause the P, I and L to vary in certain ways, in particular, when a given song may require a learner to frequently raise or lower his or her voice (i.e. resulting in greater P variations) or to lengthen or shorten particular words (i.e. resulting in greater L variations). Due to the limitation of space, the present study examines the third scenario. The third scenario is a logical deduction and perhaps strikes a chord with many pronunciation teachers who use this activity in their classes. It is understandable that any given song will involve the use of certain skills, and these skills may not be transferable to another song. A small step that this study takes is to ask whether or not the current song will cause P, I and L to vary in certain ways. Therefore, analysing the song holds the key to understanding the nature of the “input” given to the learners (see Section 6.4). There is a need to understand the song’s input before one can infer the learners’ techniques.
4. Prosodic assessment: An impoverished area
Appraising the effects of a pronunciation activity, such as a presentation, a period of audio-lingual training, or, in this case, singing along to a song, is desirable for language teachers; however, there is currently no reliable way of carrying out this task. Prosodic assessment to-date remains “an impoverished area”, with no major paradigm to guide how learners’ progress can be best quantified. Levis (Citation2007) observes that teachers may not feel ready to give feedback on prosody due to the technical knowledge involved in doing so. Even when experienced human raters are invited to give judgement, they may pay attention to factors not directly related to the prosodic aspects of speaking (e.g. the stressing and destressing of sounds). They instead may pay attention to such areas as speech rate and grammatical and lexical appropriacy (e.g. Cucchiarini, Strik, & Boves, Citation2002; Kormos & Dénes, Citation2004). A third known problem is the lack of unified agreement among raters, which is almost impossible to avoid (e.g. Hincks, Citation2015).
In recent years, an increasing number of studies have promoted the use of stress cues for teaching and learning. In particular, the use of computer programmes to display pitch information on a screen for learners to emulate or self-diagnose their problems has been advocated (e.g. de Bot & Mailfert, Citation1982; Chun, Citation2002; Hincks, Citation2015; James, Citation1976; Levis & Pickering, Citation2004). Feedback given is often instantaneous, such as in the form of a “rising and lowering bar” signalling whether or not one’s pitch levels are satisfactory (Hincks & Edlund, Citation2009). Hincks (Citation2005) also proposes using “pitch variations” as feedback on the “liveliness” of vocal productions, and standard deviation scores are suggested as a candidate for this purpose. The current study may help clarify what roles P, I and L play in encoding speech, thereby furthering the understanding of the kind of feedback teachers need to give learners. The use of numerical data in the current approach may also be a solution to the problem of inconsistent judgement in the assessment of speech prosody (last paragraph).
5. This Study
The proposed framework for assessing singing includes repeated analyses of P, I and L in a group of learners’ vocal productions, as well as canvassing their most “preferred” stress cue(s). The key question to explore via the production test is whether or not singing along to a song might cause P, I and L to be used in certain ways, while the perception test (“auditory discriminatory test”) was administered to assess the learners’ subjective preferences of these cues. The perception–production relationship aims to reveal whether or not perceptual preferences become production reality. It is worth reiterating that singing is just one of many pedagogical options available for prosodic training. The proposed method may be applicable to the assessment of other forms of prosodic training.
6. Research methods
6.1. Research questions (RQs)
6.1.1. Lyric reading task (production)
A group of Cantonese learners read aloud in a self-paced manner a set of song lyrics before and after singing.
RQ1: Before singing, how will the learners use P, I, and L in their oral production?
Hypothesis 1 (H1): Previous research has established that pitch is a powerful cue in stress perception. Presumably, a production test may also reveal that learners vary pitch the most. The relative importance of I and L variations are also investigated in this question.
RQ2: After singing, will a second trial of the production test continue to confirm the predominance of pitch?
Hypothesis 2 (H2): Since the third scenario (Section 3) predicts that singing may cause P, I, and L to vary in certain ways, the hierarchy of P, I, and L found should differ from that of the pre-test (RQ1).
6.1.2. Auditory discriminatory test (perception)
The learners listen to acoustically treated sounds, which are prominent in one of the styles: P, I or L.
RQ3: Which cues, P, L, or I, will the learners judge as representing stress?
Hypothesis 3 (H3): The learners will judge pitch variation to be the best cue for stress, in line with the prediction of the extant literature in Section 1.
A group of Australian native speakers (NSs) completed both tests. Their data are used for comparison.
6.2. Participants
This project was advertised as a whole-day singing-and-speaking workshop. The researcher made explicit in the recruitment email that the workshop involved singing, in order to recruit interested students. A total of 32 Cantonese students (30F, 2 M, with a mean age of 15.09 [SD 0.53]) from seven local schools participated. All were third-year secondary students who had learned English as a foreign language. On the day of the workshop, all the participants were provided with a written consent letter in the format standardised by the university’s ethics committee. They all signed the letter and returned a copy of it to the researcher. The control group data were collected on the campus of a university in Brisbane, Australia. A total of 41 participants (25F; 16 M, with a mean age of 20.73 [SD 4.71]) from different backgrounds were involved. These backgrounds include social sciences and humanities (24), natural and health sciences (14) and business (3). This group did not undergo any training. They completed both tests in a quiet classroom and signed a consent letter agreeing to their data being analysed. The Hong Kong students were given a HKD200 coffee coupon and the Australian participants AUD25 at the end of the session.
6.3. The singing session
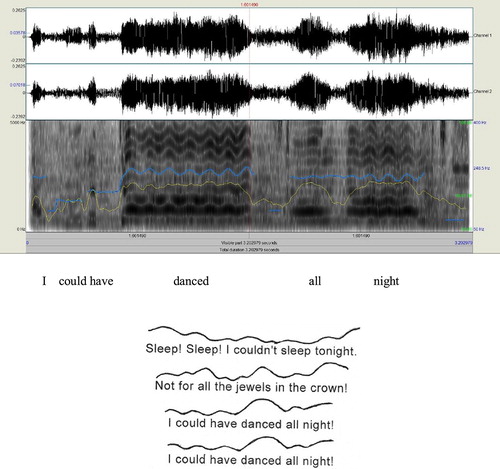
The prosodic training took the form of a human-delivered singing session at the author’s home university. This arrangement was beneficial for promoting “real engagement”, as well as conducting group-based rehearsals (At one point the present researcher did consider using a computer program to aid the participants’ practice, but this idea was discarded because it would appear very bizarre to sing to a computer). The song used was “I Could Have Danced All Night” from the musical My Fair Lady, on the theme of learning English. It is listed as suggested material in the Grade 5 singing examination by the Associated Board of the Royal Schools of Music (ABRSM) and is suitable for young singers. A musician with 15 years of coaching experience (in piano and vocal singing) advised on the use of the song; he pointed out that it is a “syllabic song”, in which each syllable is sung with a separate note (e.g. “tonight” = two notes). Because each syllable is stressed (or unstressed) independently, the research assistant could extract separate P, I and L values from each syllable. The learners were separated into two groups and two identical sessions were run, ensuring a small class arrangement. The vocal singer (different from the advisor on the song) was a tenor from Hong Kong Youth Windophilics. Prior to the workshop, the researcher and the singer discussed the teaching activities to ensure that a balance between entertainment, educational needs and the research assessment were met. The pre- and post-tests were held at 9AM and 5PM, respectively. The lyric reading test was an individual test, carried out concurrently in several classrooms and supported by research assistants. This was to provide each participant with a comfortable and stress-free environment in which to read out their script, as well as to reduce the testing time. After the test, the participants sat in small semicircles in a classroom. The singer started the session with warm-up activities, including playing portions of the film, discussing the storyline and performing vocal exercises. Then, the awareness-raising activities were interlaced with singing. The singer first asked the learners to analyse the two or three melodic contours of the song (Figure ), redraw them upon hearing the song, and finally sing them back in small groups. Sitting in semicircles promoted a close-knit and slightly competitive atmosphere. It also facilitated singing in different manners; first in a big group and then in small groups of four. This cycle was repeated after a lunch break. Overall, the singer led the participants in singing the whole song at least six times. The reader can also compare the length of the current treatment, which spanned five hours, with those of existing reports (e.g. 400 minutes were reported by Good et al. (Citation2015) and 15 minutes by Ludke et al. (Citation2014)).
Figure 1. (Above) The screen from Praat shows the line ‘I could have danced all night’ from the chorus of the song. Syllable lengths (L) could be decided based on the broad-band spectrogram (darkness of the areas), and P and I values were provided by Praat. (Below) The prosodic contours were based on SC scores (bottom row of Table ). They were used in the singing session
6.4. Analysing the Song
Conducting the singing session required teaching of a song. The first problem the singing instructor encountered was how to present the song’s contours in a comprehensible manner, so that there was a “common code” for all to follow. Furthermore, there was also a need to understand the nature of the song’s input, that is, how the singer used her voice, before the researcher could make sense of the learners’ (see Section 2 for further explanations).
The two problems were resolved in the following manner. As displayed in Table , the chorus of the original song, “I Could Have Danced All Night”, sung by Julie Andrews, could be analysed in terms of P, I and L variations via the speech analysis freeware Praat (ver 6.0.20 Boersma & Weenink, Citation2016). These separate values led the present researcher to innovate the SC measure (please see Section 2). The SC values (bottom row of Table ) formed a continuous prosodic contour for use in the singing session (Figure ). To address the second problem, the P, I and L variations (as independent variables) as well as the SC scores (as a dependent variable) across the whole song (see Table for a section of the song; altogether, there were 94 syllables) were submitted to a standard regression. This was done to determine the relationships between P, I and L, because the SC scores themselves provide no clue as to which dimension (P, I or L) varied the most. Preliminary analyses show that the inter-correlations between P, I and L were low to moderate. Intensity was correlated with pitch (r = 0.439, p = 0.000, n = 94) and with length (r = 0.460, p = 0.000, n = 94). Pitch and length, however, were not correlated (r = 0.063, p = 0.272, n = 94), indicating that, whenever the singer used a high pitch, it tended not to be for a long word, or vice versa. In statistical analysis, multicollinearity could be a serious threat to regression analyses (i.e. when P, I and L are highly correlated, tending to be the “same factor”). An additional step the researcher took was to submit the data to Minitab (ver. 17) to check for such a problem. The variance inflation factors (VIF) returned were between 1.28 and 1.61, much lower than a VIF of 5. This confirmed that P, I and L varied in their own manners (i.e. they independently contributed to prosody), and a regression analysis could be performed on these data.
Table 1. P, I, L and SC (P × I × L) values on the line “I could have danced all night” of the original song
The regression analysis generated these results: P, I and L jointly explained a large variance of SC, (F(3, 92) = 237.72, p = 0.000), with an R2 of 0.871. The beta values show that the singer used length the most (β = 0.847), followed by pitch (β = 0.308), and then intensity (β = 0.042). In percentages, P, I and L variations contribute 7.3, 0.1 and 59.1%, respectively, to prosody (SC). In summary, the rationale of this analysis was to determine the nature of the song, in preparation for an examination of the learners’ verbal outputs after they sang along to it. Interestingly, the song’s data seem to run counter to the prevailing belief that pitch variation is the major contributor to prosody.
6.5. Assessing production
Before and after singing, the participants read aloud the original lyrics of the song in a self-paced manner to a Shure microphone connected to an Amytel digital audio recorder. The Cantonese learners read the lyrics twice and the native speakers read them once. Their digital recordings were submitted to Praat to extract the P, I and L values of the voiced section of each syllable. A student RA listened to each of the recordings and checked them for accuracy. The original lyrics contained 112 words and 120 syllables. After omitting the first three lines, the last syllable of each line (avoiding the lengthening effect), and the word “jewel” (it was sung as jeWEL, in violation of the normal pattern, JEwel), 94 syllables were included for analysis (Appendix I). Noticeable pronunciation errors (e.g. “begged” was pronounced as /begəd/) were removed from the analysis, and other errors (e.g. “danced” pronounced as “dance”) were reviewed on a case-by-case basis, on the principle that they should not interfere with the extraction of the acoustic values. The number of participants in each group and the 94 data points for analysis should have compensated for such random speech behaviour.
6.6. Assessing perception
The learners’ sensitivity to stress cues provides another source of data through which to explore whether or not singing has an effect on the learners’ use of P, I and L. For this reason, an “auditory discriminatory test” was administered before they sang the song. Similar tests have been widely used in acoustic cue studies to assess the perceptions of the cues (e.g. Chrabaszcz et al., Citation2014; Fry, Citation1958; Lieberman, Citation1960; Zhang & Francis, Citation2010; Zhang et al., Citation2008). Instead of using a restricted set of words or nonwords (e.g. PERmit and perMIT; MAba and maBA), as previous research in the field has done, the present test included a large number of real and pseudo-words, in order to approximate authentic lexical patterns. The test (see Appendix II) was composed of three blocks. The first block required a judgement to be made between length and pitch; for example, a token of “certain” in which the first syllable was lengthened (ceeeertain) and another token with a raised pitch (↑certain). The second block involved pitch and intensity, such as belong↑ (second syllable higher) and beLONG (second syllable louder). The third block involved intensity and length, for example, REALise (first syllable louder) and reeaalise (first syllable lengthened). All real words were drawn from Brezina and Gablasova’s (Citation2015) general vocabulary list and the collocations were selected from Durrant and Doherty’s (Citation2010) high-frequency collocation list and the BBI collocation dictionary (Benson, Benson, & Ilson, Citation2010). The pseudo-words were drawn from Service (1992) and Archibald and Gathercole (2006). Each block consisted of disyllabic, trisyllabic and quadrisyllabic words, providing different contexts in which to embed the target sounds. There were altogether 90 questions for judgement and each cue was tested 60 times (e.g. pitch appeared 30 times in the real-word set and 30 times in the pseudo-word set). Caution was taken to include a variety of vowels in the targets (except /ə, ɪ/, which cannot be stressed) and to insert them in different positions.
6.7. Recording, synthesising and piloting of test materials
A female native speaker with a London accent, who worked at the English Centre at the author’s home university, recorded the materials. The recording of the real words was straightforward, but that of the pseudo-words involved a predetermination of the word stress patterns. Decisions were based on stress rules provided by general phonetics books (e.g. Carr, Citation2013). For example, the quadrisyllabic “deragonate”/ˌderəʹgəʊneɪt/ should have primary stress on the penultimate instead of the final syllable because of the English trochee. The heavy syllable /de/ should carry secondary stress, but it was not used as the target. The target sound in this word was /gəʊ/. Once the target sounds had been identified (underlined in Appendix II), they were resynthesised to enhance prominence.
Resynthesisation involved a series of steps, from broad-tuning and piloting to fine-tuning the sounds. Broad-tuning was used to apply an overall change to the original values (as produced by the native speaker) through Wavepad. This initial manipulation increased pitch by 1.07–1.15 times, length by 1.3–2 times and intensity by a mean of 3.8 dB. In the second step, 16 university students (outside the main participants) were recruited to listen to the treated sounds. Without knowing the nature of the manipulations, the participants indicated whether or not the sounds were higher, longer, louder or unclear. From this, a correctness percentage was obtained, indicating whether or not the cue had been perceived as such. The percentages were 72.77, 85.94 and 75.11% for P, I and L, respectively. In the final step, any target sounds that did not achieve 70% correctness in the previous step were resynthesised by repeating the first step. Often, resynthesisation proceeded in a “trial-and-error” manner, to make the sounds as comparable as possible. To show the extent of the modifications, Table presents average figures from the original cues and those from the modified cues. As shown, mean pitch value rose from 220.99 Hz to 248.96 Hz (equivalent to two semitones), mean intensity rose by almost 5 dBs (5.3%), close to a doubling of the loudness (Ladefoged, Citation2003, p. 91) and mean length rose by 47.2% or 1.47 times.
Table 2. Target sounds in the perception test after modifications
7. Results
7.1. Production test (RQ1 and RQ2)
Table presents the raw data from the learners’ and the NSs’ recordings. They contain the highest and lowest P, I and L values extracted through Praat. There is some indication that the learners’ post-singing trial had a greater degree of prosodic variation; for example, pitch rose from 213.77 Hz (pre) to 218.67 Hz (post) and the SC scores climbed from 4124.79–4639.50 (the SDs also indicate variations). The variations still fell short of those of the song, which had more extreme values. These patterns generally indicate that the participants’ post-singing reading was more prosodically varied. The problem with these raw figures is that it is difficult to discern the relative contributions of P, I and L to overall prosody (SC).
Table 3. Raw P, I and L Variations over the 94 Syllables
To investigate whether or not the song caused P, I and L to vary in certain ways, their raw variations were submitted to standard regression analyses after being checked for multicollinearityFootnote5, a procedure identical to that of analysing the song’s data (Section 6.4). When the pre-singing data were examined, the P, I and L variations jointly explained a significant proportion of the variance of the SC measure, F(3, 92) = 2811.48, p = 0.000, with an R2 of 0.989. That is, they jointly explained 98.9% of SC. The betas indicate that length was a significant predictor of SC (β = 0.961, p = 0.000), followed by pitch (β = 0.191, p = 0.000) and intensity (β = 0.057, p = 0.000). In percentages, length explained 83.4% of the SC variance, pitch 2.6% and intensity 0.2%. The post-singing data showed a similar pattern. The three cues jointly explained 99.1% of the SC variance, F(3, 92) = 3523.69, with an R2 of 0.991. Again, length predicted SC the most (β = 0.929, p = 0.000), followed by pitch (β = 0.171, p = 0.000) and intensity (β = 0.058, p = 0.000). In percentages, length explained 62.4% of the SC variance, pitch 1.6% and intensity 0.2%. For the control group, a significant regression equation was found: F(3, 92) = 3022.10, p = 0.000, with an R2 of 0.990. The order of the cues was the same: length (β = 0.994, p = 0.000) explained 77.7% of the SC variance, followed by pitch (β = 0.161, p = 0.000) (2%) and intensity (β = 0.037, p = 0.000) (0.1%). In summary, the learners’, NSs’ and the song’s data exhibit the same hierarchy of implementation: L variation, followed by P and I variations.
7.2. Perception test (RQ3)
The perception test aimed to discover the participants’ preferences of stress styles. The numbers presented in Table are the times a cue was voted to represent stress. When all the words were considered, the learners judged pitch and intensity variations as the most representative (36.27 and 32.91 times, respectively), while length was the least preferred cue.
Table 4. The participants’ cue preferences
The difference between pitch and length was particularly notable. To verify this difference, the three groups of votes (fourth column) were submitted to a Kruskal–Wallis test as dependent variables, with P, I and L as categorical variables. The test confirmed an uneven distribution of the votes somewhere in the data: X2 (2, n = 96) = 35.083, p = 0.000. From the mean rank, it was discerned that pitch (46.86) was higher than intensity (39.43) and length (14.2). The apparent difference between pitch and length was further checked by a Mann–Whitney test. The learners’ preference for pitch was significantly higher than for length (U = 22.5, z = −5.164, p [after Bonferroni adjustment] = 0.000).
Turning to the NSs’ data, there was an observable tie between pitch (31.88 votes) and length (31.03 votes). The intensity votes (27.1 votes) trailed slightly behind. A Kruskal–Wallis test failed to find clear differences between the learners’ choices: X2 (2, n = 123) = 4.746, p = 0.093. Because 0.093 was closer to the alpha value of 0.05, Mann–Whitney tests were used to compare pitch and intensity, and then length and intensity. The tests found that the NSs rated pitch higher than intensity (U = 545, p = 0.014; p was lower than the Bonferroni-adjusted 0.017, since there were three groups of data). Although there were slightly more pitch votes than votes for length and intensity, the pattern was not as clear as in the learners’ data.
These results can be summarised as follows:
| • | There was a high level of consistency between the learners’ and the NSs’ use of cues: L varied the most, followed by P and I (H1 predicted the predominance of P; it is thus unsupported). | ||||
| • | Singing did not cause the cues to vary differently. The order was still L, followed by P and I (H2 unsupported). | ||||
| • | The Cantonese learners clearly showed a preference for P variation. The native speakers’ data also showed some preference for P (H3 supported). | ||||
8. Discussion
An investigation into the “substrate” of a sound recognises that it can be realised through different combinations of P, I and L. These stress cues (P, I and L) give rise to the conception of the SC measure in this study. Together, they were employed to assess the effects of singing. It is argued that there are three benefits of the use of this measure: (a) A sound is more “fully described” than when only a single dimension is considered; (b) A prosodic contour can be generated based on the changing SC scores, which is visualisable and readily comprehensible to learners; (c) The SC allows for a more granular analysis of the use of voice (in this case, the regression analyses helped the researcher to clarify the contributions of P, I or L to one’s voice). The data collected for this study included the song’s input, the learners’ and the NSs’ reading-aloud data and their subjective judgement of the importance of P, I and L variations.
8.1. Production of P, I and L after Singing
The null hypothesis for RQ1 is that P, I and L are equally important for encoding speech prosody (SC). This prediction was first rejected by the correlations found in the song’s data, which showed that the singer did not use the cues evenly (Section 6.4) and by the regression results from the participants’ data (Section 7.1). Crucially, P, I and L did not contribute in the same way and length variation was found to be more commonly used than pitch or intensity variation in regard to encoding prosody. A post-singing reading test did not find any change in this order. Singing did not cause P, I and L to vary in special ways. In summary, all sets of data revealed a “recalcitrant” hierarchy of L, P, and then I, before and after training.
Very few studies have asked how sentence-level prosody is encoded. Previous versions of the production test (from the field of acoustic phonetics) have mostly used contrastive word pairs (e.g. PERmit, perMIT) to elicit oral data (e.g. Beckman, Citation1986; Lieberman, Citation1960; Zhang et al., Citation2008), and pitch was found to be a predominant cue used by the readers. The need to create contrast might have been a cause for the use of pitch variation. Such tests differ from the current task, which removed this requirement. The present prose-style reading task might have caused the learners to use other means to vary their voices. Therefore, a task-related factor may be implicated. Another possibility is that length may simply be a natural way of encoding speech. The present NSs and the learners produced more length variation. Even the original song made more use of length variation than pitch—much to our surprise, as we expected the singer to predominantly use pitch to vary her voice. It should be noted that pitch contributes 7.3% to the song’s prosody, compared to its more subdued presence (1.6–2.6%) in the reading-aloud data (see Section 7.1). This demonstrates that the song has already made more use of pitch than would normally have occurred in a reading activity. The suggestion that length variation may be a natural way of encoding speech cannot be firmly stated, as previous studies have seldom inspected the relationships among P, I and L. Very often, when pitch is foregrounded for particular teaching purposes (e.g. to ask a question or to express indignation or disbelief) (e.g. Celce-Murcia et al., Citation2010), the ways in which other cues manifest themselves at the same time is not described. A third possibility for the low registration of pitch in the present data could be that the cue produces powerful “leverage effects” (e.g. Fry, Citation1958); a slight increase is obvious and overdoing it could make one sound un-native-like (Zhang et al., Citation2008). On the other hand, length could have been an easier cue to manage and also a “low-risk” cue in giving prominence to certain meanings.
In summary, the hierarchy of “L, P, then I” found in the current data produces a somewhat ambivalent reading. It could mean that the current method (i.e. the weighing of P, I and L) is not sensitive enough to detect changes in the otherwise improved speech (the raw data in Table do show increased variations). Or, this method has just revealed a natural, de facto way of speech encoding, in that the speakers simply made more length variation than pitch.
8.2. Perception of P, I and L
RQ3 explored which dimension, P, I or L, the participants judged as indicating stress. Ideally, there should be a close match between the learners’ use of cues and their perceptual judgments. The present Cantonese learners showed a clear preference for pitch variation. The NSs’ data also indicated this (i.e. in a tie with “length”). This result supports the major observation by researchers that pitch is the most effective stress cue (see Section 1). It is the findings of the secondary cues that are hard to interpret (Table ). The present learners preferred intensity, while the NSs’ preferred length. This situation mirrored the mixed results found in acoustic cue studies, where there has been no clear agreement as to which is an effective secondary cue among learners and native speakers (e.g. Beckman, Citation1986; Chrabaszcz et al., Citation2014; Fry, Citation1955, Citation1958; Lehiste & Fox, Citation1992; Yu & Andruski, Citation2010).
Table 5. A Summary of the use of cues in both tasks
8.3. The mismatch between the perception and production of P, I and L
We started the study with the assumption that singing along to a song may encourage one’s voice to vary in certain manners, reflected in the changing distributions of P, I and L. This is only a logical deduction, as the hypothetical link between singing and speaking has seldom been examined in this way. Altogether, the obtained results yield three possible interpretations. First, analysing the variations of P, I and L in the verbal data did not reveal any significant changes before and after singing. As a result, singing may lead to other consequences but not the third scenario (see Section 2). Second, the current result may be taken as an invalidation of singing as a prosodic training activity. Singing along to a song has the unique power of fusing words with music. However, without any music or beats in the background to motivate speaking, one can hardly expect learners to vary their voices in “special ways”. A third possibility is that the analysis of P, I and L has led us to realise how prosody is normally encoded. The current participants took the test in a quiet room, where there was no need to use one’s voice in extreme ways. The nature of the task and the task condition may have promoted the use of length variations. Readers of this article may also recount how often they hear people raise and lower their voices to extreme extents when conducting a normal conversation. Ladefoged (Citation2003, p. 93) and Levis (Citation1999, p. 43) caution against treating pitch as the only correlate of stress. For them, length is substitutable for pitch in many cases. Another reason for the perception–production mismatch (i.e. high sensitivity to pitch in perception but more length variations in production) may relate to a difference between perceptual sensors and articulatory motors. Common experience suggests that someone being alerted by a shrill sound can hardly imply that the person emits such sounds at all times. This shows the importance of researching productive prosody in its own right to understand how speech is encoded. Which of these interpretations hold true? At present, a firm verdict cannot be made, as existing singing research seldom inquires how prosody is encoded (Section 3) and stress cue research rarely focuses on speech production (i.e. it mainly focuses on the perception of cues; see Sections 2 and 8.1). The current research concerns both areas and similar studies were not found. Given the results obtained, the next section will further discuss their educational implications.
9. Conclusion and educational implications
This study explored Cantonese learners’ perception and production of P, I and L in speech. The collected evidence suggests that the participants were generally alert to pitch changes, but they did not use pitch as much as length when encoding prosody during a lyric reading task. Second, singing along to a song did not change how length and pitch are patterned in the voice. The learners (and also the native speakers) used length variations to a greater extent than pitch variations. Third, the song itself also made more use of length than pitch variations.
Given the L, P, and I hierarchy found in this research, there are two possible future directions researchers can pursue to further establish the pedagogical value of singing: researchers can either investigate the other potential consequences of singing as suggested in Section 2 (because the third scenario was ruled out), or they can take the current result as a point of departure and find out how P, I and L are patterned in different speaking conditions. Do speakers use P, I and L differently when reading aloud a text (as in the present case), as opposed to making a spirited speech, or performing a song? Ascertaining whether the L, P, and I hierarchy is a constant trait is fundamental to understanding how speech is encoded, and realising the possible limits of singing. Maybe singing could have positive effects on pronunciation—it is just not scenario three.
Two teaching implications can be drawn in the light of the present results. The first relates to a trend in recent years to use pitch variations to illustrate to learners how they should use their voices (Section 4). The priority given to pitch in these studies is not compatible with the present findings, which found that the learners relied on length rather than pitch variations in encoding verbal speech. The current results imply a need to readjust the current focus on pitch in pronunciation teaching to length or to a mix of cues. The view of this study is that neither P nor L provides sufficient information to describe a contour. Teachers should instead consider the prospect of using a notion, such as the hypothetical SC measure, to characterise voice variations (2nd teaching implication). In fact, it can be observed from previous singing studies that researchers often alluded to songs’ quality by referring to terms such as “melodic lines” or “melodic contours”. For example, Racette and Peretz (Citation2007, p. 244), when describing their chosen song, said that “the melodic lines did not contain the same absolute pitches or the same exact rhythm, but they were structurally similar” (italics added). Good et al. (Citation2015, p. 632) also mentioned that “each line [of the song] always contained 5 syllables and was sung to the same melodic contour” (italics added). On further reading, there is usually no indication as to how such an impression of a “melodic contour” was formed. In reading these descriptions, the researcher cannot help feeling that an “all-in-one measure”, such as the SC notion, would be welcomed by pronunciation teachers, since describing a melodic contour seems to be a standard practice when using songs to teach.
By measuring the vicissitudes of P, I and L in one’s voice, the current study demonstrates a method of quantifying prosodic speech and therefore contributes to the area of prosodic assessment (Section 4). This method focuses on a less observable area of change, but its results are no less important than revelations about the mnemonic effects of using songs (see Section 3). It is reasonable to expect that educators will need information from all of these (and perhaps more) research clusters in order to make an informed judgement of the efficacy of using songs in a language classroom.
Funding
The author received no direct funding for this research.
Acknowledgements
The present researcher would like to thank the editor and the two anonmyous reviewers for their constructive feedback throughout the revision process. He also wishes to thank Mr. Roger Lo for conducting the singing session, and ICTE of the University of Queensland, Brisbane, for their assistance in the various aspects of the project.
Additional information
Notes on contributors
Hang Chan
Hang Chan works at the Department of Education Studies, Hong Kong Baptist University. His research interests are broadly in English language teaching and learning theories, phonetics and phonology and vocabulary learning. Previously, he worked on projects which investigated the relationship between move structure and citation techniques, and also on projects that examined multiword learning strategies. The current work represents one of his recent developments; that is, the acoustic characteristics of sounds and how such information can be used for prosodic assessment. He sees prosodic assessment as being a more holistic assessment strategy than a focus on pitch changes (i.e. intonational changes). This research was inspired by a former student who is a veteran singer, and a conversation between us about the possible educational benefits of singing.
Notes
1. Although these are called “stress cues”, they are found in all sounds.
2. “Pitch”, rather than “fundamental frequency (F0)” (the physical property of a sound wave) is used. As this study involved a perception test, “pitch” is a better term to describe the participants’ perception of such acoustic signals (Section 6.2). For consistency, the term is used throughout the paper.
3. Sometimes, “vowel quality” (the length of a syllable) is considered a stronger cue (e.g. Chrabaszcz, Winn, Lin, & Idsardi, Citation2014). Since this paper only considers the suprasegmental P, I and L, the importance of vowel quality is not considered.
4. The cited studies tend to give a lot of examples to illustrate the uses of songs. Empirical validation of such a tool was not the focus of these articles.
5. The VIFs returned by Minitab were between 1.11 and 2.49 (pre- and post-tests included), showing that P, I and L varied in their own ways (i.e. they are not the “same skill”). The data were acceptable for regression analyses.
References
- Beckman, M. E. (1986). Stress and non-stress accent. Riverton, NJ: Foris Publications.10.1515/9783110874020
- Benson, M., Benson, E., & Ilson, R. (2010). The BBI combinatory dictionary of English (Third ed.). Amsterdam; Philadelphia: John Benjamins Publishing Company.10.1075/z.bbi
- Boersma, P., & Weenink, D. (2016). Praat: Doing phonetics by computer [computer program]. ( Version 6.0.21). Retrieved from http://www.praat.org/
- de Bot, K., & Mailfert, K. (1982). The teaching of intonation: Fundamental research and classroom applications. TESOL Quarterly, 16(1), 71–77.10.2307/3586564
- Brezina, V., & Gablasova, D. (2015). Is there a core general vocabulary? Introducing the new general service list. Applied Linguistics, 36(1), 1–22. doi:10.1093/applin/amt018
- Brown, J. D. (2012). New ways in teaching connected speech. Alexandria, VA: TESOL International Association.
- Carr, P. (2013). English phonetics and phonology: An introduction (2nd ed.). West Sussex, UK: Wiley-Blackwell.
- Celce-Murcia, M., Brinton, D., & Goodwin, J. M. (2010). Teaching pronunciation: A course book and reference guide, Vol. 2. New York, NY: Cambridge University Press.
- Chrabaszcz, A., Winn, M., Lin, C. Y., & Idsardi, W. J. (2014). Acoustic cues to perception of word stress by English, Mandarin, and Russian speakers. Journal of Speech Language and Hearing Research, 57(4), 1468. doi:10.1044/2014_JSLHR-L-13-0279
- Chun, D. M. (2002). Discourse intonation in L2: From theory and research to practice. Amsterdam: John Benjamins Publishing Company.10.1075/lllt
- Cruttenden, A. (1997). Intonation, Vol. 2. Cambridge, UK: Cambridge University Press.10.1017/CBO9781139166973
- Crystal, D. (1969). Prosodic systems and intonation in English. London, UK: Cambridge University Press.
- Cucchiarini, C., Strik, H., & Boves, L. (2002). Quantitative assessment of second language learners’ fluency: Comparisons between read and spontaneous speech. The Journal of the Acoustical Society of America, 111(6), 2862–2873.10.1121/1.1471894
- Durrant, P., & Doherty, A. (2010). Are high-frequency collocations psychologically real? Investigating the thesis of collocational priming. Corpus Linguistics and Linguistic Theory, 6(2), 125–155.
- Eskenazi, M. (2009). An overview of spoken language technology for education. Speech Communication, 51(10), 832–844. doi:10.1016/j.specom.2009.04.005
- Fry, D. B. (1955). Duration and intensity as physical correlates of linguistic stress. The Journal of the Acoustical Society of America, 27(4), 765–768.10.1121/1.1908022
- Fry, D. B. (1958). Experiments in the perception of stress. Language and Speech, 1(2), 126–152.10.1177/002383095800100207
- Fry, D. B. (1979). The physics of speech. Cambridge, UK: Cambridge University Press.10.1017/CBO9781139165747
- Gan, L., & Chong, S. (1998). The rhythm of language: Fostering oral and listening skills in Singapore pre‐school children through an integrated music and language arts program. Early Child Development and Care, 144, 39–45.10.1080/0300443981440105
- Good, A. J., Russo, F. A., & Sullivan, J. (2015). The efficacy of singing in foreign-language learning. Psychology of Music, 43(5), 627–640. doi:10.1177/0305735614528833
- Goodwin, J. (2014). Teaching pronunciation. In M. Celce-Murcia, D. Brinton, & M. A. Snow (Eds.), Teaching English as a second or foreign language (4th ed.). (pp. 136–152). Boston, MA: National Geographic Learning.
- Hincks, R. (2005). Measures and perceptions of liveliness in student oral presentation speech: A proposal for an automatic feedback mechanism. System: An International Journal of Educational Technology and Applied Linguistics, 33(4), 575–591. doi:10.1016/j.system.2005.04.002
- Hincks, R. (2015). Technology and learning pronunciation. In M. Reed & J. Levis (Eds.), The handbook of English pronunciation (pp. 505–519). Malden, MA: Wiley Blackwell.
- Hincks, R., & Edlund, J. (2009). Promoting increased pitch variation in oral presentations with transient visual feedback. Language Learning & Technology, 13(3), 32–50.
- Hirst, D., & Di Cristo, A. (1998). A survey of intonation systems. In D. Hirst & A. Di Cristo (Eds.), Intonation systems: A survey of twenty languages (pp. 1–44). Cambridge, UK: Cambridge University Press.
- Iwasaki, B., Rasinski, T., Yildirim, K., & Zimmerman, B. S. (2013). Let’s bring back the magic of song for teaching reading. The Reading Teacher, 67(2), 137–141.10.1002/trtr.2013.67.issue-2
- James, E. F. (1976). The acquisition of prosodic features of speech using a speech visualizer. International Review of Applied Linguistics in Language Teaching, 14(3), 227–243. doi:10.1515/iral.1976.14.3.227
- Kenworthy, J. (1987). Teaching English pronunciation. London: Longman.
- Kormos, J., & Dénes, M. (2004). Exploring measures and perceptions of fluency in the speech of second language learners. System, 32(2), 145–164.10.1016/j.system.2004.01.001
- Ladefoged, P. (2003). Phonetic data analysis: An introduction to fieldwork and instrumental techniques. Malden, MA: Blackwell Publishing.
- Ladefoged, P., & Johnson, K. (2011). A course in phonetics (6th ed.). Boston, MA: Wadsworth Cengage Learning.
- Lehiste, I., & Fox, R. A. (1992). Perception of prominence by Estonian and English listeners. Language and Speech, 35(4), 419–434. doi:10.1177/002383099203500403
- Lehmann, J. A. M., & Seufert, T. (2018). Can music foster learning—Effects of different text modalities on learning and information retrieval. Frontiers in Psychology, 8. doi:10.3389/fpsyg.2017.02305
- Levis, J. (1999). Intonation in theory and practice, revisited. TESOL Quarterly, 33(1), 37–63.
- Levis, J. (2007). Computer technology in teaching and researching pronunciation. Annual Review Applied Linguistics, 27, 184–202. doi:10.1017/s0267190508070098
- Levis, J., & Pickering, L. (2004). Teaching intonation in discourse using speech visualization technology. System, 32(4), 505–524. doi:10.1016/j.system.2004.09.009
- Lieberman, P. (1960). Some acoustic correlates of word stress in American English. The Journal of the Acoustical Society of America, 32(4), 451–454.10.1121/1.1908095
- Liu, S., & Samuel, A. G. (2004). Perception of Mandarin Lexical tones when F0 information is neutralized. Language and Speech, 47(2), 109–138.10.1177/00238309040470020101
- Ludke, K. M., Ferreira, F., & Overy, K. (2014). Singing can facilitate Foreign language learning. Memory Cognition, 42(1), 41. doi:10.3758/s13421-013-0342-5
- Medina, S. L. (1990, March). The effect of music on second language vocabulary acquisition. Paper presented at the Annual Meeting of the Teachers of English to Speakers of Other Languages. San Francisco, CA.
- Paquette, K. R., & Rieg, S. A. (2008). Using music to support the literacy development of young English language learners. Early Childhood Education Journal, 36(3), 227–232. doi:10.1007/s10643-008-0277-9
- Pennington, M. C. (1996). Phonology in English language teaching: An international approach. London; New York: Longman.
- Pierrehumbert, J., & Hirschberg, J. (1990). The meaning of intonational contours in the interpretation of discourse. In P. R. Cohen, J. L. Morgan, & M. E. Pollack (Eds.), Intentions in communication (pp. 271–312). Cambridge, MA: MIT Press.
- Racette, A., & Peretz, I. (2007). Learning lyrics: To sing or not to sing? Memory & Cognition, 35(2), 242–253.10.3758/BF03193445
- Rainey, D. W., & Larsen, J. D. (2002). The effect of familiar melodies on initial learning and long-term memory for unconnected text. Music Perception, 20(2), 173–186. doi:10.1525/mp.2002.20.2.173
- Roach, P. (2009). English phonetics and phonology: A practical course (4th ed.). Cambridge, UK: Cambridge University Press.
- Roederer, J. G. (2008). The physics and psychophysics of music: An introduction, Vol. 4. New York, NY: Springer.
- Rogerson-Revell, P. (2011). English phonology and pronunciation teaching. New York; London: Continuum.
- Schön, D., & François, C. (2011). Musical expertise and statistical learning of musical and linguistic structures. Frontiers in Psychology, 2, 167. doi:10.3389/fpsyg.2011.00167
- Trask, R. L. (1996). A dictionary of phonetics and phonology. London: Routledge.
- Wallace, W. T. (1994). Memory for music: Effect of melody on recall of text. Journal of Experimental Psychology: Learning, Memory, and Cognition, 20(6), 1471–1485. doi:10.1037/0278-7393.20.6.1471
- Yu, V. Y., & Andruski, J. E. (2010). A cross-language study of perception of lexical stress in English. Journal of Psycholinguistic Research, 39(4), 323–344. doi:10.1007/s10936-009-9142-2
- Zhang, Y., & Francis, A. (2010). The weighting of vowel quality in native and non-native listeners’ perception of English lexical stress. Journal of Phonetics, 38(2), 260–271. doi:10.1016/j.wocn.2009.11.002
- Zhang, Y., Nissen, S. L., & Francis, A. L. (2008). Acoustic characteristics of English lexical stress produced by native Mandarin speakers. The Journal of the Acoustical Society of America, 123(6), 4498–4513.10.1121/1.2902165
Appendix I.
Lyric Reading Test (Production Test)
Appendix II.
Auditory Discriminatory Test (Perception Test)
Listen to the word pairs below. Decide which sound is more stressed. Judge it yourself based on what you listen. Mark your answer in the square below.