
Abstract
The study is a first validity study investigating the psychometric properties of the Danish translation of the intrinsic and extrinsic motivation subscales of the Motivated Strategies for Learning Questionnaire in a higher education context. Rasch family measurement models were employed emphasizing unidimensionality, local independence of items, and differential item functioning (DIF). The sample consisted of three consecutive year-cohorts of BA psychology students in a second semester course on personality psychology (N = 590). Results showed Intrinsic Motivation (IM) and Extrinsic Motivation (EM) to be separate subscales, weakly and negatively correlated. Neither subscale fit the pure Rasch model, but departures could be adjusted for in graphical loglinear Rasch models (GLLRMs): the IM fit a GLLRM adjusted for age-DIF on one item and local dependence between two items; the EM fit a GLLRM with local dependence between two items. Targeting of the subscales was good. Reliability was good for the EM subscale and, for the oldest students, on the IM subscale. Failure to adjust the IM score for the DIF discovered would lead to a Type I error, and future research should address this issue, as the other studies located showed (possibly spurious) age differences in the same direction as the unadjusted results in this study.
PUBLIC INTEREST STATEMENT
The research investigates the psychometric properties of the Danish translation of the intrinsic and extrinsic motivation subscales of the Motivated Strategies for Learning Questionnaire in a higher education context. This is done within the framework of item response theory by using Rasch family measurement models. These models where chosen as they set strict standards for measurement quality. The study is the first validity study of these scales in Danish, and the first IRT-based validity study internationally of these scales, and thus the results are relevant beyond the Danish educational research community. The results showed intrinsic and extrinsic motivation to be separate subscales, and that they are weakly and negatively correlated. Very good psychometric properties were established for both scales. The scales were well-targeted to the student population, reliability was good for most student groups, and the scores can be adjusted so that they measure fairly across subgroups of students.
1. Introduction
The overall goal of higher education is to produce specialist workforces across a range of fields and thus also to foster the self-motivated and self-regulated thinking needed to undertake position in these fields. According to both Zimmerman (Citation1986) and Deci, Ryan, and Williams (Citation1996), motivation is a crucial part of self-regulation in learning, as students’ degree of self-regulation is the degree to which they are “metacognitively, motivationally, and behaviorally active participants in their own learning process” (Zimmerman, Citation1986, p. 308), while fully self-regulated activities require that students “experience a sense of volition” and engage with “full and un-conflicted endorsement” (Deci et al., Citation1996, p. 165) (i.e. motivation). Thus, according to Zimmerman (Citation2002), self-regulated learners in higher education would be highly motivated to develop academic and learning skills. Motivation has been extensively studied in the higher education context, predominantly as achievement motivation, student motivation for learning, and self-regulated learning which includes motivational aspects and motivations for work and career (Wentzel & Miele, Citation2016). More specific sub-areas of research on student motivation has focused on a variety of subjects as, for example, individual differences in self-regulated learning (Duncan & McKeachie, Citation2005), gender differences in various motivational aspects and within and across various domains and disciplines (Watt, Citation2016).
1.1. Brief measures of Intrinsic and Extrinsic Motivation (MSLQ-IM and MSLQ-EM)
The Motivated Strategies for Learning Questionnaire (MSLQ) is a large survey-type questionnaire of students’ motivational orientation and learning strategies in high school and higher education (Pintrich, Smith, Garcia, & McKeachie, Citation1991). The MSLQ is available in several languages and is widely used within the field of student motivation in higher education, as it is possible to use individual subscales or the entire instrument depending on the purpose (Credé & Phillips, Citation2011; Duncan & McKeachie, Citation2005). The MSLQ includes two short subscales intended to measure motivation as intrinsic goal orientation and as extrinsic goal orientation (i.e. Intrinsic Motivation, IM, studying for the purpose of learning/mastery or internal approval; and Extrinsic Motivation, EM, studying for grades or external approval). The MLSQ is designed to be used at the course level; thus the MLSQ-IM and MLSQ-EM scales are to be regarded as measures of course-specific IM and EM.
Previous studies have examined the psychometric properties of the MSLQ-IM and MLSQ-EM scales, after Pintrich et al. (Citation1991) originally reported the reliabilities of the two subscales to be .74 and .62, respectively. Recently, Credé and Phillips (Citation2011) in their meta-analysis found that the MSLQ-IM and MLSQ-EM scales had a reliability distribution with a mean of .69 (s.d. .05) and .66 (s.d. .10) across 21 and 16 studies, respectively. The systematic literature review for this study identified 120 empirical journal articles and dissertations utilizing the MLSQ-IM and/or MLSQ-EM scales, and, of these, only 13 could be classed as psychometric studies (i.e. that they were conducted specifically for investigating psychometric properties in some fashion). Of the 13 psychometric studies, 11 were concerned with the factorial structure of the MLSQ and were predominantly using confirmatory factor analysis. Hence only two studies using modern psychometric methods within Item Response Theory (IRT) were identified, and neither of these included the original MLSQ-IM scale. Thus, Lee, Zhang, and Yin (Citation2010), using multidimensional Rasch modeling (MRM: A collection of subscale Rasch models (RMs) allowed to correlate), found that the intrinsic value scale in the Chinese high school version (MSLQ-CV; Rao & Sachs, Citation1999) of the junior high school version of the MSLQ (JHS MSLQ, Pintrich & De Groot, Citation1990) fit a RM (i.e. the partial credit model for ordinal items; PCM) in a 9-item version, where none of the items appeared to be identical to the original MLSQ-IM items. In a further study, Lee, Yin, and Zhang (Citation2010) revised the MSLQ-CV (Rao & Sachs, Citation1999) using confirmatory factor analysis (CFA) and Graded Response Modeling (GRM: a two-parameter IRT model allowing item discrimination to vary). In their study, Lee et al. (Citation2010) used a 4-item extrinsic value subscale identical to the MLSQ-EM (Pintrich et al., Citation1991) and the above-mentioned 9-item intrinsic value subscale, both with 5-point response scales. The results showed that both subscales fit GRMs. Both the study by Lee et al. (Citation2010) and the study by Lee et al. (Citation2010) were conducted in a Chinese high school setting.
The MLSQ was designed to measure course-specific IM and EM (Duncan & McKeachie, Citation2005; Pintrich et al., Citation1991), hence the bulk of research utilizes the MSLQ-IM and MLSQ-EM scales to make comparisons across subgroups of students, either cross-sectionally or longitudinally. Thus a number of cross-sectional studies have investigated gender, age, and other differences in motivation for diverse groups of students. For example, Mazumder (Citation2014) conducted a cross-cultural comparison (USA, China, Bangladesh, N = 252) of student motivation and learning and found that the Chinese students (N = 38) scored significantly lower on EM (0.61 points, p < .05) than did the American students (N = 71), while only an insignificant difference on IM (0.24 points) was found between these two nationalities. For reasons not disclosed, the Mazumder’s study did not include comparisons of IM and EM scores of Bangladeshi students with the American and Chinese students. However, from the means reported, the difference in EM between Bangladeshi students (N = 143) and Chinese students (0.57 points) would probably prove to be significant, while the difference between Bangladesh students and American students (0.20) would not. The opposite would most likely be true of IM, as there was a difference of 0.47 between the Bangladeshi and American students on IM, while the difference between the Bangladeshi and the Chinese students was only 0.23. Spahr (Citation2015) in a study on graduate social science students’ motivation and learning strategies (N = 86) found that male students (N = 35) scored significantly higher on EM than did the female students (N = 51) (0.64 points, p < .01). In another recent study, Doubé and Lang (Citation2012) used the MLSQ to examine gender and stereotypes in motivation to study computer programming (N = 85) and found that even though both genders had higher IM than EM, the female students were slightly more intrinsically and slightly less extrinsically motivated than the male students. Bye and colleagues (Bye, Pushkar, & Conway, Citation2007) found IM measured by the MSLQ-IM scale to depend on age in a study with 300 undergraduate students, such that older students (29 years and older) were more intrinsically motivated than the younger students, while no differences in EM dependent on age were found. In a study on gender and age differences in the motivational factors relevant for online learning engagement of adult learners in higher education (N = 190), Yoo and Huang (Citation2013) developed purpose-specific short measures of IM and short- and long-term EM (four, three, and three items, respectively), comparable to the MSLQ short scales. They found that female students (N = 136) reported significantly stronger IM for online learning scores than did the male students (0.24 points, p < .05), while there were no gender differences in EM, short or long term (0.07 and 0.05 points, respectively). However, they also found some small but significant differences in short-term and long-term motivation dependent on gender, but they were not systematic differences. Thus, students in their twenties and forties showed stronger short-term EM than students, who were either nineteen, in their thirties or fifties, while students in their twenties and thirties showed higher long-term EM scores than any other age group. Finally, Rush (Citation2013) investigated differences in student motivation by nationality, gender, and age with a sample of 210 students enrolled at an American university. She found that female students (N = 63) scored significantly higher on IM than male students (N = 147) (0.23 points, p < .05), that students aged 22 years or more (N = 103) scored significantly higher (0.27 points, p < .01) on IM than their younger counterparts (N = 107) (19–21 years of age), while no differences were found between American (N = 143) and international students (N = 67).
Furthermore, a substantial number of MSLQ motivation studies are quasi-experimental or intervention studies examining students’ levels of motivation before and after specific course, teaching methods, etc. For example, Cheang (Citation2009) administered the MSLQ to 110 Doctor of Pharmacy students before and after taking a course in pharmacotherapy. There were no gender differences in IM or EM, and IM and EM were not associated with the students’ cumulative Grade Point Average. However, a significant increase of 0.5 points on the IM scale and a non-significant increase of 0.2 points on the EM scale were found. In a recent study of medical students’ transition to the clinical environment, Cho and colleagues (Cho, Marjadi, Langendyk, & Hu, Citation2017) administered the MSLQ at the start of the first clinical year and again 10 weeks later (N = 72). They found that male students (N = 28) were more likely to increase on EM than were female students (OR 4.1, 95% CI 1.2–13.5, p < .05) during the 10 weeks. Accordingly, the above studies implicitly assume that the MSLQ-IM and MSLQ-EM subscales are measurement invariant across such subgroups as gender, age groups, and nationality, though they are not investigating the issue.
The MSLQ-IM and MSLQ-EM, like the other scales in the MSLQ, are treated as single unidimensional scales where the sum total-scores are used as indicators of IM and EM (Credé & Phillips, Citation2011). However, taking self-determination theory (Deci & Ryan, Citation1985) as a departure point, it seemed prudent to have a closer look at the two scales from a dimensional angle, that is, to test whether the MSLQ IM and EM scales are indeed separate constructs and thus two unidimensional subscales, as proposed by Pintrich and colleagues (Citation1991), or whether they are the result of students being at different stages of the process of internalization of external regulations, as suggested by the self-determination theory (Deci & Ryan, Citation1985, Citation2000). Thus, in the present study it is tested whether the two MSLQ motivation scales are to be treated as the opposite poles of a single unidimensional continuum of motivation ranging from EM to IM (i.e. from external to internalized regulation). A single continuum ranging from EM to IM would be analogous to, for example, extraversion and introversion, which in terms of definition are opposite personality traits, which have classically been measured as two opposite ends of the same continuum (Costa & McCrae, Citation1992), even though the usual way to discuss these is as two separate constructs. Another analogy is found in the long and still ongoing discussion as to whether femininity and masculinity, as measured by the Bem sex-role inventory (Bem, Citation1974; Marsh & Myers, Citation1986; Pedhazur & Tetenbaum, Citation1979; Spence & Helmreich, Citation1981), should be construed as two independent constructs or the opposite ends of a single continuum of femininity–masculinity. In the case of EM and IM, the consequences for measurement and interpretation would be substantial. A single continuum from extrinsic to IM would mean that a person at one end of the continuum would possess only this type of motivation and not the other. Two separate motivation constructs would mean that a person could be both extrinsically and intrinsically motivated to the same degree.
Methods within the IRT paradigm, and specifically the RM, are appropriate to provide evidence for (or against) the construct validity and detailed psychometric properties of scales measuring latent constructs such as motivation, specifically issues of measurement invariance dimensionality, local dependence of items, varied reliability at different levels of the scale (Andrich, Citation1988; Christensen & Kreiner, Citation2013). However, I have been unable to locate any validity studies within the IRT framework, including the issue of measurement invariance, concerned specifically with the MSLQ-IM and MSLQ-EM scales in a higher education context. In addition, I could not locate any studies examining the possible joining of the MSLQ-IM and MSLQ-EM subscales into a single scale continuum of motivation. Thus, the psychometric properties of these scales remain to be investigated within a higher education context by use of IRT methods, while focusing on the issue of gender and age invariance and whether the intrinsic and extrinsic subscale should be construed as two separate and unidimensional subscales or as opposite poles of a single continuum scale ranging from extrinsic to intrinsic.
Several IRT models can provide detailed information on measurement invariance across subgroups or dimensionality. However, within the framework of the so-called one-parameter (1PL) IRT model also denoted as the Rasch model (RM) (Rasch, Citation1960), formal tests of both invariance and unidimensionality are available. Furthermore, as the only model within the IRT framework, fit to the RM results in the summed raw score being a sufficient statistic for the latent variable measured (Kreiner, Citation2007; Mesbah & Kreiner, Citation2013; Tennant & Conaghan, Citation2007). It is considered highly desirable that the simple sum score should be a sufficient statistic for students’ motivational levels. This would allow for easy assessment of motivation by teachers in the educational contexts.
1.2. The present study
In order to establish whether there is a basis for continued research using the Danish MLSQ-IM and MLSQ-EM scales, as well as a basis for further and broader validity studies, the overall aim of the this study has been to investigate the construct validity and psychometric properties of the Danish language translation of the MSLQ-IM and MLSQ-EM scales within a higher education context, using Rasch measurement models. Specifically, I investigated the following two research questions:
RQ1:
Are the MSLQ-IM and MSLQ-EM subscales measurement invariant across groups of students defined by year cohort, gender, age, and whether they were admitted through the primary or the secondary admittance quota?
RQ2:
Are the MSLQ-IM and MSLQ-EM subscales, as originally proposed, two separate unidimensional subscales with sufficient sum scores, or do they make up a single continuum scale varying from extrinsic to IM?
2. Methods
2.1. Participants and data collections
A maximally comparable and controlled data sample was collected, as this is desirable for initial validation studies using IRT, in order to identify the source of any measurement issues arising. The sample was collected as part of a larger student survey included each year in a full-semester course on personality psychology theory and methods, placed in the second semester of the bachelor program in psychology at the University of Copenhagen. The main purpose of the student survey was educational use by the students in the course, and thus the response rates were always high and the quality of data was good. The survey was conducted a month into the course and the second semester; thus, the motivation scales addressed student motivation in relation to personality psychology and at the same time in relation to that particular time point in the bachelor program. Data were collected with three consecutive year cohorts (N = 590; N2015 = 198, N2016 = 210, N2017 = 182), with cohort response rates of 88%, 84%, and 84%, for the 2015, 2016, and 2017 cohorts, respectively. Slightly higher numbers were achieved for individual questions, but only students with complete data on the motivation items as well as information on gender and age were included in the sample. The majority of students were female in all three cohorts; 83%, 81%, and 77%, for the 2015, 2016, and 2017 cohorts, respectively. This matches the percentages of females admitted to the psychology program in these years very well, as these were 81%, 78%, and 79%, respectively. The majority (82% of total sample) of the students were aged 25 years or younger, which is representative for the admitted students across the three included cohorts, where 80.5% where 25 years or younger at admission seven months earlier. Finally, I was able to obtain information on the admission quota (primary or secondary) on which students were admitted through for the 2016 and 2016 cohort. In the sample, 12% and 14% of students (2015 and 2016, respectively) were admitted through the secondary quota, which is only slightly above the 10% admitted to the psychology program through this quota in these two years.
2.2. Instruments
The MSLQ IM and EM subscales (MLSQ-IM and MLSQ-EM) are but two of several scales in the MSLQ, which measures aspects of high school and higher education students’ motivational orientation and learning strategies (Pintrich et al., Citation1991). The MSLQ-IM and the MLSQ-EM each consist of four items. The MSLQ-IM is entirely class-specific, referring to the specific course, while the MSLQ-EM is more general, as items here either to “this class”, “classes like this,” or in one instance just “course” in general.
The MSLQ-IM and MLSQ-EM items were translated into Danish using a translate/back-translate procedure. First, the items were translated into Danish by a native Danish-speaking colleague also fluent in English, with the aim of retaining the essence and meaning of the English items. Second, the Danish translation was reviewed by a subject matter expert with psychometric expertise, and a few minor changes were made to the translation in order to prevent differential item functioning (DIF) and local dependence issues in subsequent analyses as a result. Finally, the items were back-translated from Danish into English by a second subject-matter expert with psychometric expertise fluent in both English and Danish. No further changes were made to the MSLQ-EM items, while small adaptations were made to the MSLQ-IM items to construct more meaningful items in Danish; in two items the reference to “in a class like this” was removed, in one item the reference to “a course” was changed to “this course”, and in the last item “this class” was changed to “a course”. Thus, the resulting IM scales were somewhat more general than the original scale and thus also more general than the EM scale.
The original MLSQ IM and EM scales had a 7-point response scale, where only the two extremes were anchored to a specific meaning: 1= not at all true of me, 7= very true of me (Pintrich et al., Citation1991). However, studies have shown response scales with meaning-anchored response categories (so-called “all-form”) to be superior to response scales which only have meaning anchors at the extremes (so-called “end-form”). All-form scales provide respondents (and researchers) with a better understanding of the meaning of the responses and therefore a greater degree of certainty in the interpretation of responses, and they improve reliability (Krosnick & Fabrigar, Citation1997; Menold, Kaczmirek, Lenzner, & Neusar, Citation2014). Furthermore, the only IRT-based validity studies of the MLSQ-IM and MLSQ-EM scales, not only revised items to be used with high school students, but also reduced the response scale to be a 5-point scale rather than a 7-point scale (Lee et al., Citation2010, Citation2010). These findings, and the fact that it was not possible to design seven meaningful response category anchors, clearly demonstrated that changing the responses categories to five meaning anchored ones would improve validity (i.e. if you do not know what you are asking, then you do not know what the respondents have answered and neither do the respondents themselves). Thus, I decided to adopt the modification of the response scale used by Nielsen, Makransky, Vang, and Dammeyer (Citation2017), where the number of response categories were reduced to five and all categories were meaningfully anchored. The resulting response categories were 1= not at all, 2= to a small degree, 3= to some degree, 4= to a large degree, 5= perfectly. The motivation items were administered in the same order as they appear in the original and full MLSQ (Pintrich et al., Citation1991).
2.3. Rasch measurement models
The simplest model in the large family of IRT models is the RM for dichotomous items (Rasch, Citation1960). In the present study, the generalization of the RM to ordinal data was used in the partial credit parameterization (PCM; Masters, Citation1982) and graphical loglinear RMs (GLLRMs) (Kreiner & Christensen, Citation2002, Citation2004, Citation2007) were used, both as implemented in the statistical software Digram (Kreiner, Citation2003; Kreiner & Nielsen, Citation2013). As the RM and the PCM have the same requirements for measurement (Kreiner, Citation2013; Mesbah & Kreiner, Citation2013), the term RM for Rasch model is used for both in this article. The measurement requirements for the RM are: (1) unidimensionality: the items of a single scale measure only one underlying latent construct. (2) Monotonicity: the expected item score is a monotonically increasing function of the latent score. (3) Local independence of items (no LD): items are conditionally independent given the latent score. (4) No DIF (no DIF): items and exogenous variables are conditionally independent given the latent score. (5) Homogeneity: the rank order of item parameters is the same for all persons no matter their level on the latent variable. The requirement of homogeneity is exclusive to the RM, while the first four requirements define criterion-related construct validity (Rosenbaum, Citation1989) and are common for all IRT models. Fulfillment of all five requirements by a set of item responses implies that the sum score is a sufficient statistic for the person parameter (latent variable). Sufficiency of the sum score is a property only of the RM, not all IRT models, and it is desirable when one wishes to use the summed raw score of measurement scales (Nielsen, Kyvsgaard, Sildorf, Kreiner, & Svensson, Citation2017). Fulfillment of the five requirements also means that measurement by the set of items responses is specifically objective (Rasch, Citation1961), so that within the frame of reference (hence the term “specific”) item comparisons do not depend on the persons, and person comparisons do not depend on the items. Thus, measurement by Rasch items is sometimes referred to as optimal measurement (Kreiner, Citation2013).
Close to optimal measurement can, however, still be achieved even if fit to the RM is rejected, provided that the departures from the RM consist exclusively of uniform DIF (uniform DIF) and/or uniform local dependence (uniform LD) between items (Kreiner & Christensen, Citation2007). Uniform/non-uniform refers to the way items depend either on exogenous variables or other items. Thus, uniform implies that this dependence is the same across all levels of the latent variable, while non-uniform implies that it is not. If LD or DIF is uniform, the DIF or LD terms can be included and adjusted for in a so-called GLLRM, which is an extension of the RM allowing for precisely these two types of departures from the pure RM. A GLLRM adjusted only for uniform LD can retain sufficiency of the sum score, though the reliability of the scale will be affected negatively to some degree. A GLLRM adjusted for uniform DIF does not retain sufficiency of the sum score for the person parameter, as additional information on membership of subgroups for which items function differentially is also needed. This can, however, be resolved by equating the sum score across subgroups to allow subsequent statistical comparisons to be unconfounded (Kreiner, Citation2007).
2.3.1. Item analysis by Rasch models and graphical loglinear Rasch models
Item analyses of the extrinsic and intrinsic subscales were conducted using the same general strategy. First, the fit of the item responses of the scale in question to the RM was tested. If the fit to the RM was rejected, departures from the RM were catalogued. If the departures consisted only of uniform LD and/or uniform DIF, the fit of the item responses to a GLLRM adjusting for the departures was tested. At the detailed level, analyses included overall fit, tests for DIF both at an overall and detailed level, in cases of DIF the effect of DIF on the sum score, tests for local independence, item fit, unidimensionality, and analysis of reliability and targeting. Details of procedures and tests are given in the following sections.
In addition, I repeated the analyses, while including available information of the quota students were admitted through (primary versus secondary) for the first two year cohorts (N = 348), in order to test for DIF across quotas. Due to a human error in the third data collection, the question on admittance quota was not included in the survey.
Global tests of fit (i.e. testing the hypothesis that item parameters are the same for persons with low and high scores, respectively) as well as Global tests of no DIF were conducted using Andersen’s (Citation1973) conditional likelihood ratio (CLR) test. The fit of individual items was tested by comparing the observed item-rest-score correlations with the expected item-rest-score correlations under the model (Kreiner, Citation2011) as well as by conditional infit and outfit statistics (Christensen & Kreiner, Citation2013; Kreiner & Nielsen, Citation2013). The presence of LD and DIF in GLLRMs was also tested by conditional tests of independence using partial Goodman-Kruskal gamma coefficients (Kreiner & Christensen, Citation2004). DIF was tested specifically in relation to year cohort (2015, 2016, 2017), gender (male, female), age groups (25 years and younger, 26 years and older), and the quota students were admitted through (quota 1, quota 2). Unidimensionality was tested by comparing the expected correlation of subscales under the assumption that they measured the same underlying latent construct with the observed correlation (Horton, Marais, & Christensen, Citation2013; Kreiner & Nielsen, Citation2010), using parametric bootstrapping for exact p-values. In order to test the possible unidimensionality of the single continuum scale ranging from extrinsic to IM, the EM subscale was reversed to create the single continuum from very extrinsically motivated to very intrinsically motivated.
For scales where items are not locally independent, the lower limit for reliability provided by Cronbach’s alpha is known to be inflated. For scales not fitting the pure RM, but a GLLRM with locally dependent items, reliability was instead estimated using Hamon and Mesbah’s (Citation2002) Monte Carlo method taking into account any LD and adjusting the reliability accordingly. All reliabilities can thus be correctly interpreted as Cronbach’s alpha. Targeting (i.e. the degree to which the study population was outside the target range) was assessed both graphically and numerically. Graphically, plots of the distribution of person parameters and the distribution of item parameters onto the same latent scale were used for a visual evaluation of whether the majority of persons in the study population are included in the range of item parameters. The numerical targeting indices for the person parameter were the test information target index (i.e. the mean test information divided by the maximum test information) and the root mean squared error (RMSE) target index, (i.e. the minimum standard error of measurement divided by the mean standard error of measurement) (Kreiner & Christensen, Citation2013). The targeting indices should preferably be close to one. Furthermore, the target of the observed score and the standard error of measurement of the observed score (SEM) were estimated.
Global evidence of fit and no DIF was rejected if this was not supported by additional evidence of fit of the individual items and both no DIF and LD with the more specific tests. The Benjamini-Hochberg procedure was used to adjust for false discovery rate (FDR) due to multiple testing, where appropriate (Benjamini & Hochberg, Citation1995). Significance was evaluated at a 5% critical level (after adjusting for FDR), while distinguishing between weak, moderate, and strong evidence, as recommended by Cox et al. (Citation1977).
2.3.2. Chain-graph models
Chain-graph models were used to illustrate the resulting models for each subscale, as suggested by Kreiner and Christensen (Citation2007). In Chain-graph models, missing edges between nodes illustrate that the variables are conditionally independent, given the remaining variables in the model. As such, items not connected to any other items by an edge are conditionally independent of the remaining items given the latent variable (i.e. the property of no local dependence). In the same manner, items not connected to any background variables are conditionally independent given the latent variable (i.e. the property of no DIF). Undirected edges illustrate that the variables are conditionally dependent though without assuming any causality assumed (e.g. in the case of locally dependent items). Directed edges (arrows) illustrate that variables are conditionally dependent while assuming causality (e.g. in the case of DIF or of a background variable being related to the latent variable).
3. Results
3.1. Overall fit and item fit
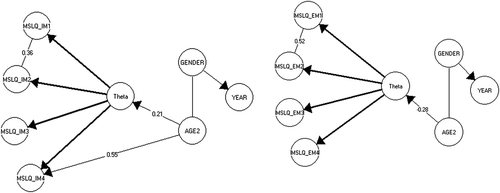
Neither the IM nor the EM scales fit the pure RM, as there was strong evidence against homogeneity and for age-DIF with the IM scale, and strong evidence against homogeneity with the EM scale (Table , the RM columns). Thus, I proceeded with analysis by GLLRMs. Both scales fit a GLLRM with local dependence between a single pair of items, and in the case of the IM scale, also strong positive DIF relative to age groups (Figure and Table , the GLLRM columns). The fit of individual items to the resulting GLLRMs are provided in Table S1 in the supplemental file.
Table 1. Global tests-of-fit and global tests-of-DIF for intrinsic and extrinsic motivation subscales to the Rasch model and the graphical loglinear Rasch models in Figure
Figure 1. The final graphical loglinear Rasch models for the IM (left side) and EM (right side) subscales
3.2. Local independence
In both the MLSQ-IM and the MLSQ-EM, one pair of items did not meet the requirement of local independence between items given the respective thetas (Figure ). In the MLSQ-IM subscale, item 1 “I prefer course material that really challenges me so I can learn new things” and item 2 “I prefer course material that arouses my curiosity, even if it is difficult to learn” were rather strongly locally dependent (γ = .36, p < .001). In the MLSQ-EM subscale, item 1 “Getting a good grade in this class is the most satisfying thing for me right now” and item 2 “The most important thing for me right now is improving my overall grade point average, so my main concern in this class is getting a good grade” were locally dependent and very strongly so (γ = .52, p < .001).
3.3. Differential item functioning
Evidence of DIF was discovered only in the analysis of the MLSQ-IM subscale. Accordingly, the raw scores of this subscale had to be equated for age-DIF, in order to eliminate the confounding effect of age, when using the summed scale score in subsequent statistical analysis. The score-equation table is provided as Table S2 in the supplemental file, while the DIF results and the effect of adjusting for the DIF are presented in Table .
Table 2. Comparison of observed and equated mean IM scores in age groups
In the IM subscale, item im4 (When I have the opportunity in this class, I choose course assignments that I can learn from even if they don’t guarantee a good grade) functioned differentially relative to age, so that the group of older students were more likely to say that the statement described them than were the group of younger students, irrespective of their level of IM (Figure ). The effect of equating the IM raw score to adjust for the age-DIF was that the difference in the mean scores for the age groups became smaller and clearly insignificant, as a result of the adjustment (Table ). Thus, failure to adjust the scores for the age-DIF would have resulting in a Type I error, and the conclusion would, at a conventional 5% critical level, have been that the students above 25 years were more intrinsically motivated than students 25 years and younger, when indeed there was no difference.
Repeating the analysis two year cohorts in order to test for DIF across admission quotas did not alter the results, and no Admission quota DIF was discovered (therefore results are not shown).
3.4. Targeting and reliability
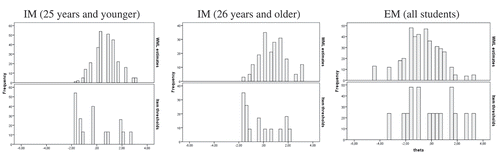
Targeting was very good for the EM scale, with 88% of the maximum obtainable test information (Table ), and person parameters and the item thresholds well aligned with regard to locations on the latent EM scale (Figure ). The targeting of the IM scale was slightly poorer, but still in the good range, with 79% and 74% of the maximum obtainable test information for the two age groups, respectively (Table ). Also, the alignment of person parameters and item thresholds was good for both age groups of students, though within a narrower interval on the latent IM scale (Figure ).
Table 3. Targeting and reliability of the Intrinsic and Extrinsic motivation subscales
Figure 2. Targeting graphs showing the person parameter locations over items thresholds along the latent theta scale for the IM and EM subscales
3.5. Unidimensionality
Having established fit of both the MSLQ-EM and MSLQ-IM subscales to GLLRMs, it was possible to proceed to formally test whether the two subscales were indeed two single unidimensional scales or whether they should instead be considered as a single continuum scale ranging from extrinsically to intrinsically motivated. The latter was investigated by first reversing the extrinsic subscale before testing whether the two subscales were as highly correlated as would be expected under a unidimensional model. The asymptotic and the Monte Carlo test of subscale homogeneity both clearly rejected that the reversed extrinsic scale and the intrinsic subscale were a single unidimensional scale (top row in Table , both p-values < 0.001), thus the construction of a single continuum extrinsic–intrinsic scale was rejected. Unidimensionality of the extrinsic and intrinsic subscales was also clearly rejected (bottom row in Table , both p-values < 0.001), thus supporting that the constructs of intrinsic and EM as measured by the MSLQ-IM and MSLQ-EM subscales are indeed two separate constructs.
Table 4. Test of unidimensionality of the intrinsic and extrinsic motivation subscales
3.6. Differences in extrinsic and intrinsic motivation scores
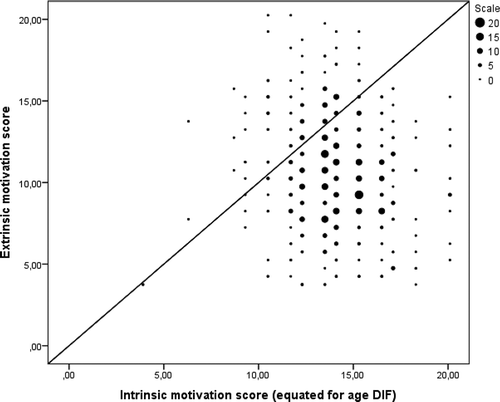
Having established that the MSLQ-EM and MSLQ-IM were indeed two separate scales measuring EM and IM, respectively, (RQ2), that both subscales fit GLLRMs and only the IM score was in need of score equating due to DIF (RQ1), it was possible to assess the relationship between extrinsic and IM directly through the (equated) sum scores. A plot of the two sum scores (Figure ) shows that the majority of the participating psychology students have a low score on either EM or IM and a higher score on the other one, and most of the students score higher on IM than EM. However, it does not appear to be a simple matter of being either extrinsically or intrinsically motivated, but rather a matter of degrees on both.
Figure 3. Distribution of extrinsic and intrinsic motivation sum scores
4. Discussion and implications for further (validity) studies
The results of the Rasch analyses of the two motivation subscales from the MSLQ subscales were that both subscales fit a GLLRM, with very few departures from the pure RM in the form of DIF and local dependence between items (LD). Thus LD was found for one item pair in the EM subscale, and one item pair in the IM subscale. One item in the IM subscale suffered from age-DIF. However, all LD and DIF were uniform in nature, and could thus easily be adjusted for to make both the latent scales scores (i.e. person parameters) and the observed scale scores (i.e. the summed raw scores) comparable across subgroups. Furthermore, there was no evidence that the IM and EM subscales made up a single unidimensional motivation scale ranging from EM to IM. On the contrary, support was found for two separate constructs, also when plotting the subscales scores against one another. Taken together, the findings supported both the construct and criterion validity of the IM and EM constructs in the MSLQ operationalization. Furthermore, the reliability of the two subscales was satisfactory, except in the case of the IM subscale for the younger group of students, while the targeting of both subscales was very good for all students.
The findings of local dependence between one pair of items in both the IM and the EM subscales were not surprising, when considering the item content. Thus, the two locally dependent IM items refer to a preference for course materials that are challenging and course materials that arouse curiosity, respectively. While these preferences are not the same, it does make sense from a learning and intellectual style point of view that a preference for challenges goes hand-in-hand with curiosity and vice versa (e.g. Nielsen, Citation2014; Zhang & Sternberg, Citation2005). With the two locally dependent EM items, this most probably stems from redundancy with regard to item content rather than closely related content, as the items partially overlap in content; “Getting a good grade in this class…” and “… so my main concern in this class is getting a good grade”.
And while both of the two locally dependent IM items were changed slightly in the translation process, there is no reason to assume that these changes lead to the local dependence, as both items were merely changed by omitting “in a class like this” at the start of the items. It is therefore reasonable to assume that these items would also be locally dependent in the original English MSLQ – as would the two locally dependent EM items as these were not changed in translation – and thus also that the lower limit of reliability for both scales would be somewhat lower due to this in other research as well. I thus recommend that further validity studies of the MSLQ motivation subscales should include analysis of local dependence between items.
In the IM subscale, item im4 (When I have the opportunity in this class, I choose course assignments that I can learn from even if they don’t guarantee a good grade) functioned differentially relative to age, so that the group of older students were more likely to say that the statement described them than were the group of younger students, irrespective of their level of IM (Figure ). The effect of equating the IM raw score to adjust for the age-DIF was such that the difference in the mean scores for the age groups became smaller and clearly insignificant, as a result of the adjustment (Table ). Thus, failure to adjust the scores for the age-DIF would have resulted in a Type I error, and the conclusion would, at a conventional 5% critical level, have been that the students above 25 years were more intrinsically motivated than students 25 years and younger, when indeed there was no difference.
Only one item in the IM subscale was found to function differentially, thereby biasing the measure of IM such that the older group of students scored artificially high compared to the younger group of students. The consequence of not taking this DIF into account and adjusting accordingly when using the sum score would be a Type I error (falsely rejecting the null hypothesis of no difference, and thus claiming that a difference was found) when comparing IM scores for the two age groups. It was only possible to locate two studies comparing IE and EM as measured with the MSLQ for differently aged higher education students (Bye et al., Citation2007; Rush, Citation2013). Bye and colleagues found age-dependent differences in IM scores, such that older students (29 years and older) were more intrinsically motivated than the younger students, while Rush found that students aged 22 years or older had higher IM scores than younger students. The age groups are composed differently across these two and the present study; the common finding is that the older group of students have higher scores on IM than the younger groups of students. It might intuitively make sense that older students could be more intrinsically motivated than the younger students due to experience and maturity. This would also be the conclusion in this study, if the IM score had not been adjusted for the bias caused by the discovered age DIF for item 4 in this scale (Table ). However, after adjusting the IM score for this bias, there is no significant difference between the IM scores for the younger and the older group of students. This demonstrates that, in this study, the finding that older students are more intrinsically motivated than the younger students is, in fact, spurious, and is caused by the age-bias in the scale. Thus, it is recommended that future research into the possible age differences in IM of students should include analysis of DIF or other analysis of invariance.
Both the IM and the EM subscales were well targeted to the student group in this study. However, as the participants were chosen to have a highly comparable sample for this first validity study (three-year cohorts of psychology students, all taking a second semester course in personality psychology), it is reasonable to assume that targeting might differ for students from other disciplines and at other time points in their programs. Thus, it is recommended that future validity studies should include students from a variety of academic disciplines and measure their motivation at differing times in their programs, in order to evaluate the targeting of the subscales more broadly.
The reliability of the EM subscale was satisfactory (above .70) for all student groups, as was the reliability for the IM subscale for students aged 26 years and older, but not for students aged 25 years and younger. The poor reliability for the younger group of students stems from less variation in the scores for this group, compared to the older group of students, and thus simply from the reality that the younger students are more homogeneous with regard to their level of IM than are the older students. Thus, only the reliability of the IM scale for the older group of students in this study (.73) is comparable to the original reliability (.74) reported by Pintrich et al. (Citation1991) and the mean reliability (.69, s.d. 0.05) reported in the meta-analysis of Credé and Phillips (Citation2011). However, as Pintrich and colleagues did not report the age of the students in the development sample, and there is some variation across the 21 studies in the meta-analysis, it is not possible to evaluate properly whether the low reliability (.52) for the younger group of students in this study is, in fact, unusually low. The reliability of the EM scale in this study (.79) is substantially higher than that of the original development sample (.62; Pintrich et al., Citation1991) and the mean reliability across 16 studies (.66, s.d. 0.10) reported in the meta-analysis by Credé and Phillips (Citation2011). Whether these results stem from the change to meaning-anchored response categories cannot be determined with any certainty from this single study; thus, it should be studied further in the future.
The tests of unidimensionality clearly do not support the proposition that the MSLQ-IM and MSLQ-EM should be considered as a single continuum scale ranging from extrinsically to intrinsically motivated, rather than two separate subscales measuring each the constructs of IM and EM. Thus, the results support the originally proposed use of the two measures by Pintrich et al. (Citation1991). Plotting the scores of the two separate constructs of IM and EM made it clear that it is not a question of being either extrinsically or intrinsically motivated, but rather a question of degrees of both for many of the participating students, the question then remains whether this is credible. Looking into the higher education context of the psychology program that the participating students are enrolled in, this result resonates well with the reality of this context. The context of the program with its structural, teaching and learning environment is, from a motivational angle, ambiguous at best and conflicted at worst. One the one hand, in the competency goals of the official program description, the learning objectives, in classes and in the actual examination assignments, students are readily expected to be intrinsically motivated, and thus attending and studying in independent, self-regulated ways due to interest and inner drive to learn to be an academic. On the other hand, the general ministerial rules require students to pass a certain course load each semester and the readings and activities of courses are extensive, which in combination with students who are used to receiving top grades from high school (otherwise they cannot get in to the psychology program), leads to students who start courses by asking questions depicting a more pragmatic and extrinsically motivated approach to studying and learning. Questions such as “do we need to know everything for the exam?”, “which are the most important part of readings to get a good grade?”, and so on, and the questions remain during the semester. Thus, in the context there appears to be a conflict or ambiguous relationship between IM and EM pulling at the students from two sides. Future research might focus on the qualitative and experiential aspects of this relationship in order to shed more light on the possible detrimental effects for student learning and well-being and the possible coping strategies that students employ to “survive” in this ambiguity.
Several features of the present study may be considered both strength and weaknesses. Thus the high degree of comparability in the sample might be considered a weakness, as it means that the validity and reliability of the two have only been investigated for a narrow and uniform group of students. At the same time, the comparability may also be considered a strength, as it allowed for the psychometric properties of the scales being assessed in a controlled manner, thus laying the ground for broader and more diverse validity studies within a variety of disciplines and study-wise time points, etc. In the same manner, the brevity of the two subscales might, from a measurement precision point of view, be considered a weakness, as more (good) items will give more precise measurement. However, it might also be considered a strength from the field of large-scale survey research within the social sciences, where short scales of good psychometric quality are desirable as many constructs are included in these surveys. Furthermore, due to the design of the study, it did not include any qualitative element, and it included measurement only at a single time point. In summary, it is recommended that future validity studies of the IM and EM subscales include students from a variety of programs and at different time points in the programs, in order to include more than one point of measurement in order to investigate time-wise invariance (i.e. longitudinal DIF) and thus establish whether the subscales are suitable for evaluating changes in motivation, and, finally, include qualitative elements to explore how students’ experience their motivation as intrinsic and/or extrinsic.
Supplemental Material
Download MS Word (14 KB)Acknowledgements
I would like to acknowledge Maria Louison Vang and Guido Makransky from the University of Southern Denmark for their contribution to the translation. I also want to thank Jesper Dammeyer and Ingo Zettler for allowing me to include the motivation items in the student surveys in their course on Personality Psychology for three consecutive years and in a systematic manner suitable for a first validation study.
Supplementary material
Supplementary material can be accessed https://doi.org/10.1080/2331186X.2018.1504485
Additional information
Funding
Notes on contributors
Tine Nielsen
Tine Nielsen is an Associate Professor at the Department of Psychology, University of Copenhagen, Denmark. Her research is focused within the fields of higher education psychology, health psychology, and psychometrics, under the heading PsychMeasure. The present study is one in a series of validity studies aimed at providing the Danish educational research community with valid and reliable measures to use. She is an active member of several education as well as psychometric societies and network groups. For example: the European Association for Research in Learning and Instruction (EARLI), the Psychometric Society, The European Rasch Research and Teaching Groups (ERRTG), and the Danish Measurement network (DM) which she founded in 2016. She is a subject editor (higher education and psychometrics) at the Scandinavian Journal of Educational Research.
Related Research Data
References
- Andersen, E. B. (1973). A goodness of fit test for the Rasch model. Psychometrika, 38(1), 123–140. doi:10.1007/BF02291180
- Andrich, D. (1988). Rasch models for measurement. Quantitative applications in the Social Sciences. A Sage University Paper. Sage Publishing, Inc. doi:10.4135/9781412985598
- Bem, S. L. (1974). The measurement of psychological androgyny. Journal of Consulting and Clinical Psychology, 42, 155–162. doi:10.1037/h0036215
- Benjamini, Y., & Hochberg, Y. (1995). Controlling the false discovery rate: A practical and powerful approach to multiple testing. Journal of the Royal Statistical Society. Series B (Methodological), 57(1), 289–300.
- Bye, D., Pushkar, D., & Conway, M. (2007). Motivation, interest, and positive affect in traditional and nontraditional undergraduate students. Adult Education Quarterly, 57(2), 141–158. doi:10.1177/0741713606294235
- Cheang, K. I. (2009). Effect of learner-centered teaching on motivation and learning strategies in a third-year pharmacotherapy course. American Journal of Pharmaceutical Education, 73(3), 42. doi:10.5688/aj730342
- Cho, K. K., Marjadi, B., Langendyk, V., & Hu, W. (2017). Medical student changes in self-regulated learning during the transition to the clinical environment. BMC Medical Education, 17(1), 59. doi:10.1186/s12909-017-0902-7
- Christensen, K. B., & Kreiner, S. (2013). Item fit statistics. In K. B. Christensen, S. Kreiner, & M. Mesbah (Eds.), Rasch Models in health (pp. 83–104). London: ISTE and John Wiley & Sons, Inc. doi:10.1002/9781118574454.ch5
- Costa, P. T. J., & McCrae, R. R. (1992). The revised NEO personality inventory (NEO-PI-R) and NEO five factor-inventory (NEO-FFI). Professional manual. Odessa, Florida: Psychological Assessment Ressources.
- Cox, D. R., Spjøtvoll, E., Johansen, S., Van Zwet, W. R., Bithell, J. F., Barndorff-Nielsen, O., & Keuls, M. (1977). The role of significance tests [with discussion and reply]. Scandinavian Journal of Statistics, 4(2), 49–70.
- Credé, M., & Phillips, L. A. (2011). A meta-analytic review of the motivated strategies for learning questionnaire. Learning and Individual Differences, 21(4), 337–346. doi:10.1016/j.lindif.2011.03.002
- Deci, E. L., & Ryan, R. M. (1985). Intrinsic motivation and self-determination in human behavior. New York, NY: Plenum. doi:10.1007/978-1-4899-2271-7
- Deci, E. L., & Ryan, R. M. (2000). The “what” and “why” of goal pursuits: Human needs and the self determination of behavior. Psychological Inquiry, 11, 227–268. doi:10.1207/s15327965pli1104_01
- Deci, E. L., Ryan, R. M., & Williams, G. C. (1996). Need satisfaction and the self-regulation of learning. Learning and Individual Differences, 8(3), 165–183. doi:10.1016/s10416080(96)90013-8
- Doubé, W., & Lang, C. (2012). Gender and stereotypes in motivation to study computer programming for careers in multimedia. Computer Science Education, 22(1), 63–78. doi:10.1080/08993408.2012.666038
- Duncan, T. G., & McKeachie, W. J. (2005). The making of the motivated strategies for learning questionnaire. Educational Psychologist, 40(2), 117–128. doi:10.1207/s15326985ep4002_6
- Hamon, A., & Mesbah, M. (2002). Questionnaire reliability under the Rasch Model. In M. Mesbah, B. F. Cole, & M. L. T. Lee (Eds.), Statistical methods for quality of life studies. Design, measurement and analysis. Dordrecht: Kluwer Academic Publishers. doi:10.1007/978-1-4757-36250_13
- Horton, M., Marais, I., & Christensen, K. B. (2013). Dimensionality. In K. B. Christensen, S. Kreiner, & M. Mesbah (Eds.), Rasch models health (pp. 137–158). London: ISTE and John Wiley & Sons, Inc. doi:10.1002/9781118574454.ch9
- Kreiner, S. (2003). Introduction to DIGRAM. Copenhagen: Department of Biostatistics, University of Copenhagen.
- Kreiner, S. (2007). Validity and objectivity: Reflections on the role and nature of Rasch models. Nordic Psychology, 59(3), 268–298. doi:10.1027/1901-2276.59.3.268
- Kreiner, S. (2011). A note on item-restscore association in Rasch models. Applied Psychological Measurement, 35(7), 557–561. doi:10.1177/014662161141022
- Kreiner, S. (2013). The Rasch model for dichotomous items. In K. B. Christensen, S. Kreiner, & M. Mesbah (Eds.), Rasch Models Health (pp. 5–26). London: ISTE and John Wiley & Sons, Inc. doi:10.1002/9781118574454.ch1
- Kreiner, S., & Christensen, K. B. (2002). Graphical Rasch models. In M. Mesbah, B. F. Cole, & M. T. Lee (Eds.), Statistical methods for quality of life studies (pp. 187–203). Dordrecht: Kluwer Academic Publishers. doi:10.1007/978-1-4757-3625-0_15
- Kreiner, S., & Christensen, K. B. (2004). Analysis of local dependence and multidimensionality in graphical loglinear Rasch models. Communication in Statistics –Theory and Methods, 33(6), 1239–1276. doi:10.1081/sta-120030148
- Kreiner, S., & Christensen, K. B. (2007). Validity and objectivity in health-related scales: Analysis by graphical loglinear Rasch models. In Von Davier & Carstensen (Eds.), Multivariate and mixture distribution Rasch models (pp. 329–346). New York: Springer. doi:10.1007/978-0-387-49839-3_21
- Kreiner, S., & Christensen, K. B. (2013). Person parameter estimation and measurement in Rasch models. In K. B. Christensen, S. Kreiner, & M. Mesbah (Eds.), Rasch models health (pp. 63–78). London: ISTE and John Wiley & Sons, Inc. doi:10.1002/9781118574454.ch4
- Kreiner, S., & Nielsen, T. (2010). Approaches to determining uni-dimensionality in graphical loglinear Rasch models for polytomous items [Abstract]. Proceedings of the Fourth International Conference; Probabilistic models for measurement in education, psychology, social science and health, June 13-16, 2010. Pp.83–84. DOI:10.1037/a0018842
- Kreiner, S., & Nielsen, T. (2013). Item analysis in DIGRAM 3.04. Part I: Guided tours. Research report 2013/06. University of Copenhagen, Department of Public Health.
- Krosnick, J. A., & Fabrigar, L. R. (1997). Designing rating scales for effective measurement in surveys. In L. Lyberg, P. Biemer, M. Collins, E. De Leeuw, C. Dippo, N. Schwarz, & D. Trewin (Eds.), Survey measurement and process quality (pp. 141–164). New York: John Wiley. doi:10.1002/9781118490013.ch6
- Lee, J. C. K., Yin, H., & Zhang, Z. (2010). Adaptation and analysis of motivated strategies for learning questionnaire in the Chinese setting. International Journal of Testing, 10(2), 149–165. doi:10.1080/15305050903534670
- Lee, J. C. K., Zhang, Z., & Yin, H. (2010). Using multidimensional Rasch analysis to validate the Chinese version of the Motivated Strategies for Learning Questionnaire (MSLQ-CV). European Journal of Psychology of Education, 25(1), 141–155. doi:10.1007/s10212-0090009-6
- Marsh, H. W., & Myers, M. (1986). Masculinity, femininity, and androgyny: A methodological and theoretical critique. Sex Roles, 14, 397–430. doi:10.1007/bf00288424
- Masters, G. N. (1982). A Rasch model for partial credit scoring. Psychometrika, 47, 149–174. doi:10.1007/BF02296272
- Mazumder, Q. (2014). Student Motivation and learning strategies of students from USA, China and Bangladesh. International Journal of Evaluation and Research in Education, 3(4), 205–210. doi:10.11591/ijere.v3i4.6288
- Menold, N., Kaczmirek, L., Lenzner, T., & Neusar, A. (2014). How do respondents attend to verbal labels in rating scales? Field Methods, 26(1), 21–39. doi:10.1177/1525822x13508270
- Mesbah, M., & Kreiner, S. (2013). The Rasch model for ordered polytomous items. In K. B. Christensen, S. Kreiner, & M. Mesbah (Eds.), Rasch models in health (pp. 27–42). London: ISTE and John Wiley & Sons, Inc. doi:10.1002/9781118574454.ch2
- Nielsen, J. B., Kyvsgaard, J. N., Sildorf, S. M., Kreiner, S., & Svensson, J. (2017). Item analysis using Rasch models confirms that the Danish versions of the DISABKIDS® chronic-generic and diabetes-specific modules are valid and reliable. Health and Quality of Life Outcomes, 15(1), 44. doi:10.1186/s12955-017-0618-8
- Nielsen, T. (2014). Intellectual style theories: Different types of categorizations and their relevance for practitioners. SpringerPlus, 3, 1. doi:10.1186/2193-1801-3-737
- Nielsen, T., Makransky, G., Vang, M. L., & Dammeyer, J. (2017). How specific is specific self-efficacy? A construct validity study using Rasch measurement models. Studies in Educational Evaluation, 57, 87–97. doi:10.1016/j.stueduc.2017.04.003
- Pedhazur, E. J., & Tetenbaum, T. J. (1979). Bem sex role inventory a theoretical and methodological critique. Journal of Personality and Social Psychology, 37, 996–1016. doi:10.1037/0022-3514.37.6.996
- Pintrich, P. R., & De Groot, E. V. (1990). Motivational and self-regulated learning components of classroom academic performance. Journal of Educational Psychology, 82(1), 33. doi:10.1037/0022-0663.82.1.33
- Pintrich, P. R., Smith, D. A. F., Garcia, T., & McKeachie, W. J. (1991). A Manual for the Use of the Motivated Strategies for Learning Questionnaire (MSLQ). Technical Report No. 91-8-004. The Regents of The University of Michigan.
- Rao, N., & Sachs, J. (1999). Confirmatory factor analysis of the Chinese version of the motivated strategies for learning questionnaire. Educational and Psychological Measurement, 59, 1016–1029. doi:10.1177/00131649921970206
- Rasch, G. (1960). Probabilistic models for some intelligence and attainment tests. Copenhagen: Danish Institute for Educational Research.
- Rasch, G. (1961). On general laws and the meaning of measurement in psychology. Copenhagen: The Danish Institute of Educational Research.
- Rosenbaum, P. (1989). Criterion-related construct validity. Psychometrika, 54, 625–633. doi:10.1007/bf02296400
- Rush, K. (2013). A Quantitative Evaluation of Gender, Nationality, and Generational/Age Influence on Academic Motivation ( Doctoral dissertation). Northcentral University. Retrieved from Proquest.
- Spahr, M. L. (2015). Gender, Instructional Method, and Graduate Social Science Students’ Motivation and Learning Strategies ( Doctoral dissertation). Walden University. Retrieved from Proquest.
- Spence, J. T., & Helmreich, R. L. (1981). Androgyny versus gender schema: A comment on bem’s gender schema theory. Psychological Review, 88, 365–368. doi:10.1037//0033295x.88.4.365
- Tennant, A., & Conaghan, P. G. (2007). The Rasch measurement model in rheumatology: What is it and why use it? When should it be applied, and what should one look for in a Rasch paper?.Arthritis & Rheumatism, 57, 1358–1362. doi:10.1002/art.23108
- Watt, H. M. G. (2016). Gender and Motivation. In K. R. Wentzel & D. B. Miele (Eds.), Handbook of motivation at school. Second edition educational psychology handbook series (pp. 320–339). New York, USA: Routledge.
- Wentzel, K. R., & Miele, D. B. (Eds.). (2016). Handbook of motivation at school. Second edition educational psychology handbook series. New York, USA: Routledge.
- Yoo, S. J., & Huang, W. D. (2013). Engaging online adult learners in higher education: Motivational factors impacted by gender, age, and prior experiences. The Journal of Continuing Higher Education, 61(3), 151–164. doi:10.1080/07377363.2013.836823
- Zhang, L. F., & Sternberg, R. J. (2005). A threefold model of intellectual styles. Educational Psychology Review, 17(1), 1–53. doi:10.1007/s10648-005-1635-4
- Zimmerman, B. J. (1986). Becoming a self-regulated learner. Which are the key subprocesses? Contemporary Educational Psychology, 11, 307–313. doi:10.1016/0361476x(86)90027-5
- Zimmerman, B. J. (2002). Becoming a self-regulated learner: An overview. Theory into Practice, 41(2), 64–70. doi:10.1207/s15430421tip4102_2
Appendix
Table A-1. Items and response scales in the Danish translation of the MSLQ intrinsic and extrinsic motivation scales, provided in Danish and English