?Mathematical formulae have been encoded as MathML and are displayed in this HTML version using MathJax in order to improve their display. Uncheck the box to turn MathJax off. This feature requires Javascript. Click on a formula to zoom.
Abstract
In a scenario of significant growth in the supply and demand of higher education programmes in Colombia, this study proposes a modelling system based on data mining techniques to characterise this market after obtaining quality information about first-term students. The research uses a sample of 3548 programmes in Colombia, which represents 50% of higher education students in the period between 2012 and 2014. It is concluded that the private higher education reproduces social inequalities in the sense that it restricts by the way of costs, the access to the high-quality supply and avoid the best students to be received there. The modelling strategy creates an instrument that allows visualisation and locating of each microdata (academic programme) in a segmentation based on academic and socio-economic variables which converts the result of the research into an academic portfolio management tool for higher education institutions.
PUBLIC INTEREST STATEMENT
This work deals with the problem of social and economic inequality in Colombia. From an analysis with public data, it is concluded that the differences are reproduced in the higher education system. The results allow to visualize the academic programs on a map by similarity. The analysis methodology is data mining.
1. Introduction
The growth of private Higher Education programmes in Colombia is an issue contemplated in recent research. The study of Camacho et al. (Citation2016) for the Inter-American Development Bank (IDB) highlights that in 2001, the number of higher education programmes was 3600 and raised up to 6276 in 2011 which represents an increase of 74.3%, whereas the total population of students increased by 13.7%. Considering the evidence, the performance of some of these new higher education programmes has not been better than the existent ones, for at least three reasons: 1) The salaries are 15% lower, 2) students entering score 5% lower in the Saber-11 test (pre-admission exam in higher education). This difference has remained stable over time, and 3) in summary, the results in the Saber-pro tests (grade-level examination) decreased in recent programmes as compared with the older ones. This issue becomes essential as it is a global trend (Altbach, Citation1999; Buckner, Citation2017) framed in the educational implications of neoliberalism and the transformation of the university from cultural institution advocating the value of knowledge by itself, to a training center for labour market whose activity is subject to efficiency and effectiveness measurements as criteria for allocating public and private resources (Olssen & Peters, Citation2005). Besides, the link between the labour market and higher education fosters an extremely specialisation shuffling over time as new technologies and jobs emerge (Savage, Citation2013).
The phenomenon of supply growth, with new programmes denominations, is not new, at least for the Colombian case. At the beginning in the 1990s, Patrinos (Citation1990) noted that Colombia was one of the countries with the highest proportion of private education in Latin America; in 1983, 63% of students attended a private institution. He highlighted the risks of this type of educational supply, where institutions focused on obtaining financial gains, achieving it at the cost of quality through accounting mechanisms able to evade the state regulation that prohibits searching profits in the higher education supply.
According to the Ministry of National Education (MEN), in 2010 the private higher education enrolment in the entire country was 44.6%. In 2018 that percentage rose to 55.7. In 2020, the average tuition fee in private institutions is 1896 dollars per semester and the minimum monthly salary is 228 dollars. The data can be consulted in the public statistics website: https://snies.mineducacion.gov.co/portal/ESTADISTICAS/
To correct some market failures, the Colombian State organized a quality assurance system in charge of the MEN through Law 30 of 1992. The official regulation requires that all undergraduate and postgraduate programs have at least a qualified record, which is obtained after demonstrating that 15 quality conditions regarding both the program and the institution are met. In order to obtain the license, HEIs undergo an evaluation process that includes a peer visit and subsequently a decisional evaluation by an intersectoral group of experts organized in rooms by areas of knowledge. On the other hand, when the academic programs have graduated several cohorts of graduates, they can aspire to obtain high-quality accreditation. To achieve this, they undergo an evaluation process similar to that of qualified registration, but in this case the evaluation is more thorough and involves the detailed review of 40 conditions, by the National Accreditation Council (CAN), an entity attached to the MEN that administers the entire process: definition of procedural guidelines, peer assignment and final evaluation by a single council. In both cases (qualified registration and accreditation), the evaluation allows each HEI to define its own indicators and support the level of quality that it considers to have been achieved based on its standards and institutional philosophy, which has generated criticisms regarding the objectivity and rigor of the System of quality assurance (Blasco, Citation2011).
In Colombia, despite having established standards and procedures, in the Regulatory Unique Decree 1075 of 2015, the notorious growth of the supply is in part due to the flexibility of the State system of quality assurance. The results of Guarín et al. (Citation2016), showed that the growth of supply is concentrated in the private sector and has relied on the proliferation of low-quality programmes, thus revealing two academic elites: high-level private universities and public universities. In the middle, there is a variety of mid and low-academic level institutions attended by those who cannot access public universities, and neither can have the resources to pay for elite private universities.
The development of the supply in higher education comprises an expansion of programmes in the fields of knowledge in which each higher education institution (HEI) has some experience (Carranza & Ferreyra, Citation2017). The growth is related to: an increasing rate of coverage in secondary education, the state financing through the Colombian Institute of Educational Credit and Technical Studies Abroad (ICETEX), the expansion of the National Service of Learning, and the facilities for incomes derived from a supply of affordable prices and flexibility reflected in the scheduling of classes outside working hours, as well as in 100% online programmes. At the aggregate level, this growth has two dimensions: the private supply focuses on the fields of economy, administration, and accounting, whereas public universities rely on the areas of engineering and education (Carranza & Ferreyra, Citation2017).
Due to economic inequality in Colombia, the growing Higher Education Market (HEM) established a mixed system that exhibits well-differentiated results in both, the academic achievement measured by public tests; and labour market performance of the graduates. The imbalance has a clear correlation with uncontrolled variables of students as the socioeconomic and scholarly levels of their parents (Cuenca, Citation2016), which structures a system that preserves class distinctions based more on the social origin than on individual capabilities, as a kind of transference of the cultural capital inside families (Bourdieu & Passeron, Citation1990).
The purpose of the present study is to characterise the central inequalities in the HEM from a perspective of the academic and socio-economic data of new students entering higher education which implies a limited scope to undergraduate programmes. Additionally, it illustrates how the conditions of social origin guide the programme choice in a separable HEM by quality, price, and field of knowledge in both micro and macro levels. To meet the objective, this article implements an unsupervised data mining methodology that organizes a large volume of information by grouping academic programs by similarity in the students they receive, and then discovering by means of descriptive statistics the variables that determine the differences between groups.
Establishing a neoclassical-parametric microeconomic model to explain the determinants of the choice of potential higher education students, is not considered in this work because it results in unrealistic results given some complex characteristics of the HEM (Dill, Citation1997). For example, the incompleteness of information and ethical conflicts implicit in commercial relationships that could emerge in the supply and demand of education. Additionally, an over specialised economic approach is not necessarily consistent with the nature of education legally defined as not-for-profit but focused on quality rather than coverage. However, considering that nowadays, education is one additional link in the chain of production required for access to work in fairer conditions (Gasparini et al., Citation2011), it is not inconsequential to characterise the HEM taking into account programmes costs and socio-economic features of the students, which is useful in public policy and academic portfolio management for ethical marketing inside each HEI (Gibbs & Murphy, Citation2009).
This study applies data mining techniques. The main advantage of this approach is its capability of producing information about each observation, in this case, each undergraduate programme, instead of aggregating results as achieved by classical econometric techniques employed in this kind of studies, although the proposed model can produce descriptive statistics at the macro level after a clustering process.
This work aims to design a reliable instrument for characterisation of the higher education demand at a programme and HEI level, promoting ethical marketing and the focused public quality assessment oriented by segments rather than by unified criteria.
Therefore, the scope is to contribute to the design and evaluation of public policy on education and equality.
This document comprises five sections: 1) introduction, 2) data preparation 3) methodology, including a brief discussion about the limits of the traditional economic approaches in the context of education marketing, which justifies the application of data mining techniques, 4) results, and finally, 5) Conclusions.
2. Data preparation
State databases from the Ministry of National Education were taken as the source of information, using the records of the academic programmes. This study joins two databases, one containing the results of the state tests for secondary education (Saber 11) and the other with higher education ones (Saber pro). Both conducted by the Colombian Institute for the Assessment of Education (ICFES). The first database includes the socio-economic information of high school graduates, candidates to continue in higher education. The public database of MEN called “SNIES” provides further details about the characteristics of the programmes where candidates got enrolled.
Using the last information available, databases from the Saber-pro tests for the years 2012, 2013 and 2014 were consolidated with the purpose of crossing them over with Saber-11 records obtained between three and 6 years back. This procedure gets a master database that, in addition to the socio-economic data of higher education candidates, reveals which of these candidates got accepted and to what programme and institution.
The ICFES tests annually evaluate roughly 500,000 high-school and 250,000 college students. The steps required to build a master database were as follows:
2.1. Merging the databases of the tests
The databases of the test Saber 11 do not have all the same fields; therefore, it was necessary to take each one, examine it and rename it, to then take common databases and merge them on a single one. The same occurred with Saber pro.
2.2. Crossing over of databases
The Saber-11 and Saber-pro databases lack a common key because the Colombian State issued an identity document with a different number for the elderly and minors and this creates traceability problems. It is not possible to cross them easily because when students are taking the Saber-11 test, they usually are minors but when taking the Saber–Pro test, they have a different adult document number. In this regard, ICFES developed a temporary solution: a crossover table that matches Saber-pro codes with Saber −11 codes. However, this solution has a success rate of 50%.
2.3. Crossing the resulting database with the information by the National System of Higher Education Information (SNIES)
The SNIES database contains data of the academic programmes approved by the MEN. This database and the Saber–Pro database do have a common key: the code of the programme; therefore, the crossing over takes place without loss of information.
2.4. Grouping by programme
A master database is achieved after the calculation of student’s variable averages for each programme.
3. Identification of noise variables: internal consistency of the database
The concept of internal consistency in a database refers to the soundness regarding the correlation of the variables. When all the variables are correlated, there is strong internal consistency, and the opposite occurs when each variable is independent of the others. According to Lebart et al. (Citation1995), it is possible to select variables that guarantee the internal consistency of the database. The variables that have high values in the first reduced dimensions are taken by the analysis of main components (1, 2, 3) while those represented in the other axes are discarded (4, 5). This procedure is performed in an unsupervised analysis (in a supervised analysis, it could eliminate valuable information) to remove noise variables.
For this study, the noise variables were eliminated, obtaining a database with internal consistency confirmed by the set of variables of the students, according to table.
Other variables characterising the programmes were later included for the descriptive analyses to find relationships between the supply (programme variables) and the demand (student’s variables). The cleaned database is available in a professional repository. Persistent URL: http://doi.org/10.3886/E108536V1
4. Methodology
Selecting appropriate instruments according to the aim of this research entailed a discussion on the limits of the classical election theory. There is a risk of lack of originality related to falling into another study about inequalities in HEM at the aggregate level, searching to identify significant variables explaining variability on academic achievement or labour success of the graduates. The concern is not about the importance of these issues, but how to address new studies contributing to a more detailed understanding able to provide insights and on how to manage inequality at the micro (marketing management) and macro (public policy) levels.
4.1. Limitations of a traditional approach to the HEM problem
Thinking about the HEM from a neoclassical microeconomic perspective involves using a model that, by simplifying the reality, removes major imperfections. First, in this approach, the market should have a point of balance between supply and demand based on price levels to maximise profitability. This maximum profit way assumes the rationality of the agents, complete information and therefore full differentiation of the services that are accessed based on quality levels; which are conditions not reasonably acceptable in the HEM. Higher education is a complex service whose success does not depend only on the provider since the capabilities and background of the applicants are also crucial as shown by Camacho et al. (Citation2016).
Nobody can select a programme with full knowledge of the supply’s characteristics. An applicant must choose at least one object of study that almost always, merges with several disciplines, giving rise to epistemological and methodological dilemmas about validity. He/she also should know the scenarios of the future professional development, after obtaining his/her professional degree related to salaries, fields of specialisation and demand for skilled labour in those areas. Even more so, it is reasonable for the candidate and the graduate to consider an inconsistency between the labour performance intentions because time can change preferences. For example, in the Peruvian case, only 35% of higher education students are satisfied with the programme they chose, in the context of a growing supply that allowed a coverage rate that raised up to 60% (Castro & Yamada, Citation2013).
Colombian HEM comprises approximately 500,000 high school students who graduate each year, which accounts for a supply reaching almost 7,000 programmes.Footnote1 A scenario of this nature supposes an inability for candidates to make a rational choice from the supply not only for its amplitude but also for rationality issues mentioned before.
Even with its imperfections, the microeconomic research has been developed to find the determinants of demand using available information. In the case of the United States, the studies developed by Koshal and Koshal (Citation1999) are an essential reference. In a linear econometric model, it was found that the cost of enrollment, the size of the institution, state financial aid, unemployment rate, size of the applicant’s family and the quality of education are all significant explanatory variables. Meanwhile, in a similar study focused on the demand for PhD programmes Koshal et al. (Citation1994), also considered the level of education of faculty members significant.
Although there is a coincidence between the variables used in some models of supply and the demand for higher education, the methodological strategy opted for developing this research differs from the use of traditional econometric instruments. This approach has advantages for two reasons. First, it can incorporate a significant number of variables into the model, taking as a starting point, all those collected by the State when applying standardised tests. A subsequent new research can produce descriptive studies according to the institution’s needs by using instruments of this research as input for handling their academic portfolio. The second gain is the creation of a two-dimensional map positioning the programmes. So, in a sneak peek, it is very easy to identify which of them receive similar students or not, just by the criteria of how close they are.
4.2. Use of data mining techniques in education
The Educational processes can leave traces of information associated with academic and administrative procedures. In the first case, educational institutions have the option and the need for collecting data generated from academic exercises.
Examples of this include grades, results of surveys on teacher evaluation, dissertation statistics and historical information on the student’s socio-economic variables. In a review article, Romero and Ventura (Citation2010), described the possibilities of academic-administrative management using data mining techniques and the role played by each player in the academic community in these projects. Administrators need to manage the academic portfolio, for which it is vital for them to have a level of demand that at least allows them to survive. To achieve it, they can use the information collected from their students, to locate the institution in the market segment and characterise the institutions and programmes with which they compete. By doing so, they can explore market visualisation strategies and groupings by comparison.
To characterise educational demand as the primary input in the design of the supply, the work developed by Lin et al. (Citation2011) is key, in which some companies must define training for their employees, seeking relevance to their work and in particular, minimising the probability of failure. As a solution, they used a k-means clustering strategy based on historical information. The procedure establishes similarities in the characteristics of the individuals, groups them together and makes recommendations jointly for educational training; this methodology was applied in the present investigation. Although strategies of predictions used in supervised models can be applied (Jantan et al., Citation2011), at least for now, they are out of reach.
The processing of the data of the master database is oriented to find similarities among the academic programmes for clustering them using average values of their students (Erhardt & von Kotzebue, Citation2016). This kind of non-supervised models can deal with multidimensional databases to come upon useful patterns in customer profiling research (Viktor et al., Citation2012). Since the clustering strategy makes the visualisation of the entire master database difficult, this study uses the technique of dimension reduction (DR) from the beginning. After searching methods and running experiments, we choose the newest Distributed Stochastic Neighbour Embedding (t-SNE) because it showed being effective in classification problems. Besides, as this technique uses Euclidean distances to define neighbourhoods in a two-dimensional map through a stochastic procedure, it is compatible with k-means for a consistent analysis.
Hence, k-means is useful for aggregate analysis and it corroborates results found in last studies, while the visualisation by DR leads a micro-analysis for each programme involved in the sample, where given the computational economy of the selected model, it has the quality and availability of the information as unique constraints.
The following subsection presents the main characteristics of the two instruments:
4.3. Cluster k-means
The purpose of this algorithm is to find a set of clusters Ci … Ck that minimises the Euclidean distances between a representative point of each cluster and its other members. Distances are expressed through the objective function (O) (see EquationEquation 1(1)
(1) , also called the cost function (Aggarwal, Citation2015, p. 159):
where represents norm Lp and is the quadratic error of the approximation of one data to its representative point. Xi · · · Xn represents each programme with its multidimensional features aggregated by using the mean of the students enrolled, and Yi · · · Yk each representative point of the clusters, also called centroids. In the k-means algorithm, each one is equal to the local average of all cluster data.
The selection of the centroids and the data that makes the cluster follows an algorithm that minimises the cost function of EquationEquation 1(1)
(1) . The next steps describe synthetically how the process works (Aggarwal, Citation2015, p. 162):
1. Grouping algorithm: (Database: D, Number of representatives: k)
2. Start: Initialize a representative set S;
3. Repeat: Create clusters (C1 … Ck) allocating point in D to its closest representative in S using a distance function. EquationEquation 1(1)
(1) recreates the set S by determining a representative point Yj for each Cj that minimizes the cost function.
4. Unless: convergence appears;
5.Return: (C1 … Ck);
6. End
4.4. Display t-SNE
The t-SNE technique, developed by Van Der Maaten and Hinton (Citation2008), is a dimension reduction technique designed for a very high-dimensional database in which there are many variables involved. This technique takes the matrix of Euclidean distances between the points and transforms it into a probability matrix by means of the following expression:
The term is interpreted as the probability that the element
has a neighbour
, where
is the set of programmes involved in the sample. The term neighbour refers to a closeness generated by a Gaussian distribution centred on xi. The typical deviation of each kernel σi is calculated in agreement with the density of data. Therefore, the most densely populated regions have typical deviations σi that are smaller. An analogous calculation is made with the corresponding points yi in a smaller space conveniently taken to two or three dimensions for a simple and powerful visualisation. Thus,
The term is interpreted as the probability that the element
has the element
as a neighbour in a low dimension space. In this case, the term neighbour refers to a closeness generated by a Student’s t-distribution of heavy tails cantered on
. Then, the algorithm comprises locating the points
by minimising the divergence of Kullback Leibler between the distribution Q and the distribution P. This minimisation strategy is widely used, so it is not described here, but the paper of Van Der Maaten and Hinton (Citation2008), presents a detailed explanation.
This method is useful for understanding the points cloud structure since it creates a powerful visualisation that reflects the distances and groups formed by the data. In principle, it established a first approach to the composition of data in the master database. However, after conducting the entire process of constructing the scatter plot, we found that it was possible to identify a segmentation for the variables of some programmes. The next results section explores the conclusions obtained after conducting the model with the two techniques presented before.
5. Results analysis
The findings in the visualisation of two dimensions are presented using the t-SNE technique and later in the groupings of clusters. With the aim of being synthetic, the features displayed in this paper were selected according to two criteria: first, the ability to show a high concentration potential, which can be easily identified thanks to the quality of the graphics. Secondly, the interpretation includes variables that coincide with those that have been statistically significant in similar previous studies. Therefore, we achieve a broader set of determinant variables of demand and supply that are not only available to an aggregate explanation of the HEM, but also have a great potential for grouping at the programme’s level, which is one of the most innovative features of this work.
6.1. Scatter plot t-SNE
When constructing a point cloud into two dimensions with the variables involved using the t-SNE reduction technique, an oval-shaped graph is obtained and in which each point represents a programme by means of its SNIES code.Footnote2 The information behind this representation is a distance model in which the closeness/remoteness between points represents the similarity/difference of the students entering each programme, in terms of the means of all the variables that characterise them. Thus, two nearby points represent programmes that receive very similar students regarding the socio-economic and academic variables contemplated in . The opposite happens when there are very distant points; they represent two programmes that receive very different students.
Table 1. Student’s variables
As a visualisation tool, the same point cloud was painted based on all the variables used within the model which collects the information of the students when they graduate from middle school. The results of this visualisation were explored by incorporating variables associated with the characteristics of the programmes to the contrast of colours so that, in each graph the fill or colour of each point is a function of the mean of a specific variable. This method leads to a remarkable result: the variables that show clear segmentation are related to the cost of enrollment. shows the proportion of students who pay a tuition fee within a certain interval.Footnote3 So, the darkest a point (programme) is, the more significant the proportion of students in each category of fee are.
Figure 1. Sectorization per cost of enrollment
The segmentation is evident, so each painted zone moves anticlockwise as the cost decreases. In the end -graph (e)-, the section of lower cost programmes comprises almost entirely the public supply, as shows. This visualisation uses other socio-economic variables by using contrasting colours and the cost of enrolment is the one that showed the best results concerning clear segmentation.Footnote4 The examples in the appendix illustrate that HEIs usually receive students from similar socio-economic and academic characteristics in all their programmes.
Figure 2. Sectorization per type of HEI
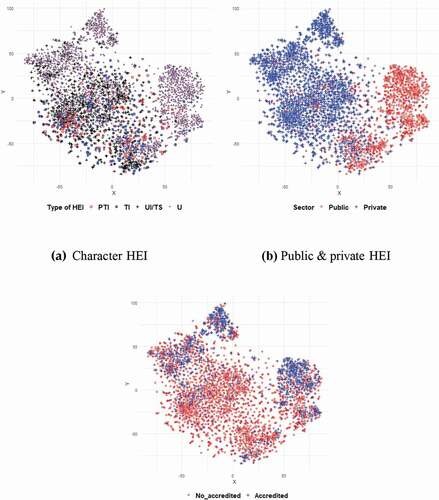
allows locating the supply segment according to the character of the HEI. In Colombia, the State established the four categories presented in ), with the purpose of limiting the maximum level of training that each HEI can offer, according to its capacity. Thus, Professional Technical Institutions (PTI) can only provide degrees at the technical level, before the technological level, which is the maximum for technological institutions (TI). College Institutions (UI/TS) can offer professional programmes and some postgraduate ones that arise after reaching the accreditation of their undergraduate programmes. The universities (U) can offer programmes of any level. With no justification in sight, the programmes offered by college and technological institutions are usually in areas of middle costs. Finally, from ) and (c), it is inferred that accredited, high-quality programmes are elites at the very top of the oval and they are mostly, high-cost supply from private universities (left side) or public universities (right side). The low level of accreditation of the programmes provided in college and TI’s is striking; however, the explanation of this behaviour is beyond the scope of this study.
6.2. Segmentation by clusters
After recognising the existence of sectors defined by economic variables associated with the cost of enrollment, the character of the HEI and high-quality accreditation in the DR, the k-means grouping technique reveals additional information. First, by using Microsoft Azure sweep clustering module, which uses the Davies Bouldin metric to minimise the dispersion of each cluster, it was found that the cost (see EquationEquation 1)(1)
(1) is reduced grouping programmes in five clusters (See ). The variables used for the grouping are the same as those considered in the t-SNE visualisation and, as in the previous technique, the optimisation process is based on Euclidean distances. Therefore, DR and grouping by clusters are coherent as illustrated in where the t-SNE cloud exhibits a clear sectorization when colouring each programme according to the cluster to which it belongs.
Table 2. Percent distribution of the programmes in each one of the clusters
Figure 3. Display t-SNE by clusters
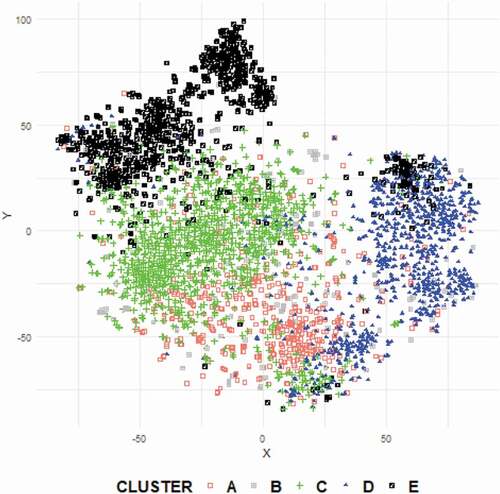
After the definition of clusters, a descriptive study of each one becomes feasible. By examining each characteristic, significant variability is revealed throughout the clusters in the average results of the college tests (Saber-11), the teaching methodology, the proportion of students who work and the education level of the student’s parents.
In , the proportion of accredited programmes for each cluster is presented in percentage terms and to an adjusted scale. Box plot representing the results of the Saber 11 test is superimposed (boxplot represents the average of all fields evaluated in the test). The clusters are organised from left to right, beginning with the one that groups the programmes that receive students with the lowest median in the Saber 11 test (cluster A), to those that recruit students with the best performance in the test (cluster E). The ordered graph shows the relation between the academic quality of new students, from the perspective of the result of a standardised test; and the level of programmes with high-quality accreditation. Thus, a clear characteristic of the HEM is that in part, the best programmes receive better students (Camacho et al., Citation2016).
Figure 4. Distribution in clusters (Accreditation, method, proportion of: student workers, parents with university degree
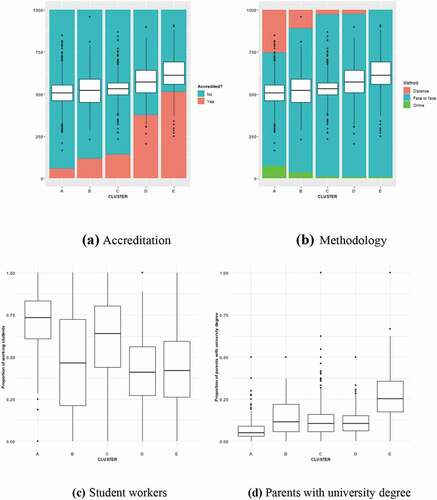
From 4(b) and 4(c), it can be easily inferred that distance learning method is associated with low-quality levels as clusters A and C grouped few accredited programmes and in the worst case (cluster A), it coincides with a high proportion of working students.
The visualisation of all numeric features reveals that the proportion of working students exhibits an extraordinary variability among clusters. In that sense, it is worthwhile to highlight the scarcity of research about this phenomenon in both conceptual (Riggert et al., Citation2006) and empiric analysis at least for the Colombian case. Finally, 4(d) shows a clear influence of the academic level of the parents in the election of programmes in the cluster E, that can be interpreted as the best, given the highest scores in the saber 11 test and the major proportion of accredited programmes. This phenomenon is typically described as the transference of cultural capital (Cuenca, Citation2016).
The segmentation exercise discloses evidence of inequality between areas of knowledge, as evidenced by the data in , which presents the percentage distribution of the programmes of each field throughout the clusters. This finding characterises a preference of some programmes over others and establishes a new way of finding elite and disadvantaged groups based on their objects of study.Footnote5
Table 3. Distribution of programme areas throughout the clusters
The segmentation by knowledge area is an additional criterion for those encountered in the t-SNE visualisation to identify the determinants of demand. This criterion was somewhat predicted since the expectancy of return on capital investment in higher education from a market perspective is essential for the selection and can vary with the name of the programme (Tao, Citation2006). This election distortion highlights a possible effect of the absence of a state programme for steering the choice of programmes based on reliable information about the academic and labour market performance of graduates (Pilz, Citation2016).
7. Conclusions
The segmentation of the HEM achieved through this research demonstrates a profoundly inequitable market structure for higher education regarding quality and cost. However, it is imperative to recognise that as complex and multi-defined concept (Shavelson et al., Citation2016), quality is not only about the official recognition but also it is related to some omitted variables as research rankings, teacher’s levels of study and chiefly, labours market performance. Indeed, in this study, labour performance not included due to the lack of a coded database with that information at programmes level. Neither the id of graduates for a cross-study was available.
At micro-level, it is possible to establish that each HEI serves a specific sector of demand characterised by concerning the socio-economic and academic variables that describe it. Key studies about the student’s choice are related to the influence of supply features, since the beginning of the related literature (Tierney, Citation1983), which highlights the significance of some characteristics as the expectations of salary, tuition and prestige, in a large set of a heterogeneous supply (Shtudiner et al., Citation2017). However, it is not the Colombian case. In a sneak peek, it seems to be a market where the consumer could choose considering relevant differences among the programmes and HEIs because of its heterogeneity. Still, background research reveals that the path of education is determined by aspects out of the student’s control, which implies concerns about the inequality as the success, sized in terms of academic achievements and labour performance, is not settled by the people’s effort, regardless of their social origin (Breen & Jonsson, Citation2005).
Issues raised in this paper about inequality associated with the significance of non-controlled features by the students on the choice and access to high-quality education are not the main contribution of this study, but a validation criterion for designing a toolbox to characterise HEM with sustenance in demand-side features. Due to the lack of an analytic framework, understanding the choice in a complex market requires a new microeconomic approach (Elsner et al., Citation2014); that was the reason to explore data mining tools in a great set of non-parametric instruments, under lemma “let data talks by itself”, instead of asking how fine data adjust in the parameters of an analytic model.
This research advocates for the subsequent developments in public policy to reduce inequality in short and long-term and managing HEIs with the focus of ethical marketing designing tailored programmes for the group of students usually enrolled with full consciousness of the near options in terms of competence attending similar people Hence, as the main contribution, this study provides basis attempting to solve the problem related to the decision of designing and promoting programmes in a competitive market with possibilities of cooperation (Hemsley-Brown & Oplatka, Citation2006).
In the context of the new policies for the promotion of higher education, with this study, the Colombian State can have micro-informed information to characterize the segments of the supply of higher education that are significantly exclusive (high quality for a economically and academically privileged segment) and that become a source of inequality: in view of this reality, the State can act either by subsidising the high-quality private sector, to make it accessible to people of a more heterogeneous origin, or to increase the high-quality public education supply.
The visualisation of programmes through a reduction dimensions strategy is a powerful tool for institutions to locate their programmes in a closeness map, to know the characteristics of the population served in further detail and the nearby supply that represent their direct competition. Nevertheless, beyond that, this paper was aimed at reflecting the inequitable character of Colombian higher education, which classifies students according to their economic and academic background and replicates these inequities within them.
The existence of areas that concentrate the most accredited programmes deserves an analysis about canalisation of public resources. Concerning the funding, Colombia presents two scenarios: public universities, funded by the State, and private universities receiving limited subsidies. As illustrated before, access to high-quality private education is onerous and shows more privileged academic and socio-economic characteristics. The reviewed literature established that promotion of the public supply guarantees more efficient and democratic access to high-quality higher education. Even with State regulation, the experience and promotion of online and distance education, the programmes supplied under these methods do not recruit the best students in academic terms and have not achieved the same high-quality recognition levels regarding face-to-face programmes, placing them in the lowest performing clusters. In that sense, international comparative studies find the same problem in other countries (Kamal Basha et al., Citation2016).
Finally, it is valuable to highlight that the highest growth in the lowest-quality institutions has been in economic sciences. This result behaves a concern for the authors because of his research areas, and it is also a window for further jobs about the influence of disciplines on inequalities in HEM.
Declaration of interest statement
The authors declare that they have no known competing financial interests or personal relationships that could have appeared to influence the work reported in this paper.
Acknowledgements
I thank the Politecnico Grancolombiano Institution for all the support, especially to its research department. I also acknowledge Nohora Forero, Krupskaia Quintero and Gabriel Angulo for their suggestions and corrections.
Additional information
Funding
Notes on contributors
Frederick Andrés Mendoza Lozano
Frederick Andrés Mendoza Lozano Full-time professor at the Politecnico Grancolombiano. Expert in quality assurance issues in higher education. Researcher in data analytics topics applied to education.
Julian Mauricio Cruz Pulido
Julian Mauricio Cruz Pulido Technical director at Excelencia Académica SAS: a consulting company dedicated to research to improve basic and higher education with quantitative tools. Professor at the Externado University and National University in data analytics courses using classical statistical techniques and data mining.
José Félix García Rodríguez
José Félix Rodríguez Full-time professor at the Universidad Juarez Autónoma de Tabasco. Titular researcher of the CONACYT in Mexico. His research works are mainly oriented to studies of multidimensional poverty and health economics.
Notes
1. The number varies every year because some programmes are inactivated by the decision of HEIs or MEN, and others are created.
2. According to the state cataloguing this identifier is associated with the name of the programme, the HEI that supplies it, modality and municipality.
3. Differences in tuition fee between the students of the same programme are due to scholarships and politics of some HEIs that set their fees in accordance with the income of the students’ families.
4. Matches particularly with the stratum, the income level of the student’s family nucleus and their parent’s level of education.
5. The least favoured area of knowledge is economy, administration, accounting and related: only 30.7 % of its programmes are in the best clusters (D and E). It is easy to find in the detail of the data, that the growth of higher education programmes has been concentrated in this area, which is characterised, among others, by low supply costs since it is not intensive in specialised infrastructure.
References
- Aggarwal, C. C. (2015). Data mining: The textbook. Springer.
- Altbach, P. G. (1999). The logic of mass higher education. Tertiary Education and Management, 5(2), 107–20. https://doi.org/https://doi.org/10.1080/13583883.1999.9966985
- Blasco, C. M. (2011). Calidad, evaluación y acreditación en la educación superior: a propósito de un proyecto de reforma en Colombia. Pensamiento Jurídico, (31), 155–185.
- Bourdieu, P., & Passeron, J.-C. (1990). Reproduction in education, society and culture (Vol. 4). Sage. https://doi.org/https://doi.org/10.1146/annurev.soc.31.041304.122232
- Breen, R., & Jonsson, J. O. (2005). Inequality of opportunity in comparative perspective: Recent research on educational attainment and social mobility. Annual Review of Sociology, 31(1), 223–243. https://doi.org/https://doi.org/10.1146/annurev.soc.31.041304.122232
- Buckner, E. (2017). The worldwide growth of private higher education: Cross-national patterns of higher education institution foundings by sector. Sociology of Education, 90(4), 296–314. https://doi.org/https://doi.org/10.1177/0038040717739613
- Camacho, A., Messina, J., & Uribe, J. P. (2016). The expansion of higher education in Colombia: Bad students or bad programs? Inter-American Development Bank Discussion paper. https://doi.org/https://doi.org/10.18235/0000303
- Carranza, J. E., & Ferreyra, M. M. (2017). Increasing higher education coverage: Supply expansion and student sorting in Colombia. Journal of Human Capital, 13(1), 95–136. https://doi.org/https://doi.org/10.1086/701435
- Castro, J. F., & Yamada, G. (2013). Declining higher education quality affects postsecondary choices: A peruvian case. International Higher Education, 70(70), 1–6. https://doi.org/https://doi.org/10.6017/ihe.2013.70.8715
- Cuenca, A. (2016). Desigualdad de oportunidades en Colombia: Impacto del origen social sobre el desempeño académico y los ingresos de graduados universitarios. Estudios Pedagógicos Valdivia, 42 (2), 942–964. http://www.scielo.cl/scielo.php?script=sci_arttext&pid=S0718-07052016000200005
- Dill, D. D. (1997). Higher education markets and public policy. Higher Education Policy, 10(3–4), 167–185. https://doi.org/https://doi.org/10.1016/S0952-8733(97)00011-1
- Elsner, W., Heinrich, T., & Schwardt, H. (2014). The microeconomics of complex economies: Evolutionary, institutional, neoclassical, and complexity perspectives. Academic Press. https://doi.org/https://doi.org/10.1016/c2012-0-06498-8
- Erhardt, D., & von Kotzebue, A. (2016). Competition unleashed: Horizontal differentiation in German higher education. Tertiary Education and Management, 22(4), 333–358. https://doi.org/https://doi.org/10.1080/13583883.2016.1233993
- Gasparini, L., Galiani, S., Cruces, G., & Acosta, P. (2011). Educational upgrading and returns to skills in latin america: Evidence from a supply-demand framework, 1990-2010 (Discussion paper series). https://doi.org/https://doi.org/10.3386/w24015
- Gibbs, P., & Murphy, P. (2009). Implementation of ethical higher education marketing. Tertiary Education and Management, 15(4), 341–354. https://doi.org/https://doi.org/10.1080/13583880903335472
- Guarín, A., Londoño, S., Medina-Durango, C. A., Parra, J., Posso-Suárez, C. M., & Vélez, C. E. (2016). Estimating the effect of attending a public versus a private university in Colombia on academic achievement. Borradores de Economía, 968. https://doi.org/https://doi.org/10.32468/be.968
- Hemsley-Brown, J., & Oplatka, I. (2006). Universities in a competitive global marketplace: A systematic review of the literature on higher education marketing. International Journal of Public Sector Management, 19(4), 316–338. https://doi.org/https://doi.org/10.1108/09513550610669176
- Jantan, H., Hamdan, A. R., & Othman, Z. A. (2011). Talent knowledge acquisition using data mining classification techniques. 2011 3rd Conference on Data Mining and Optimization (DMO), 32–37. https://doi.org/https://doi.org/10.1109/DMO.2011.5976501
- Kamal Basha, N., Sweeney, J. C., & Soutar, G. N. (2016). International students’ university preferences: How different are malaysian and chinese students? International Journal of Educational Management, 30(2), 197–210. https://doi.org/https://doi.org/10.1108/ijem-08-2014-0122
- Koshal, R. K., & Koshal, M. (1999). Demand and supply of educational serice: A case of liberal arts colleges. Education Economics, 7(2), 121–130. http://www.tandfonline.com/doi/abs/ https://doi.org/10.1080/09645299900000011
- Koshal, R. K., Koshal, M., Boyd, R., & Levine, J. (1994). Tuition at phd-granting institutions: A supply and demand model. Education Economics, 2(1), 29–44. https://doi.org/https://doi.org/10.1080/09645299400000003
- Lebart, L., Morineau, A., & Piron, M. (1995). Statistique exploratory multidimensionelle. Dunod. https://doi.org/https://doi.org/10.1080/09645299400000003
- Lin, W. T., Wang, S. J., Wu, Y. C., & Ye, T. C. (2011). An empirical analysis on auto corporation training program planning by data mining techniques. Expert Systems with Applications, 38(5), 5841–5850. https://doi.org/https://doi.org/10.1016/j.eswa.2010.11.038
- Olssen, M., & Peters, M. A. (2005). Neoliberalism, higher education and the knowledge economy: From the free market to knowledge capitalism. Journal of Education Policy, 20(3), 313–345. https://doi.org/https://doi.org/10.1080/02680930500108718
- Patrinos, H. A. (1990). The privatization of higher education in colombia: Effects on quality and equity. Higher Education, 20(2), 161–173. https://doi.org/https://doi.org/10.1007/BF00143699
- Pilz, M. (2016). Typologies in comparative vocational education: Existing models and a new approach. Vocations and Learning, 9(3), 295–314. https://doi.org/https://doi.org/10.1007/s12186-016-9154-7
- Riggert, S. C., Boyle, M., Petrosko, J. M., Ash, D., & Rude-Parkins, C. (2006). Student employment and higher education: empiricism and contradiction. Review of Educational Research, 76(1), 63–92. https://doi.org/https://doi.org/10.3102/00346543076001063
- Romero, C., & Ventura, S. (2010). Educational data mining: A review of the state of the art. IEEE Transactions on Systems, Man and Cybernetics Part C: Applications and Reviews, 40(6), 601–618. https://doi.org/https://doi.org/10.1109/TSMCC.2010.2053532
- Savage, G. C. (2013). Tailored equities in the education market: Flexible policies and practices. Discourse, 34(2), 185–201. https://doi.org/https://doi.org/10.1080/01596306.2013.770246
- Shavelson, R. J., Domingue, B. W., Mariño, J. P., Molina Mantilla, A., Morales Forero, A., & Wiley, E. E. (2016). On the practices and challenges of measuring higher education value added: The case of Colombia. Assessment and Evaluation in Higher Education, 41(5), 695–720. https://doi.org/https://doi.org/10.1080/02602938.2016.1168772
- Shtudiner, Z., Zwilling, M., & Kantor, J. (2017). Field of study choice: Using conjoint analysis and clustering. International Journal of Educational Management, 31(2), 179–188. https://doi.org/https://doi.org/10.2139/ssrn.2732594
- Tao, H. L. (2006). The demand for higher education and a test of the extreme screening hypothesis. Education Economics, 14(1), 75–88. https://doi.org/https://doi.org/10.1080/09645290500481899
- Tierney, M. L. (1983). Student college choice sets: Toward an empirical characterization. Research in Higher Education, 18(3), 271–284. https://doi.org/https://doi.org/10.1007/BF00979600
- Van Der Maaten, L. J. P., & Hinton, G. E. (2008). Visualizing high-dimensional data using t-sne. Journal of Machine Learning Research, 9(11), 2579–2605. https://www.jmlr.org/papers/volume9/vandermaaten08a/vandermaaten08a.pdf?fbclid=IwAR0Bgg1eA5TFmqOZeCQXsIoL6PKrVXUFaskUKtg6yBhVXAFFvZA6yQiYx-M
- Viktor, H. L., Peña, I., & Paquet, E. (2012). Who are our clients: Consumer segmentation through explorative data mining. International Journal of Data Mining, Modelling and Management, 4(3), 286. http://www.inderscience.com/link.php?id=48109
Appendix
Examples of the visualisation of programmes grouped by HEI in the cloud t-SNE