
Abstract
This study sought to devise a reliable and validated measurement scale to evaluate teachers’ perceptions of school climate. The study sample consisted of 379 teachers working in Awi district public primary schools, Ethiopia. Measurement scale had five latent factors (school climate dimensions) and 26 indicators (items). The coefficient alpha values for internal consistency of items and the factor rho coefficients showed high reliability of the measurement scale. The Confirmatory Factor Analysis (CFA) was carried out to validate the measurement scale by determining the convergent and discriminant validity among five school climate dimensions. Average variance extracted (AVE) values showed adequate convergent validity of school climate dimensions. The discriminant validity across school climate dimensions was established using shared variance and heterotrait–monotrait ratio of correlations (HTMT) methods, which indicated that the five school climate dimensions are distinctively different from one another. Results revealed that the school climate is found to be a multidimensional concept with five-factor solution comprising 26 reliable and valid items that can be used to assess teachers’ perceptions of school climate in different contexts. It is suggested that the future researcher can apply multi-group and multilevel confirmatory factor analysis to enhance the applicability of the measurement scale across countries.
PUBLIC INTEREST STATEMENT
School climate is at the heart of the overall school improvement and effectiveness endeavors. The school leaders and education officials need to pay great attention for evaluating school climate using more valid and reliable tools. Accordingly, this study has provided psychometrically sound tool to evaluate school climate from teachers’ perspective. Instituting positive school climate requires the collective efforts of school leaders, teachers, students and other staff members. The current study has identified five core dimensions of school climate: school leadership, institutional safety, relationships, professional learning-teaching climate, and institutional environment. To nurture the school climate in a way that supports all-round school improvement as well as the overall teacher and student learning, education policymakers, officials, educators, and school community should strive for the betterment of the above listed five core elements of school climate. Moreover, school climate evaluation should get a considerable attention in education policies and strategies of any country.
1. Introduction
Establishing a positive school climate is at the heart of school improvement endeavors. By recognizing its invaluable contributions to school quality, improvement and effectiveness, school climate assessment using reliable and valid tools has grown to be an increasingly important and valued issue in many countries, including United States of America (Faster & Lopez, Citation2013; Moro et al., Citation2019). In connection to this, literature has documented that the previous studies came up with tremendous school climate measurement tools (Cohen et al., Citation2009; Payne, Citation2018; Thapa et al., Citation2013; Zullig et al., Citation2010). However, the previous studies have had some major limitations that should be addressed. One critical limitation of those studies was that they prominently focused on developing psychometrically sound scales to measure students’ perception of school climate in a way helpful for further intervention only in students’ learning and development (e.g., Bradshaw et al., Citation2014; Gage et al., Citation2016; Lewno-Dumdie et al., Citation2019; Ramelow et al., Citation2015; Rezapour et al., Citation2020; Ryberg et al., Citation2020; Zullig et al., Citation2010). These studies disregarded the importance of evaluating teachers’ perception of school climate for further intervention in building their professional capital through professional learning and development strategies. In the same vein, literature has documented that most of school climate evaluation scales devised by the previous researchers have excessively emphasized on the students’ perceptions, though assessing teachers’ perceptions of school climate is imperative (Liu et al., Citation2014).
Given that very few recent studies have endeavored to develop reliable and valid instruments to assess teachers’ perceptions of school climate (Becerra, Citation2016; Anwar & Anis-ul-haque, Citation2014; Hultin et al., Citation2016; Liu et al., Citation2014). These studies, however, have had major limitations that need to be addressed through further investigation. The first limitation was that the studies failed to recognize five common dimensions of school climate suggested in Cohen et al.’s (Citation2009) and Thapa et al.’s (Citation2013) comprehensive reviews on school climate dimensions, which may lead into a blurred inquiry of school climate concept. For example, Anwar and Anis-ul-haque (Citation2014) study disregarded institutional safety and leadership dimensions and underrepresented teaching and learning domain as school head’s support to the teachers. In the same vein, Becerra’s (Citation2016) study disregarded the teaching and learning and institutional safety dimensions of school climate. Another limitation in previous studies was that they analyzed each dimension of school climate individually as independent and uncorrelated concept but not as component parts of school climate (Becerra, Citation2016; Anwar & Anis-ul-haque, Citation2014; Liu et al., Citation2014). Accordingly, such research findings may not enable the readers and future researchers to figure out the overall concepts of school climate using more valid and comprehensive measurement scale. Moreover, the previous studies did not test the construct validity and reliability of school climate dimensions using CFA with maximum likelihood estimation method followed by the goodness-of-fit indices (Becerra, Citation2016; Anwar & Anis-ul-haque, Citation2014; Liu et al., Citation2014).
Furthermore, Berkowitz et al. (Citation2016) strongly recommend the researchers to clearly establish more valid dimensions of school climate and measurement tools using Comprehensive School Climate Inventory (CSCI) developed by National School Climate Center (NSCC, Citation2015) as sealed conceptual base. This inventory was developed based on empirical and theoretical evidences that define what aspects of school lead to positive climates for learning and documented safety, teaching and learning, interpersonal and professional relationships, institutional environment, and leadership as major domains of school climate (National School Climate Center (NSCC), Citation2015). The current study aimed at addressing those limitations of previous studies and devising more reliable and valid instrument that can be used to assess teachers’ perceptions of school climate using NSCC’s (Citation2015) inventory as a conceptual guide. Therefore, the main purpose of this study was to test whether school climate is a multidimensional construct consisting of five dimensions and to devise more valid and reliable measurement scale using CFA approach which will be useful to assess teachers’ perception of school climate in diverse contexts.
2. Conceptual framework
The conceptual framework of this study was drawn from National School Climate Center’s (NSCC, Citation2015) theoretical model which provided more detailed school climate dimensions and their indicators in a way that can be used to effectively evaluate and measure school climate from teachers’ perspective. As stated above, this study hypothesized school climate as five-factor construct that includes: (1) school leadership, (2) institutional safety, (3) relationships within school, (4) professional learning and teaching climate, and (5) institutional environment.
The concept of School Leadership as one aspect of school climate has been drawn from previous research works and school climate briefs (Cohen et al., Citation2009; Dary & Pickeral, Citation2013; Hughes & Pickeral, Citation2013; Thapa et al., Citation2013). Supportive school leadership as a core dimension of positive school climate (Cohen et al., Citation2009; Dary & Pickeral, Citation2013; Hughes & Pickeral, Citation2013; National School Climate Center (NSCC), Citation2015) fosters teachers’ professional learning and development, which in turn contributes to overall school improvement endeavors. Conceptually, effective leadership as one aspect of positive school climate consists of leadership characteristics and decision-making style of the school’s administration such as establishing and communicating a clear vision, supporting and appreciating teachers development, involving teachers in key decisions, and becoming friendly and approachable (Hughes & Pickeral, Citation2013; National School Climate Center (NSCC), Citation2015). Hughes and Pickeral (Citation2013) further explained that a school with positive climate encourages, supports and rewards shared leadership so as to establish safe, equitable, engaging and high-quality school climates as distinguishing norms in primary schools.
Psychologically, safety is a basic need for any human being. In school context, Institutional Safety as one aspect of school climate is the individual’s basic need for learning and development. In this study, the concept of institutional safety as a component of positive school climate has been drawn from previous works (Cohen et al., Citation2009; National School Climate Center (NSCC), Citation2015; Thapa et al., Citation2013). National School Climate Center (NSCC) (Citation2015) points out that the Institutional Safety as a basic need of school community comprises school safety rules and norms, physical safety, and social-emotional safety. A positive school climate has clearly communicated and fairly enforced rules and regulations to prevent physical violence, bullying, verbal abuse, harassment and teasing as well as consistent enforcement of those rules (National School Climate Center (NSCC), Citation2015; Thapa et al., Citation2013). Consequently, safe and orderly school climate smooths the progress of students’ and teachers’ engagement in learning and realizes their healthy development (Cornell et al., Citation2016). Moreover, positive school climate with Institutional Safety supports teachers’ capability to be adult learners and enhances students’ academic success (Dary & Pickeral, Citation2013).
A positive school climate induces prompting Professional Learning and Teaching Climate for teachers. In relation to this, a substantial body of literature has documented teaching and learning as a core domain of school climate (e.g., Cohen et al., Citation2009; National School Climate Center (NSCC), Citation2015; Thapa et al., Citation2013). In this study, the concept of professional learning and teaching was rooted in teaching and learning domain of school climate defined by National School Climate Center (NSCC) (Citation2015). According to National School Climate Center (NSCC) (Citation2015), teaching and learning as one aspect of school climate comprises support for learning and social and civic learning. Based on National School Climate Center (NSCC) (Citation2015), this study defined professional learning and teaching climate as state of interactions between teachers and school principals that consisted of providing constructive feedback, supporting learning from mistakes, handling difficult situations, expressing emotions and feeling, and providing students with opportunity to demonstrate knowledge and skills in a variety of ways.
Conceptually, Relationships within School are considered as key indicators of positive school climate (DeWitt & Slade, Citation2014; National School Climate Center (NSCC), Citation2015; Thapa et al., Citation2013). It is a fourth dimension or indicator of school climate. As stated under introduction part, the relationships have been identified as one of core school climate domains in tremendous sources (e.g. Allodi, Citation2010; Cohen et al., Citation2009; Devine & Cohen, Citation2007; National School Climate Center (NSCC), Citation2015; Rudasill et al., Citation2017). In this study, the conceptualization of Relationships within School was guided by Becerra’s (Citation2016) profound work, which identified the relationships between teachers and students, teachers and student parents, teachers and principals, and the relationship among teachers as major indicators. Literature has shown that healthy, positive and connected interpersonal relationships are at the heart of positive school climate (Devine & Cohen, Citation2007; Weissbourd et al., Citation2013), because the overall teaching and learning process in the school is fundamentally relational (Thapa et al., Citation2013). Healthy and positive relationships between principals, teachers, students, and other staff is a foundation in creating a positive school climate (Feinstein & Kiner, Citation2011).
Furthermore, Institutional Environment as one indicator of positive school climate has been defined in both physical and social terms (Cohen et al., Citation2009; National School Climate Center (NSCC), Citation2015; Thapa et al., Citation2013). In this study, the concept of Institutional Environment as school climate indicator was emanated from NSCC’s (Citation2015) theoretical model. This domain is composed of two subcomponents, namely school connectedness and physical surroundings (National School Climate Center (NSCC), Citation2015). The school’s positive physical environment provides teachers with opportunity to improve the overall school climate (DeWitt & Slade, Citation2014). Based on this conceptual framework, this study attempted to test school climate as multidimensional concept comprising five correlated indicators from teachers’ point of view.
3. Method
3.1. Participants and sampling procedures
A total of 379 teachers in 12 public elementary schools in Awi district of Amhara National Regional State of Ethiopia were included in the study. Sampling procedure had gone through three-stages. First, four local administrative areas were selected randomly from twelve. Second, 12 primary schools that comprised grade levels ranged from grade one to eight were chosen from selected local administrations, as three schools were randomly selected from each local administration. Finally, 380 teachers from 400 initially recruited teachers completed the survey, thereby indicating 95% response rate. However, one participant had 28% missed data eliminated from analyses and thus the data from 379 (male = 247, female = 132) teachers were analyzed and reported in this study. The age of sample teachers ranged from under 25 years to above 50 years, while most of them (77.04%) had between 25 and 39 years of age. Regarding their educational level, large number of the sample teachers (77.6%) had diploma and very small number of them had certificate (0.3%) and master’s degree (0.5%). Furthermore, majority (44.6%) of sample teachers had teaching experiences that ranged between 8 years and 15 years, followed by the teachers (27.2%) with teaching experience that ranged from 4 years to 7 years.
To address ethical issues of the study and protect the privacy of the study participants, they were instructed not to mention their name and school. Likewise, the participants were informed that their participation in current study is based on their free will and voluntarily. They were also informed that they can resign from the study in the meantime of data collection process. Moreover, they were told that their data will be kept anonymous and it will be used only for academic purpose.
3.2. Instrument
In this study, the measures prominently rooted in the Comprehensive School Climate Inventory (CSCI) developed by the National School Climate Center (NSCC) (Citation2015). In addition, Cohen et al.’s (Citation2009) and Thapa et al.’s (Citation2013) comprehensive reviews on school climate dimensions were used to hypothesize school climate as the five-factor model consisted of (1) institutional safety, (2) school leadership, (3) professional learning and teaching, (4) relationships within school, and (5) institutional environment, which are its commonly documented dimensions. The indicators were 6-point Likert-type positively described scales with scores ranged from 1 to 6, where 1 = strongly disagree, 2 = disagree, 3 = somewhat disagree, 4 = somewhat agree, 5 = agree, and 6 = strongly agree. The final measurement scale consisted of 26 items established to measure teachers’ perception of school climate. The overall scale had the coefficient alpha value of .96, which indicated an excellent internal consistency among items based on guiding rules suggested by Collier (Citation2020) and Kline (Citation2016).
Guided by NSCC’s (Citation2015) inventory, this study measured Institutional safety using three items. Sample item included: “In our school, there are clear rules against physically hurting, insulting, teasing, harassment and other verbal abuses.” Coefficient alpha value was .83 (> .70), denoting good reliability of scale. Likewise, we measured School Leadership using seven items. Sample items included: “Our school principal fairly allocates resources for curriculum, instructional and professional development.” and “Our school principal uses teachers’ voice in decision making.” Coefficient alpha value was .96, indicating high consistency among items. The Professional Learning and Teaching Climate dimension was measured using eight items. Originally, the National School Climate Center (NSCC) (Citation2015) devised items in line with teachers support to students’ learning and development. This study revised these items in line with school heads support to teachers’ professional learning and development. Sample item included: “Heads provide the teachers with constructive feedback on their work.” Cronbach’s alpha value was .94, suggesting excellent consistency among items. To measure Relationships within School, this study initially adapted items to measure professional relationships from National School Climate Center (NSCC) (Citation2015) and interpersonal relationships from Becerra’s (Citation2016) work. However, through rigorous statistical analyses, items from Becerra’s interpersonal relationships subscale were retained to measure relationships within school as school climate dimension. Sample item included: “In our school, students respect us so that the relationships we have with our students are agreeable.” Cronbach’s alpha value was .89, denoting better reliability compared to alpha value of .861 indicated in Becerra’s (Citation2016) study. Furthermore, Institutional Environment was measured using four items adapted from physical surroundings subscale (National School Climate Center (NSCC), Citation2015). Sample item included: “Our school buildings (classrooms, laboratory rooms and libraries) are clean.” Cronbach’s alpha value was .88, denoting great consistency among items.
3.3. Preliminary analyses for data preparation
Before testing the measurement model for school climate construct, all cases and items (indicators) were assessed for unengaged responses, missed values, multivariate outliers, and influential scores as well as multivariate statistical model assumptions. To identify unengaged responses, this study assessed each respondent’s likelihood of answering each research question in exactly the same way using standard deviation. Collier (Citation2020) suggests that the cases with a standard deviation value less than .25 represent unengaged responses and they are subject to deletion, because it shows that the participants responded to each research questions almost in exactly the same way. Based on this criterion, in current study, the overall standard deviation values across cases were greater than .65 (> .25), which indicated adequately engaged responses by the participants of the study. Next, this study examined the missing values. In connection to this, Hair et al. (Citation2019) and Kline (Citation2016), respectively, suggest that the cases with less than 10% or 5% missing data are subject to any data imputation technique. Guided by these criteria, only one respondent with 30% missed data was excluded and five respondents’ data with less than 1% randomly missed values were imputed for analysis purpose.
Univariate outliers were checked by inspecting frequency distributions of z scores and multivariate outliers were assessed using Mahalanobis’s distance and Cook’s distance. Kline (Citation2016) suggests an absolute value of z scores greater than 3.0 as indicators of univariate outliers. Likewise, Hair et al. (Citation2019) suggest using a significance level threshold of .001 to determine multivariate outliers using Mahalanobis distance. In addition, the Cook’s distance value greater than one indicates an outlier. Based on these criteria, no influential outlier was found. Multivariate assumptions were tested to determine the adequacy of the quality of data for factor analysis. To establish multicollinearity assumption, this study examined inter-factor correlation coefficients (> .85), variance inflation factor (VIF) values (> 10) and tolerance values (< .10) based on the criteria commonly suggested in literature (e.g., Brown, Citation2015; Collier, Citation2020; Kline, Citation2016), indicating the presence of multicollinearity issues. Based on these criteria, results in current study showed that: the inter-factor correlation estimated ranged between .48 and .73 (< .85), variance inflation factor (VIF) values ranged between 2.05 and 7.35 (<10), and the tolerance estimates ranged between 0.14 and 0.49 (> .10), which indicated nonexistence of the multicollinearity issues. As Kline (Citation2016) pinpointed, tolerance is a statistical technique that indicates the proportion of total standardized variance that is unique and the values less than .10 may indicate extreme multivariate collinearity. Kline also noted that the variance inflation factor (VIF) is the ratio of the total standardized variance over the proportion of unique variance (tolerance), which is important statistical approach to test multicollinearity issues.
According to Kline (Citation2016), the extreme multivariate collinearity occurs when the presumably different variables actually measure the same thing. In relation to this, Kline (Citation2016) delineates that the squared multiple correlation coefficients (R2) greater than .90, as a criterion, indicates the extreme multivariate collinearity (Kline, Citation2016). Based on this criterion, as indicated in kp , R2 estimates across the indicators of the constructs ranged between .49 and .87 (< .90), attesting absence of extreme multivariate collinearity. In general, this evidence confirmed no multivariate collinearity issues were observed in current study, highlighting discriminant validity across the indicators of the latent variables.
Table 1. Correlations, reliability, convergent and discriminant validity of constructs
Likewise, the assumption of normality of the distribution was examined using skew and kurtosis values based on rule of thumb suggested by Collier (Citation2020). Data are presumed normally distributed if the ranges of skewness values are between −2 and +2, and the ranges of kurtosis values are between −10 and +10 (Collier, Citation2020). Guided by this rule, this study results showed the skewness values that ranged from −0.13 to −1.102 and kurtosis values ranged from −1.09 to 0.84, thereby proved normal distribution of the data, which supported normality of the distribution. Moreover, we assessed the internal consistency reliability (α ≥ .70) and item-total correlation estimates (≥ .33) of initially hypothesized measurement items and decided which item to retain or delete before testing measurement model using factor analyses (Collier, Citation2020; Ho, Citation2006). Guided by this criterion, 16 items were dropped from the original instrument because they had item-total correlation estimate values less than .33 (ranged from −.01 to .29).
3.4. Construct reliability and validity testing
The reliability and validity of the construct of school climate were assessed using Confirmatory Factor Analyses (CFA). CFA is very essential statistical approach in testing construct reliability and validation (Brown, Citation2015) in educational research. Clearly put, the “results of CFA can provide compelling evidence of the convergent and discriminant validity of theoretical constructs” (Brown, Citation2015, p. 2). In construct validation process, as Brown (Citation2015) points out, a profound strength of CFA is that the “resulting estimates of convergent and discriminant validity are adjusted for measurement error and an error theory” (p. 2). As a result, CFA allows for a stronger analytic framework compared to the traditional methods of ordinary least-squares approaches such as correlations and multiple regression analysis that do not account for measurement errors because they presume variables in the analysis as free of measurement error (Brown, Citation2015), which is unrealistic in practical world. Recognizing its fundamental strengths in construct validation and composite reliability test, this study conducted CFA using AMOS 23 and assessed the fit of measurement model vis-à-vis suggested criteria for model fit indices.
4. Results and discussion
4.1. Factor analyses
4.1.1. Exploratory factor analyses
Initially, this study assessed the corrected item-total correlations and identified items to be put into exploratory factor analyses (EFA), which reduced the overall number items from 106 to 90 by dropping items with a correlation coefficient less than .33. As Ho (Citation2006) pointed out, the items with less than .33 item-total correlations are subject to deletion because less than 10% of the variance in the scale is accounted for by each of those items. Based on this criterion, 16 items were dropped before EFA. Next, this study assessed the adequacy of the recruited sample and the existence of significant relationships using Kaiser–Meyer–Olkin’s (KMO) test and Bartlett’s test of Sphericity SPSS outputs, respectively. Literature has pointed out that the KMO test value greater than .5 shows adequacy of the study sample size, while a significant Bartlett’s test (p x00A0;.05) indicates that correlation matrix has significant correlations among at least some of the variables, supporting the suitability of data for factor analysis (Hair et al., Citation2019). The results showed that the KMO’s measure of sampling adequacy value was .96, which is by far greater than threshold value of .5 that indicated adequate sample size. Likewise, the Bartlett’s Test of Sphericity tested the adequacy of the correlation matrix, and yielded a value of 19,740.31 and an associated level of significance less than 0.001. Thus, the hypothesis that the correlation matrix is an identity matrix was rejected, which indicated that the correlation matrix had significant correlations among at least some of the variables that showed data suitability for factor analyses.
EFA is very important statistical technique to reduce the data of multitude of indicators and useful to examine cross-loadings (Collier, Citation2020). As Collier points out, EFA involves “data rotation that is often done to achieve a better loading of indicators on a construct or sometimes a reduction of cross loading with other constructs” (p. 63). The EFA was performed using oblique rotation method, because this method yields more realistic and accurate representation of inter-factor correlations compared to orthogonal rotation (Brown, Citation2015; Ho, Citation2006; Kline, Citation2016). Given multiple oblique rotation methods, “promax rotation is probably the most widely used method” to conduct EFA with interrelated factors (Kline, Citation2016, p. 193). Hence, this study performed EFA using promax rotation method in SPSS 23, because it yields a more accurate representation of the magnitude of inter-factor relationships and accurate clustering of these factors (Brown, Citation2015; Ho, Citation2006; Kline, Citation2016). In connection to this, results from EFA revealed that the inter-factor correlation coefficients ranged from r = .40 between Institutional Environment and Institutional Safety to r = .69 between School Leadership and Relationships within the School.
In this study, the maximum likelihood estimation method was employed in EFA, which determined the structure and intercorrelations of school climate dimensions (factors) vis-à-vis hypothesized structure of factors prior to CFA. Given many estimation methods, maximum likelihood is the most commonly used estimation method in CFA and it enables to statistically evaluate the potential of the established factor solution in reproducing the relationships among the indicators in the input data (Brown, Citation2015), which is very crucial procedure to determine the appropriate number of factors. In this regard, maximum likelihood estimation method was employed because of that the EFA results were employed to conduct confirmatory factor analyses (CFA) using structural equation modeling approach.
Furthermore, EFA was conducted through several iterations until a model that provided an adequate fit to the exploratory data was obtained. To determine the final number of items, each item was further scrutinized for cross-loadings. This process further reduced the 90 items to 50, which retained after items with less than 0.40 factor loadings and cross-loadings were felled. The results of EFA supported the five theorized school climate domains, namely, School Leadership (15 items, eigenvalue = 25.032), Professional Learning and Teaching Climate (16 items, eigenvalue = 3.632), Institutional Environment (7 items, eigenvalue = 3.026), Relationships within School (7 items, eigenvalue = 2.038), and Institutional Safety (5 items, eigenvalue = 1.672), which explained 67.55% of variance on the school climate. These five factors were retained for rotation because they had eigenvalues of above 1 and they accounted for 49.30%, 6.50%, 5.67%, 3.44%, and 2.65% of the total variance, respectively. Since this process produced a simple factor structure, a promax rotation examined factor loadings to establish construct validity of the instrument. Factor loadings ranged from .50 to .93, indicating that the items were highly saturated in each latent construct. In general, this study had performed EFA with maximum likelihood estimation and promax rotation method and specified indicators for each construct prior to the CFA. As Collier (Citation2020) noticed, the “researcher prior to the CFA will specify what the indicators are for each construct, and those indicators can load only on that specific construct” (p. 63). Consequently, EFA specified five theorized school climate domains: School Leadership, Professional Learning and Teaching Climate, Institutional Environment, Relationships within School, and Institutional Safety. Furthermore, the reliability and validity of these measures of school climate construct was tested using CFA computed via structural equation modeling approach by using AMOS software.
4.1.2. Model fit evaluation criteria
Brown (Citation2015) grouped model fit indices into three, namely, “absolute fit, fit adjusting for model parsimony, and comparative or incremental fit” (p. 71). As Brown (Citation2015) noticed, absolute fit indices assess model fit at an absolute level and the chi-square statistic (X2) and the standardized root mean square residual (SRMR) indices fall under this category. Since chi-square statistic is more sensitive to sample size, Collier (Citation2020) suggests a relative chi-square test as a better option to use, which is the chi-square value divided by the degrees of freedom (X2/df). As Collier (Citation2020) points out, an acceptable relative chi-square value (χ2/df) may ranges from 3 to 5 and any value less than 3 indicates a good model fit while the values that range to 5 show acceptable level. In conceptual term, the “SRMR can be viewed as the average discrepancy between the correlations observed in the input matrix and the correlations predicted by the model” (Brown, Citation2015, p. 70).
The second category of model fit indices is known as parsimony correction indices which sometimes also grouped under absolute fit indices category (Brown, Citation2015). According to Brown (Citation2015), the root-mean-square error of approximation (RMSEA) is mostly used and recommended index from this category. As it evaluates the extent to which a model fits reasonably well in the population, the RMSEA is known as an error of approximation index (Brown, Citation2015). Its purpose is not testing if the model holds exactly in the population. As a result, the RMSEA is “sensitive to the number of model parameters”; but “relatively insensitive to sample size” (Brown, Citation2015, p. 71). Moreover, as Brown noted, it is less common to see the RMSEA value that exceeds 1.00 though its upper range is unbounded and its value very close to 0 suggests a good model fit. Based on Brown’s (Citation2015) classification, the third category of model fit indices is called comparative fit indices, which also represented as incremental fit indices and evaluate the fit of a user-specified solution against a nested baseline model. The Normed Fit Index (NFI), Relative Fit Index (RFI), Tucker–Lewis Index (TLI), Comparative Fit Index (CFI), and Incremental Fit Index (IFI) can be grouped under this category. According to Brown (Citation2015), the CFI and TLI are most commonly used and recommended indices from this category.
Furthermore, the relative chi-square test (χ2/df), Normed Fit Index (NFI), Relative Fit Index (RFI), Tucker–Lewis Index (TLI), Comparative Fit Index (CFI), Incremental Fit Index (IFI), Root Mean Square Error of Approximation (RMSEA) and Standardized Root Mean Square Residual (SRMR) were used to determine whether or not the developed measurement model had a good fit to the sample data. In addition, a substantial body of literature has documented that the value of .90 or above shows acceptable level for GFI, NFI, RFI, TLI, CFI and IFI (Collier, Citation2020; Hair et al., Citation2019; Ho, Citation2006; Schumacker & Lomax, Citation2016). Likewise, RMSEA value below .08 and SRMR value below .05 indicates a good model fit while values up to .08 show acceptable level (Collier, Citation2020; Schumacker & Lomax, Citation2016). On the other hand, Brown (Citation2015) points out that the SRMR values can range between 0.0 and 1.0, where the smaller SRMR value indicates a better fit of the model to the data. Based on Bentler and Bonett’s work, Collier (Citation2020) recently provides criteria for an acceptable model fit. Guided by the Collier’s (Citation2020) suggestion, an acceptable model fit was defined by the following criteria: relative chi-square (≤ 5), NFI (≥ .90), RFI (≥ .90), TLI (≥ .90), CFI (≥ .90), IFI (≥ .90), RMSEA (≤ .08, 90% CI), and SRMR (≤ .08). We employed different types of index based on Brown (Citation2015) suggestion for researchers to use and report at least one index from each category when evaluating the fit of their models given “each type of index provides different information about model fit” (p. 71).
4.1.3. Hypothesized measurement model
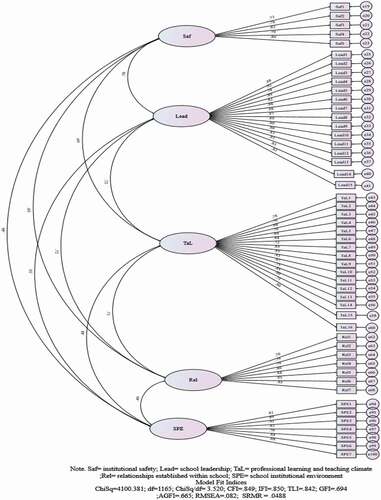
The hypothesized measurement model for School Climate had 1275 distinct sample moments or number of pieces of information provided by the data with 110 parameters to be estimated that resulted in 1165 degrees of freedom based on an overidentified model, and a chi-square value of 4100.381 with probability level equal to .000. Total numbers of variables in initially hypothesized model were 105, of which 50 were observed as endogenous variables while 55 were unobserved as exogenous variables. The model had a total of 100 regression weights, 55 of which were fixed and 45 of which were estimated. There were also 10 covariances and 55 variances, all of which were estimated. In total, there were 165 parameters, 110 of which were estimated and 55 were fixed. The results from initial CFA showed that the overall standardized parameter estimates ranged between .68 and .92, and they were significant at p < .001. The fit of the hypothesized model was assessed based on the criteria mentioned above. As a result, results from fully correlated 5-factor CFA showed that the hypothesized measurement model had poor fit to the data well: χ2 = 4100.381(df = 1165, p < .001), χ2/df = 3.52, NFI = .80, RFI = .79, IFI = .85, TLI = .84, CFI = .85, and SRMR = .05, which suggested model respecification. Likewise, the RMSEA value for our hypothesized model is .082, with the 90% confidence interval ranging from .079 to .084. This evidence also suggested that the hypothesized 5-factor model for School Climate was misspecified. Moreover, hypothesized model misspecification was tested using modification indices (MI) and standardized residual covariances. Results from CFA showed that the MI values ranged between 10.035 (e55<–>e96) and 104.493 (e43<–>e44), which suggested correlating errors to adequately specify a model. Likewise, the standardized residual covariances ranged from −2.5 to 3.84 with ten values above 2.58, which indicated misspecification of hypothesized model. As Collier (Citation2020) pinpoints, the standardized residuals are the difference between the observed covariance matrix and the estimated covariance matrix for each pair of observed variables. Guided by Joreskog and Sorbom’s work, Collier (Citation2020) suggests that a standardized residual value greater than 2.58 is a sign of possible model misspecification. As a result, this study performed model respecification by dropping parameters with less than .70 standardized factor loadings and by correlating error terms based on MI suggested in AMOS ().
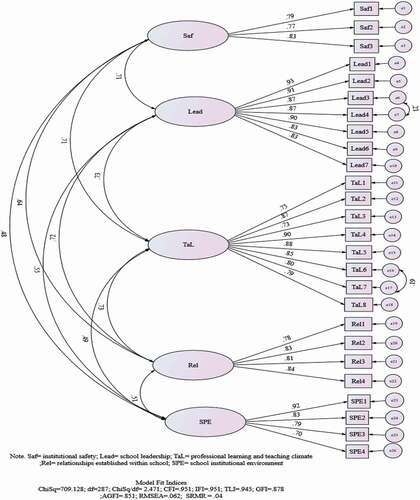
Figure 1. Final measurement model for School climate with standardized estimates
4.1.4. Modified measurement model
As showed in , CFA results of the modified measurement model showed that unstandardized factor loading path coefficients (B) for all indicators of studied constructs ranged from B = 0.82 for two items, “Our principal takes actions to ensure that teachers take responsibility for improving their teaching skills and All teachers are given appropriately challenging work” to B = 0.99 for two items, “Our school principal fairly allocates school resources for curriculum, instructional and professional development and Our school principal uses teachers’ voice in decision making” and the results found to be significant by the critical ratio (t-value) test (> ±1.96, p < .001), except those items fixed to a value of 1 for specification purpose. Results also delineated that the standardized factor loading path coefficients of all indicators (items) of study variables ranged from β = .70 for Institutional Environment measurement item, i.e., “Our school has enough space and facilities for extra-curricular activities” (C.R. = 16.10, S.E. = .05) to β = .93 for School Leadership item, that is, “Our school principal fairly allocates school resources for curriculum, instructional and professional development” (C.R. = 31.65, S.E. = .03), which indicated that the overall indicators contributed more to understand their respective unobserved construct. As Collier (Citation2020) contended, the researchers most frequently reported the standardized estimates because they allow for an easier comparison of the weights of indicators across a CFA by converting factor loadings to a range of 0 to 1 scale. Also, squaring the standardized factor loading provides the proportion of explained variance (R2) with each indicator that help the researcher know how much of the variance in the indicator is explained by the unobserved construct (Collier, Citation2020).
Table 2. First-Order confirmatory factor analysis results
The squared multiple correlation coefficients (R2) with each indicator showed that the Institutional Safety explained between 59% and 68% of variances in its indicators, which showed that the three indicators contributed more to the understanding of the Institutional Safety construct. As depicted in , Professional Learning and Teaching Climate as unobserved construct explained from 54% to 81% of variances in its indicators, indicating that the eight indicators contributed more to the understanding of the Professional Learning and Teaching Climate construct. The unobserved construct of Relationships within School explained from 60% to 71% of variances in its indicators, which showed that the four indicators contributed more to understand the Relationships within School. Likewise, the explained variances of Institutional Environment in its indicators ranged from 49% to 85%, showing that the four indicators contributed more to understand the school’s Institutional Environment. Based on this result, the cleanliness of the school buildings (classrooms, laboratory rooms and libraries) as indicator seemed to have more contribution in understanding the unobserved construct of Institutional Environment. Furthermore, the variances explained by the unobserved construct of School Leadership ranged from 68% to 87%, indicating that the seven indicators contributed more to understand School Leadership practice of the principal.
4.1.5. Assessment of model fit
Based on the criteria mentioned above, the results from CFA showed that the modified measurement model had adequate fit the data: χ2 = 709.128 (df = 287, p < .001), χ2/df = 2.47, NFI = .92, RFI = .91, IFI = .95, TLI = .95, CFI = .95, RMSEA = .06, and SRMR = .04. At 90% confidence interval, the lower and upper bounds of RMSEA values ranged from .057 to .068, supporting adequate fit of measurement model to the sample data.
4.2. Correlations, reliability and validity analyses
4.2.1. Correlations between constructs
After the number of items (indicators) and factors were determined through confirmatory factor analyses (CFA), both inter-item and inter-construct correlation coefficients were analyzed. Hence, results showed that the inter-item correlation estimates ranged between .22 and .86 with high significance level, i.e., p < .001. Likewise, as indicated in , the inter-construct correlation estimates showed significantly strong and positive correlations of School Leadership to Institutional Safety (r = .71, C.R. = 9.68, S.E. = .10), Professional Learning and Teaching Climate (r = .73, C.R. = 10.5, S.E. = .09), Relationships within the School (r = .72, C.R. = 9.93, S.E. = .08), and Institutional Environment (r = .55, C.R. = 8.61, S.E. = .10). Also, results showed significant correlations of Institutional Safety to Professional Learning and Teaching Climate (r = .71, C.R. = 9.68, S.E. = .10), Relationships within the School (r = .64, C.R. = 8.66, S.E. = .09), and Institutional Environment (r = .48, C.R. = 7.3, S.E. = .11). Similarly, results showed significant correlations from relationships within the School to Institutional Environment (r = .51, C.R. = 7.72, S.E. = .09) and Professional Learning and Teaching Climate (r = .73, C.R. = 9.97, S.E. = .08). In the same vein, there were significantly positive correlations between Professional Learning and Teaching Climate and Institutional Environment (r = .49, C.R. = 7.88, S.E. = .10). Based on this evidence, we inferred that the factors (school climate dimensions) had moderate to high correlations. The overall correlation coefficients were statistically significant at p < .001 (see ). Moreover, the error terms were correlated based on the modification indices suggested by AMOS for the sake of measurement model respecification, i.e., e16 and e17 (r = .19, C.R. = 3.12, S.E. = .03, p = .002) and e6 and e7 (r = .21, C.R. = 3.48, S.E. = .02, p < .001). In general, the results showed strongly positive correlations among school climate dimensions (factors) that ranged between .48 and .73, showing implausible discriminant validity issues across the studied constructs.
4.2.1.1. Internal consistency reliability
Next to data screening both at respondent and variable levels, this study assessed the reliability of indicators or items in predicting the construct of interest. Reliability test was performed in two phases: before exploratory factor analysis (EFA) and after CFA. Since CFA is a structural equation modeling approach, this approach suggests that each construct needs to have two and more indicators. In relation to this, Collier (Citation2020) suggests having at least three indicators for each construct as a good rule of thumb that will allow the researchers to determine the reliability of items. Guided by this rule, number of indicators (items) for each studied constructs ranged between three for Institutional Safety and eight for Professional Learning and Teaching Climate.
The most commonly used technique for assessing the items internal consistency reliability is Cronbach’s alpha, also called coefficient alpha (α) that ranges from 0 to 1 (Collier, Citation2020; Kline, Citation2016), where higher numbers denote a more reliable scale. As a statistical technique, Cronbach’s alpha measures internal consistency reliability that defines the degree to which responses are consistent across the items of a measure (Collier, Citation2020; Kline, Citation2016). Based on Nunnally and Bernstein’s work, Collier (Citation2020) suggests .70 and above coefficient alpha values as an acceptable level of reliability. This criterion also works for composite reliability of a construct. But, if internal consistency estimate is low, “then the content of the items may be so heterogeneous that the total score is not the best possible unit of analysis” (Kline, Citation2016, p. 91). Results showed that the alpha coefficient values that measured the internal consistency reliability of items ranged between α = .83 for Institutional Safety (three items) and α = .96 for School Leadership (seven items), indicating high reliability. As depicted in , the overall School Climate construct (26 items) had the Cronbach’s alpha coefficient value of .96, which indicated an excellent internal consistency among items based on guiding rules suggested by Collier (Citation2020) and Kline (Citation2016). All indicators (items) were measured with 6-point Likert type scale that ranged from 1(strongly disagree) to 6 (strongly agree).
4.2.1.2. Composite Reliability (CR)
In addition to internal consistency reliability measured by Cronbach’s alpha analysis, composite reliability is another popular technique of factor reliability analysis, which is also known as Raykov’s Rho (r) or factor rho coefficient (Collier, Citation2020; Kline, Citation2016). CR can be calculated using factor loadings from a confirmatory factor analysis (Collier, Citation2020) and is the ratio of explained variance over total variance (Kline, Citation2016), which is crucial statistical technique used to evaluate the reliability of factor measurement. Collier (Citation2020) suggests that, like Cronbach’s alpha level for internal consistency reliability, the CR has the same range and cutoff criteria for acceptable level of reliability (i.e., >.70). As indicated in , the composite reliability estimates of the overall latent constructs ranged from .84 for Institutional Safety to .96 for School Leadership (> .70), showing excellent reliability. This means that all constructs had sufficiently reliable items that adequately measured what they were intended to measure. Also, the maximum reliability estimates of the latent constructs ranged from .84 for Institutional Safety to .96 for School Leadership, thereby affirming high reliability of construct measures by far above the cut point .70.
4.2.1.3. Convergent validity
This form of construct validity defines the degree to which all indicators of a given construct are measuring the same thing (construct) they are intended to measure (Collier, Citation2020). It is determined by “evidence that different indicators of theoretically similar or overlapping constructs are strongly interrelated … ”(Brown, Citation2015, p. 2). As Kline (Citation2016) contended, convergent validity involves the assessment of measures against each other instead of external standards. The criteria for convergent validity is that the average variance extracted (AVE) must be greater than .50 (Collier, Citation2020; Hair et al., Citation2019). AVE represents the “average of the squared standardized pattern coefficients for indicators that depend on the same factor but are specified to measure no other factors” (Kline, Citation2016, p. 313).
The AVE values for Professional Learning and Teaching Climate (.68), Institutional Safety (.63), School Leadership (.77), Institutional Environment (.66) and Relationships within School (.66) were by far greater than .50, showing that all indicators had adequate convergent validity. In general, the average variance extracted (AVE) values for convergent validity test across constructs ranged between .63 and .77 (> .50), showing that the indicators presumed to measure the same construct adequately measured the intended construct. In connection to this result, Collier (Citation2020) noted that a lack of convergent validity implies that the indicators are weakly measuring a construct they are intended to measure or they are actually a better measure for another construct. Moreover, the indicators presumed to measure the same construct can have a convergent validity when the magnitudes of their intercorrelations are considerable (Kline, Citation2016).
4.2.1.4. Discriminant validity
Unlike convergent validity, discriminant validity examines whether or not a construct is distinct and different from other studied constructs (Collier, Citation2020). Collier points out that this type of validity entails a set of indicators assumed to measure a construct completely distinct from other constructs. Moreover, the discriminant validity can be established if intercorrelations among a set of indicators presumed to measure different constructs are not too high (commonly, < .85) (Brown, Citation2015; Collier, Citation2020; Kline, Citation2016). They noted that, in most case, intercorrelations estimates above .85 may indicate the presence of multicollinearity issues and problematic discriminant validity across constructs. Literature suggests Fornell and Larcker’s shared variance method and heterotrait–monotrait ratio of correlations (HTMT) method to determine discriminant validity. In shared variance method, as Collier (Citation2020) points out, the discriminant validity of each construct can be determined by computing the shared variances between constructs and comparing them to the AVE values for each construct. In Collier’s view, the shared variance between each construct can be determined by squaring the correlation coefficients. As criteria, a construct with discriminant validity must have AVE values greater than the shared variances value (Collier, Citation2020). Based on these criteria, this study assessed discriminant validity of school climate dimensions. As showed in , results from multifactorial CFA indicated that the shared variance between Professional Learning and Teaching Climate and Institutional Safety (.712) = .50 was by far lower than the AVE value of Professional Learning and Teaching Climate (.68) or Institutional Safety (.63), attesting the discriminant validity of these constructs.
In addition to Fornell and Larcker’s shared variance criterion, heterotrait–monotrait ratio of correlations (HTMT) method is strongly recommended to determine discriminant validity (Collier, Citation2020; Hamid et al., Citation2017; Henseler, Citation2017; Henseler et al., Citation2015). The HTMT method examines discriminant validity of constructs by computing the ratio of between-trait correlations to within-trait correlations of two constructs (Collier, Citation2020). In other words, this method determines discriminant validity by examining the correlations of indicators across constructs to the correlations of indicators within a construct. Moreover, Collier (Citation2020) suggests HTMT value of .85 as a threshold and the values less than this threshold indicates acceptable discriminant validity across constructs. Steered by this criterion, this study analyzed the discriminant validity across the constructs involved in this study.
As results showed, average monotrait correlations between the indicators of a construct of Professional Learning and Teaching Climate and between the indicators of a construct of Institutional Safety were .68 and .63, respectively. Likewise, average heterotrait correlation between the indicators of Professional Learning and Teaching Climate and Institutional Safety construct was .47. Based on this evidence, HTMT ratio of correlations across these constructs was calculated. Hence, the HTMT value across the constructs of Professional Learning and Teaching Climate and Institutional Safety was .72, which is lower than .85. This evidence indicated that the discriminant validity was established across the constructs of Professional Learning and Teaching Climate and Institutional Safety. The shared variance between Professional Learning and Teaching Climate and School Leadership (.732) = .53 was lower than the AVE value of Professional Learning and Teaching Climate (.68) or School Leadership (.77), affirming the established discriminant validity of these constructs. In addition, average monotrait correlation between the indicators of a construct of School Leadership was .77 and average heterotrait correlation between the indicators of Professional Learning and Teaching Climate and School Leadership construct was .53. As a result, HTMT value across the constructs of Professional Learning and Teaching Climate and School Leadership was .74 (<.85), indicating that the discriminant validity was established across these constructs.
Results from CFA revealed that the shared variance between Professional Learning and Teaching Climate and Institutional Environment (.492) = .24 was lower than the AVE value of Professional Learning and Teaching Climate (.68) or Institutional Environment (.66), supporting discriminant validity of these constructs. Likewise, HTMT value across the constructs of Professional Learning and Teaching Climate and Institutional Environment was .52 (< .85), supporting the established discriminant validity across these constructs. Moreover, results showed that the average heterotrait correlation between the indicators of Professional Learning and Teaching Climate and Institutional Environment construct was .34 and the average monotrait correlation between indicators of a construct of Institutional Environment was .65. The shared variance between Professional Learning and Teaching Climate and Relationships within School (.732) = .53 was lower than the AVE value of Professional Learning and Teaching Climate (.68) or Relationships within School (.66), asserting discriminant validity of these constructs. Average monotrait correlation between the indicators of Relationships within School construct was .66, while an average heterotrait correlation between the indicators of Professional Learning and Teaching Climate and Relationships within School construct was .49. Similarly, the HTMT value (.73) across Professional Learning and Teaching Climate and Relationships within School constructs was below .85. This evidence affirmed that the discriminant validity was established across the constructs of Professional Learning and Teaching Climate and Relationships within School.
Results from multifactorial CFA indicated that the shared variance between Institutional Safety and School Leadership (.712) = .50 was lower than the AVE value of Institutional Safety (.63) or School Leadership (.77), indicating discriminant validity of these constructs. In addition, the HTMT value of .71 (< .85) across these constructs indicated that the discriminant validity was established across the constructs of Institutional Safety and School Leadership. Average heterotrait correlation between the indicators of Institutional Safety and School Leadership construct was .50. As results indicated, the shared variance between Institutional Safety and Institutional Environment (.482) = .23 was lower than the AVE value of Institutional Safety (.63) or Institutional Environment (.66), indicating discriminant validity of these constructs. Similarly, the HTMT value across the constructs of Institutional Safety and Institutional Environment was .48 (< .85), indicating the established discriminant validity across these constructs. The average heterotrait correlation between the indicators of Institutional Safety and Institutional Environment construct was .31. Similarly, the shared variance between the constructs of Institutional Safety and Relationships within School (.642) = .41 was lower than the AVE value of Institutional Safety (.63) or Relationships within School (.66), showing discriminant validity of these constructs. In addition, the HTMT value across the constructs of Institutional Safety and Relationships within School was .66 (< .85), attesting that the discriminant validity across these constructs was established. Average heterotrait correlation between the indicators of Institutional Safety and Relationships within School construct was .42.
Results also showed that the shared variance between the constructs of School Leadership and Institutional Environment (.552) = .30 was by far lower than the AVE value of School Leadership (.77) or Institutional Environment (.66), attesting discriminant validity of these constructs. Similarly, the HTMT value across the constructs of School Leadership and Institutional Environment construct was .55 (< .85) and an average heterotrait correlation between the indicators of these constructs was .39. This evidence indicated that the discriminant validity had been established across the constructs of School Leadership and Institutional Environment. Likewise, the shared variance between School Leadership and Relationships within School (.722) = .52 was lower than the AVE value of School Leadership (.77) or Relationships within School (.66), supporting discriminant validity of these constructs. In addition, the HTMT value across the constructs of School Leadership and Relationships within School was .73 (< .85), affirming that the discriminant validity across these constructs was established. Average heterotrait correlation between the indicators of School Leadership and Relationships within School construct was .52.
Furthermore, the shared variance between the constructs of Institutional Environment and Relationships within School (.512) = .26 was by far lower than the AVE value of Institutional Environment (.66) or Relationships within School (.66), attesting the established discriminant validity across these constructs. In addition, the HTMT value across the constructs of Institutional Environment and Relationships within School was .52 (< .85), supporting the established discriminant validity across these constructs. Average heterotrait correlation between the indicators of Institutional Environment and Relationships within School construct was .34. Since results showed adequate discriminant reliability across the constructs, we inferred that the constructs in this study were measuring different aspects of school climate. Guided by the criterion suggested by Collier (Citation2020), discriminant validity across constructs was established using both shared variance and heterotrait–monotrait ratio of correlations (HTMT) methods and thus the constructs were distinctively different from one another.
The modified CFA has established school climate measurement model with standardized estimates using structural analysis approach in AMOS (see ). As Collier (Citation2020) noticed, CFA is a statistical technique of structural equation modeling that tests how well the indicators measure the intended unobserved constructs and whether or not the unobserved constructs are uniquely different from one another. In this study, latent factors, school climate dimensions, latent constructs and unobserved variables had similar meaning. Unobserved variables were represented by an oval, while their indicators were represented by a rectangle. Likewise, indicators measured each of unobserved variables had single headed arrows coming from their unobserved variable to each of the indicators (see ). These arrows indicated the influences that were reflected from unobserved variables to their indicators commonly called as factor loadings that were interpreted as regression coefficients. Collier (Citation2020) points out that the factor loadings are the statistical estimates of the direct effects of unobserved construct on each of its indicators that can be interpreted as unstandardized or standardized regression coefficients. All indicators were reflective, because they reflected unobservable constructs or factors (Collier, Citation2020). In , the measurement error (e) of each indicator represented the unique variances which were not explained by the unobserved variables. Moreover, the two-headed arrows described the unmeasured covariances, because unobserved variables were treated as exogenous or independent variables.
Figure 2. Initial measurement model for school climate with standardized estimates
The modified measurement model for School Climate had 351 distinct sample moments or number of pieces of information provided by the data with 64 parameters estimated that resulted in 287 degrees of freedom based on an overidentified model, and a chi-square value of 709.128 with probability level equal to .000. Compared to hypothesized model, the final respecified measurement model for School Climate reduced a chi-square value by 3,391.253 (4100.381–709.128) and degree of freedom by 878 (1165–287), showing a substantial change in a model. The final model had a total number of 57 variables; of which 31 were unobserved exogenous variables and 26 were observed endogenous variables (see ). This model had a total of 52 regression weights, 31 of which were fixed and 21 were estimated. The model also consisted of 12 covariances and 31 variances, all of which were estimated. In general, the final measurement model for School Climate had a total of 95 parameters, 64 of which were estimated and 31 were fixed.
Results indicated that all standardized factor loadings were at an acceptable level (> .70), which denotes that each indicator has explained an acceptable amount of the variance. Evaluation of modified model showed the relative chi-square value less than 3 (2.47), which supported an acceptable fit of a model to the data. Similarly, the comparative fit indices of NFI, RFI, CFI, TLI, and IFI values were all above .90, further supporting the adequate fit of the model to the data. Moreover, SRMR value of .04 and RMSEA value of .06 (bonded between .057 and .068) provided additional supports that the model fitted the data. We also assessed standardized residual covariances to test whether the final model was well specified against a criterion value of 2.58. Consequently, the standardized residual covariance values in modified model ranged between −1.898 and 2.53 (< 2.58), which denotes that the final reflective model for School Climate measurement was adequately specified. In general, this study indicated School Climate as multidimensional concept with five indicators that include: (1) school leadership; (2) institutional safety; (3) professional learning and teaching climate; (4) relationships within school; and (5) institutional environment. This study finding lends support to evidence documented in comprehensive reviews of the dimensions of school climate (Cohen et al., Citation2009; Lewno-Dumdie et al., Citation2019; Thapa et al., Citation2013), though it disproves the previous findings which provided three-factor solution (Becerra, Citation2016; Anwar & Anis-ul-haque, Citation2014; Bradshaw et al., Citation2014; Rezapour et al., Citation2020) and seven-factor solution (Liu et al., Citation2014) to measure teachers’ perceptions of school climate. In this study, it was argued that most previous researchers provided three-factor solution because they utilized U.S. Department of Education’s model which focuses on safety, engagement, and the environment as conceptual foundation for their study (Thapa et al., Citation2013) rather than NSCC’s model. As Thapa et al. (Citation2013) point out, U.S. Department of Education’s model disregards leadership, relationships, and teaching and learning, which are major school climate dimensions documented in literature (Cohen et al., Citation2009; National School Climate Center (NSCC), Citation2015). In addition, this study substantiates the instruments provided by previous researchers that can be utilized to assess teachers’ perceptions of school climate (Becerra, Citation2016; Anwar & Anis-ul-haque, Citation2014; Hultin et al., Citation2016; Liu et al., Citation2014). In contrast with previous studies, this study has established construct validity and reliability for five school climate dimensions using Confirmatory Factor Analysis (CFA) which is the structural equation modeling approach. In conclusion, this study findings have showed school climate as multidimensional concept with fully correlated five-factor solution comprising 26 reliable and valid items that can be used to assess teachers’ perceptions of school climate and promote further intervention in teachers’ professional capital development.
5. Conclusions and practical implications
The findings support School Climate as a multidimensional construct with five underlying components: (1) School Leadership; (2) Professional Learning and Teaching Climate; (3) Institutional Environment; (4) Relationships within School; and (5) Institutional Safety. These components altogether accounted for 67.55% of variance in school climate construct, in which the School Leadership explained maximum variances (49.30%) and Institutional Safety explained very small variance (2.65%) in school climate construct. This study came up with validated measurement scale which we named as Teacher’s Perception of School Climate (TPSC), which may be useful tool to assess school’s institutional climate from the teacher’s perspective and support further intervention for the overall school improvement. This scale has five latent factors (dimensions) and 26 indicators (items) of those latent factors of School Climate with significant inter-item correlation estimates that range from .22 to .86, while the inter-factor correlation estimates range from .48 to .73. The results of five-dimensional measures of School Climate are validated through rigorous statistical procedures by eliminating the initial items poorly explained the intended construct. In connection to this, and the overall standardized factor loading estimates of all items ranged from .70 to .93, affirming that each latent factor of School Climate accounted for about 50% and above variances in their identified indicators. The findings also show adequate construct reliability, discriminant validity and convergent validity of the five aspects of School Climate.
The practical implication of this study is that the validated measurement scale for School Climate is applicable in the Ethiopian primary school context. This validated instrument can be used to decide up on the state of school climate by assessing teachers’ perception of school leadership, professional learning and teaching climate, institutional environment, relationships within school and institutional safety. Since a positive School Climate is fundamental to wholly improve schooling and quality of education, understanding the teachers’ perception of these five dimensions of School Climate would facilitate the education experts and school principals to identify and work on the institutional determinants that significantly influence teachers’ professional learning and professional capital development endeavors which in turn influence the students’ academic success in primary education. In conclusion, this study has confirmed school climate as multidimensional concept and advanced the Ethiopian version of School Climate scale constituting 26 reliable and valid items that could be used to assess the aspects of School Climate from the viewpoint of the teachers. For the first time, this study came up with a reliable and validated scale which is crucial to assess School Climate from the teachers’ point of view in the Ethiopian primary schools context. Moreover, it is suggested that the future researcher should apply multi-group and multilevel confirmatory factor analysis to enhance the applicability of the measurement scale across countries.
6. Limitations and recommendations for future research
This study has two major limitations that need to be addressed by the future researchers. First, the study is not based on independent samples or multilevel datasets, which allows for cross-validation analyses of School Climate construct measurement model. Accordingly, we recommend future researchers interested in school climate study to validate and substantiate our measurement model through multiple-group and multilevel CFA analyses. Second, this School Climate measurement scale is developed and validated within the context of Awi district of Ethiopia. As a result, we recommend researchers in other country or district to further establish the reliability and validity of our instrument vis-à-vis their school contexts. The researchers and educators need more reliable and valid measures to effectively assess and analyze school climate and devise better intervention strategies to realize effective schooling. Furthermore, the results of this study will substantiate the understanding of school climate concept by rendering them theoretically based and psychometrically sound model for school climate assessment and analysis.
Additional information
Funding
Notes on contributors
Sintayehu Belay
Sintayehu Belay is PhD candidate in Curriculum and Instruction at Bahir Dar University. He published several articles related to teacher education and learning. He has been involved in teaching different teacher education courses. His major areas of research include teacher professionalism, teacher development, life-long learning, etc. Solomon Melese is Associate Professor in Curriculum Design at Bahir Dar University. He has been teacher educator for 18 years. He published several articles related to teacher education and professional development. His main areas of research include teacher education and professional development, instructional design, curriculum studies, etc. Amera Seifu is Associate Professor in Curriculum and Instruction at Bahir Dar University. He has been teacher educator for the last 30 years. He has published several articles related with teacher education and development and one book in progress. His main areas of research include teacher education, professional development, instructional design, curriculum studies, etc.
References
- Allodi, M. W. (2010). The meaning of social climate of learning environments: Some reasons why we do not care enough about it. Learning Environment Research, 13(2), 89–24. https://doi.org/https://doi.org/10.1007/s10984-010-9072-9
- Anwar, M., & Anis-ul-haque, M. (2014). Development of school climate scale (SCS): Measuring primary school teachers’ perceptions in Islamabad, Pakistan. FWU Journal of Social Sciences, 8(2), 51–58.
- Becerra, S. (2016). School climate of educational institutions: Design and validation of a diagnostic scale. International Education Studies, 9(5), 96–107. https://doi.org/https://doi.org/10.5539/ies.v9n5p96
- Berkowitz, R., Moore, H., Astor, R. A., & Benbenishty, R. (2016). A research synthesis of the associations between socioeconomic background, inequality, school climate, and academic achievement. Review of Educational Research, 87(2), 425–469. https://doi.org/https://doi.org/10.3102/0034654316669821
- Bradshaw, C. P., Waasdorp, T. E., Debnam, K. J., & Johnson, L. S. (2014). Measuring school climate in high schools: A focus on safety, engagement, and the environment. Journal of School Health, 84(9), 593–604. https://doi.org/https://doi.org/10.1111/josh.12186
- Brown, T. A. (2015). Confirmatory factor analysis for applied research (2nd ed.). The Guilford Press.
- Cohen, J., Mccabe, E. M., Michelli, N. M., & Pickeral, T. (2009). School climate: Research, policy, practice, and teacher education. Teachers College Record, 111(1), 180–213.
- Collier, J. E. (2020). Applied structural equation modeling using AMOS: Basic to advanced techniques. Routledge.
- Cornell, D., Huang, F., Konold, T., Shukla, K., Malone, M., Datta, P., Jia, Y., Stohlman, S., Burnette, A., & Meyer, J. P. (2016). Development of a standard model for school climate and safety assessment: Final report. University of Virginia. https://www.ncjrs.gov/pdffiles1/ojjdp/grants/251102.pdf
- Dary, T., & Pickeral, T. (Eds.). (2013). School climate: Practices for implementation and sustainability. National School Climate Center.
- Devine, J., & Cohen, J. (2007). Making your school safe: Strategies to protect children and promote learning. Columbia University, Teachers College Press.
- DeWitt, P., & Slade, S. (2014). School climate change: How do I build a positive environment for learning? ASCD Publications.
- Faster, D., & Lopez, D. (2013). School climate and assessment. In T. Dary & T. Pickeral (Eds.), School climate practices for implementation and sustainability (pp. 17–21). National School Climate Center.
- Feinstein, S. G., & Kiner, R. W. (2011). The brain and strengths based school leadership. Corwin, A SAGE Company.
- Gage, N. A., Larson, A., & Chafouleas, S. M. (2016). The Meriden school climate survey–student version: Preliminary evidence of reliability and validity. Assessment for Effective Intervention, 41(2), 67–78. https://doi.org/https://doi.org/10.1177/1534508415596960
- Hair, J. F., Black, W. C., Babin, B. J., & Anderson, R. E. (2019). Multivariate data analysis (8th ed.). Cengage Learning, EMEA.
- Hamid, M. R., Sami, W., & Sidek, M. H. (2017). Discriminant validity assessment: Use of Fornell & Larcker criterion versus HTMT criterion. Journal of Physics: Conference Series, 890, 1–5. https://doi.org/https://doi.org/10.1088/1742-6596/890/1/012163
- Henseler, J. (2017). Bridging design and behavioral research with variance-based structural equation modeling. Journal of Advertising, 46(1), 178–192. https://doi.org/https://doi.org/10.1080/00913367.2017.1281780
- Henseler, J., Ringle, C. M., & Sarstedt, M. (2015). A new criterion for assessing discriminant validity in variance-based structural equation modeling. Journal of the Academy of Marketing Science, 43(1), 115–135. https://doi.org/https://doi.org/10.1007/s11747-014-0403-8
- Ho, R. (2006). Handbook of univariate and multivariate data analysis and interpretation with SPSS. Taylor & Francis Group, LLC.
- Hughes, W. H., & Pickeral, T. (2013). School climate and shared leadership. In T. Dary & T. Pickeral (Eds.), School climate practices for implementation and sustainability (pp. 26–29). National School Climate Center.
- Hultin, H., Ferrer-Wreder, L., Eichas, K., Karlberg, M., Grosin, L., & Galanti, M. (2016). Psychometric properties of an instrument to measure social and pedagogical school climate among teachers (PESOC). Scandinavian Journal of Educational Research, 1–20. https://doi.org/https://doi.org/10.1080/00313831.2016.1258661
- Kline, R. B. (2016). Principles and practice of structural equation modeling (4th ed.). The Guilford Press.
- Kohl, D., Recchia, S., & Steffgen, G. (2013). Measuring school climate: An overview of measurement scales. Educational Research, 55(4), 411–426. https://doi.org/https://doi.org/10.1080/00131881.2013.844944
- Lewno-Dumdie, B. M., Mason, B. A., Hajovsky, D. B., & Villeneuve, E. F. (2019). Student-report measures of school climate: A dimensional review. School Mental Health. https://doi.org/https://doi.org/10.1007/s12310-019-09340-2
- Liu, Y., Ding, C., Berkowitz, M. W., & Bier, M. C. (2014). A psychometric evaluation of a revised school climate teacher survey. Canadian Journal of School Psychology, 29(1), 54–67. https://doi.org/https://doi.org/10.1177/0829573514521777
- Moro, A., Vinha, T., & Morais, A. (2019). School climate evaluation: Designing and validating measurement instruments. Cadernos De Pesquisa, São Paulo, 49(172), 312–334. https://doi.org/https://doi.org/10.1590/198053146151
- National School Climate Center (NSCC). (2015). The comprehensive school climate inventory. Measuring the climate for learning. Whately Elementary School. http://www.schoolclimate.org
- Payne, A. A. (2018). Creating and sustaining a positive and communal school climate: Contemporary research, present obstacles, and future directions. Villanova University, U.S. Department of Justice. https://www.ncjrs.gov/pdffiles1/nij/250209.pdf
- Ramelow, D., Currie, D., & Felder-Puig, R. (2015). The assessment of school climate: Review and appraisal of published student-report measures. Journal of Psychoeducational Assessment, 1–13. https://doi.org/https://doi.org/10.1177/0734282915584852
- Rezapour, M., Khanjani, N., & Mirzaee, M. (2020). Construct validity of Maryland safe and supportive schools climate survey in Iran: A validation study. International Journal of School Health, 7(2), 1–13.
- Rudasill, K. M., Snyder, K. E., Levinson, H., & Adelson, J. L. (2017). Systems view of school climate: A theoretical framework for research. Educational Psychology Review. https://doi.org/https://doi.org/10.1007/s10648-017-9401-y
- Ryberg, R., Her, S., Temkin, D., Madill, R., Kelley, C., Thompson, J., & Gabriel, A. (2020). Measuring school climate: Validating the education department school climate survey in a sample of urban middle and high school students. AERA Open, 6(3), 1–21. https://doi.org/https://doi.org/10.1177/2332858420948024
- Schumacker, R. E., & Lomax, R. G. (2016). A beginner’s guide to structural equation modeling (4th ed.). Routledge.
- Thapa, A., Cohen, J., Guffey, S., & Higgins-D’Alessandro, A. (2013). A review of school climate research. Review of Educational Research, 83(3), 357–385. https://doi.org/https://doi.org/10.3102/0034654313483907
- Weissbourd, R., Bouffard, S. M., & Jones, S. M. (2013). School climate and moral and social development. In T. Dary & T. Pickeral (Eds.), School climate practices for implementation and sustainability (pp. 30–34). National School Climate Center.
- Zullig, K. J., Koopman, T. M., Patton, J. M., & Ubbes, V. A. (2010). School climate: Historical review, instrument development, and school assessment. Journal of Psychoeducational Assessment, 28(2), 139–152. https://doi.org/https://doi.org/10.1177/0734282909344205