
Abstract
Several decades of research suggesting differences in test performance across paper-based and computer-based assessments have been largely ameliorated through attention to test presentation equivalence, though no studies to date have focused on graph comprehension items. Test items requiring graph comprehension are increasingly common but may be especially prone to format effects. A crossover experimental design was used to compare paper-based (PBT) with computer-based test (CBT) formats in a sample of 28 MBA students answering 6 items requiring comprehension of Venn diagrams, scatterplots, and divided bar charts. Data analysis using a 2x2x2x2 ANOVA revealed that participants’ better performance on CBT, η2 = .07, was not statistically significant, p = .23. While DIF analysis suggested no difference by gender in total score or individual items, interaction analysis between gender and format showed the overall format effect was due mainly to males performing better on CBT, p = .02, d = 0.91. Females performed about the same in both formats. For scatterplot questions, participants also performed better on CBT, p < .005, φ = 0.41. Finally, participants were more likely to answer an easier question requiring attention to fewer graph components correctly after answering a more challenging question that required attention to all graph components, p = .02, φ = 0.5. Interaction analysis also revealed a large carryover effect from the research design (η2 = .48, p = .000), which we interpreted as a learning effect.
PUBLIC INTEREST STATEMENT
Across grade levels and subjects, educators rely on both paper- and computer-based resources for instruction and assessment. The global pandemic and the abrupt shift to remote digital instruction and assessment has amplified questions about validity and fairness of online assessments. Are there differences in test performance between reading graphs on paper versus computer? Using an experimental research design, we compared the performance of Master of Business Administration (MBA) students on paper-based and computer-based graph comprehension questions. Consistent with other recent research in mathematics and reading, there was no difference in performance between paper and computer formats. There were also no differences between females’ and males’ performance. However, there was a difference among the males between the two test modalities; men performed much better on graph comprehension questions presented on computer than they did on paper. The reasons for these differences are not yet known and require future research.
1. Introduction
Accurately interpreting quantitative information presented within tables and graphs is necessary in modern society (Card, S. K, Citation2009; Latour, Citation1986; Phage et al., Citation2017; Wainer, Citation1992). People typically use some form of multimedia technology to collect and analyze data before creating these tables and graphs to present their findings (Donnelly-Hermosillo et al., Citation2020; Kuo & Wu, Citation2013; Strobel et al., Citation2018). Yet, in most educational settings where students learn to comprehend tables and graphs accurately, paper is also used as a presentation format for these data displays (Lai et al., Citation2016).
With our increased accessibility and scale of digital data, improved human-computer interaction techniques (Heer & Shneiderman, Citation2012; Hegarty, Citation2011), and increased popularity of online learning across K-12 and post-secondary education (Alexander et al., Citation2001; Garas & Hassan, Citation2018), recognizing comprehension differences between graphs read on paper compared to graphs read from a screen is the professional responsibility of researchers, educators, and test creators.
For decades, educators have utilized computers for test administration (Chen & Perie, Citation2018; Kuo & Wu, Citation2013), and researchers have protected test validity and reliability through studies comparing computer assessment results to their paper-and-pencil counterparts for almost as long (Bennett, Citation2015; Bennett et al., Citation2008; Lissitz & Jiao, Citation2012). While an extensive review of the literature did not yield any prior research specifically investigating format effects on graph comprehension tests, a few studies related to our research warrant attention. Research on assessment format effects, comparing paper-based (PBT) with computer-based tests (CBT), dates back at least 30 years (Leeson, Citation2006). Broadly speaking, while data have been collected and analyzed across a range of academic areas (for a review, see Kingston, Citation2009a) including business education (Anakwe, Citation2008; Clariana & Wallace, Citation2002), there has been a focus on comprehension in reading (Dillon, Citation1992; Higgins et al., Citation2005; Mangen et al., Citation2013; for a review, see Singer & Alexander, Citation2017) and comprehension during mathematical computation experiences but not graph comprehension in mathematics (Bennett et al., Citation2008; Broadfoot & Black, Citation2004; Poggio et al., Citation2005). Yet, improvements in technology combined with increased computer familiarity among test takers give us reason to examine the continued applicability of earlier research findings.
Our study was designed to compare graph comprehension with MBA students using two different format presentations of three graph types, each one differing with their combinations of measurement levels. The Graduate Management Admissions Test (GMAT) assesses graph comprehension within a high-stakes, multiple-choice testing environment (Hilbert & Jaffe, Citation2012), and the Integrated Reasoning section of the GMAT attempts to assess graph comprehension skills among applicants for MBA programs (Graduate Management Admissions Council, Citation2012). In our study, we measured graph comprehension performance using GMAT-style questions excerpted from a popular test preparation book (Hilbert & Jaffe, Citation2012) and coded using our theoretical framework (Bertin, Citation1983) as Intermediate and Overall Level Questions. These questions were selected to incorporate meaningful question asking, pattern recognition and retrieval, statistical algorithms, contextual referents, and data transformations (Groth, Citation2007; Heer & Shneiderman, Citation2012; Hutchins, Citation1995; Konold et al., Citation2015; Shah et al., Citation1999; Shaughnessy, Citation2007; Tufte, Citation2001).
Specifically, the GMAT’s Integrated Reasoning (IR) Graphics Comprehension questions use graph images as text adjuncts (for a review, see Shah & Hoeffner, Citation2002) alongside parsimonious textual information. Readers must engage in a conversation with compressed information embedded in text adjuncts and contextual details within question and multiple answer choice options. Padilla et al. (Citation2018) use the discourse metaphor, labeling this process an interrogation between images and texts, asserting “the construction of the mental representation through interrogation … is the process of seeking out information that is necessary to answer the conceptual question” (p. 4). Interrogating a graph and text adjunct engage cognitive and psychomotor behaviors (see Friel et al., Citation2001). Specifically, three roughly-sequential interpretive processes influence graph comprehension: encoding visual features of the graph, interpreting the conceptual relationships implied by those visual features, and connecting those visual features to their understanding of graph referents (Bertin, Citation1973, Citation1983; Boote, Citation2014; Friel et al., Citation2001; Padilla et al., Citation2018; Shah & Hoeffner, Citation2002).
2. Purpose and research question
Our study’s purpose was to compare MBA students’ graph comprehension performance differences comparing PBT and CBT formats of Venn diagrams, scatterplots, and divided bar charts representing graph types from the Integrated Reasoning section of the GMAT. The study was guided by one research question: Is there a difference in performance between paper-based and computer-based GMAT-style Integrated Reasoning questions requiring comprehension of graphs and texts with MBA students in their final semester?
Based on prior research that integrating displays of visual images reduces cognitive load (Sweller, Citation1988) and has a strong effect on performance (Jang et al., Citation2012), we hypothesized interacting with graphs and texts on paper would support greater comprehension compared to interacting with the same graphs on computer. We expected MBA participants would have greater ease manipulating graph and text information presented on paper in order to select and process relevant information necessary to answer the questions (see Heer & Shneiderman, Citation2012). Conversely, we expected difficulties encoding and relating salient structures within graphs and texts while working on a computer would negatively affect comprehension (Berg & Boote, Citation2017; Boote & Boote, Citation2017; Carpenter & Shah, Citation1998; Shah & Hoeffner, Citation2002).
3. Graph Comprehension in Graduate Education
Students graduating with a Master’s degree in a quantitative field like Business Administration are at a terminus of a mathematics educational trajectory. In sum, MBA students are expected to be fluent in quantitative analysis and mathematical reasoning found within finance, accounting, business statistics, economics, strategy management theory, marketing, logistics, and human resources management (Herrington, Citation2010). MBA courses on these topics emphasize creating, interpreting, and reporting graphic representations of data across paper- and electronic-based media throughout a variety of environments and scenarios. While our sample focused on MBA students, we believe understanding how students, across grade levels and environments, comprehend graphs through various media is a priorityFootnote1.
Interestingly, every initial and post-graduate University admissions test (e.g., SAT, ACT, GRE, GMAT, LSAT, and MCAT),Footnote2 as well as most science, social science, mathematics, statistics, and engineering tests, include questions requiring quantitative and verbal reasoning (Rodriguez, Citation2013) through the analysis of charts, diagrams, tables, spreadsheets, and/or graphs (ACT, Citation2013; Brunet Marks & Moss, Citation2016; College Board, Citation2015; ETS-GRE, Citation2018; Garas & Hassan, Citation2018; Graduate Management Admissions Council, Citation2012; Kuncel et al., Citation2007; Mitchell et al., Citation2016; Wao et al., Citation2016). Regarding assessment format, all of these tests, except the SAT, are currently administered using CBT. PISA (Programme for International Student Assessment) changed testing formats from PBT to CBT in 2015 and NAEP (National Assessment of Educational Progress) followed suit in the US with a format change in 2017 (Buerger et al., Citation2016).
4. GMAT’s Integrated Reasoning Characteristics Connected to the Current Study
MBA programs across the US and Canada use the GMAT for admission, based on the general belief that it strongly predicts successful graduate performance (Kuncel et al., Citation2007; Oh et al., Citation2008). The Integrated Reasoning (IR) section, introduced in 2012 and one of four GMAT sections, measures the test taker’s ability to apply “high-level reasoning” by “synthesizing information from charts, tables, graphs, [and] spreadsheets” across four question types: (1) Graphics Comprehension, (2) Table Analysis, (3) Two-Part Analysis, and (4) Multi-Source Reasoning (Hilbert & Jaffe, Citation2012, p. 167). Specifically, IR Graphics Comprehension questions require test takers to use scatterplots, line graphs, tables, Venn diagrams, and bar charts to identify, evaluate and synthesize relevant data (2012). Synthesis usually involves arithmetic computations and comprehension, with a heavy emphasis on reasoning with various forms of rational numbers: fractions, ratios, proportions, and rates (Graduate Management Admissions Council, Citation2012). We used Graphics Comprehension IR questions that required MBA students in their final semester to assimilate, analyze, and interpret data using two test presentation formats, PBT and CBT, and three graph types, Venn diagram, scatterplot, and divided bar charts.
High-stakes decisions resulting from these PBT and CBT assessments serve students as legitimate currency (Broadfoot & Black, Citation2004), opening and closing educational opportunities. Our study was not intended to critique the GMAT, but, instead, to question if differences in assessment format affected graph comprehension performance. While critiquing a specific assessment platform was not our intent, we acknowledge and agree with Broadfoot and Black that with so much at stake, we all must ensure assessment currencies retain their value.
5. Relevant Research on Format Effects
While early studies of format effects sometimes indicated better performance for PBT compared to CBT (Kingston, Citation2009a), many of these differences in testing outcomes have decreased over time. Challenges students previously faced while taking tests on computer have been ameliorated by computer software and assessment developments; specifically, the challenge of scrolling on the computer while reading a text (Chen & Perie, Citation2018; Higgins et al., Citation2005; Leeson, Citation2006).
For our study, we minimized visual differences between CBT and PBT versions by creating a PDF version of test items using the paper version where each question item fit in its entirety on the computer screen. We also randomly assigned the format for our first participant and then alternated the order of formats for each consecutive participant. Additionally, we considered the order of the assessment format presentation in response to research studies using a within-subject design, like ours, where each participant takes the test using both formats (see Buerger et al., Citation2016).
Factors Other than Assessment Format Affecting Performance
While the study’s primary focus was to compare MBA students’ performance answering Graphics Comprehension IR questions using PBT and CBT, prior research has identified other factors affecting performance variability. Ability and aptitude are leading factors that affect performance (Noyes et al., Citation2004; Watson, Citation2001). Some studies have also identified gender as a relevant factor affecting performance (Gallagher et al., Citation2000; Parshall & Kromrey, Citation1993).
Item order is another factor found to affect assessment outcomes (Debeer & Janssen, Citation2013; Dreben et al., Citation1979; Hambleton & Traub, Citation1974; Kingston & Dorans, Citation1984). Prior research has suggested two explanations for item order effects—learning and fatigue (Debeer & Janssen, Citation2013). In a classic study of the effects of item order on a mathematics test, Hambleton and Traub found participants scored better when questions were ordered from easiest to hardest (1974). Item position effect, a related but distinct phenomenon, was not considered in our study.
6. Theoretical Perspectives
Bertin’s semiotic theory of graph comprehension allowed us to do two things that supported our research design (1983). First, we presumed graph readers engage in three successive reading processes when comprehending any graph: 1) External Identification of the graph’s title (invariant), independent and dependent variables (components) and their levels of measurement, 2) Internal Identification of data representations within the graph like points, bars, and line segments that relate the independent and dependent variable components together, and 3) Perception of Pertinent New Correspondences where graph questions are formed and comprehended according to the attention the reader is giving to various graph components.
Second, we used Bertin’s three graph reading levels to understand cognitive behaviors involved within the larger graph comprehension process (1983). Questions requiring the graph reader to attend to a single element of a component resulting in a single correspondence are called Elementary Level Questions. Intermediate Level Questions are introduced by a group of elements within a component resulting in multiple correspondences. Questions requiring attention to a whole component are called Overall Level Questions.
While Bertin’s (Citation1983) semiotic theory of graph comprehension was our study’s main theoretical lens, distributed cognition (Hutchins, Citation2010) and cognitive load theory (Sweller, Citation1988) provided complementary theoretical lenses to better understand graph and text comprehension in context. While comprehending graphs during problem solving, people offload their cognition into their physical and social environment (Greeno & Hall, Citation1997) to reduce the amount of load on working memory and cognitive processes (Paas et al., Citation2010).
7. Methods
7.1. Participants
Across four semesters, MBA students in their final semester at a Southeastern University were recruited using a voluntary, anonymous survey during a Strategic Management course taught by the third author. The University’s IRB granted approval for this study. Participants indicated their willingness to participate in individual clinical interviews with the first author at the end of the survey. All volunteers were accepted to participate and compensated with a 20 USD gift cardFootnote3 for their time. An equal number of female (n = 14) and male participants (n = 14) volunteered for the study.Footnote4
For participants who took the GMATFootnote5 for admission into the University’s MBA Program (n = 15), their mean score was 557.3 (77.4), and their median score was 530. For participants who took the GREFootnote6 for admission into the University’s MBA Program (n = 13), their mean score was 308.5 (8.8), and their median score was 308. For all 28 participants, their final MBA GPA mean was 3.58 (0.29), and their median MBA GPA was 3.62.
Preliminary sample size calculations. To minimize the likelihood of Type I and II errors to an acceptable level, we conducted a sample size calculation. Whenever possible, these calculations should be based on findings from prior research examining similar phenomena with similar samples. Most prior research on format effects was conducted in K-12 schools on a variety of subjects. No studies were found examining format effect with GMAT-style assessments. Two studies were identified that examined format effects on undergraduate business majors completing GRE-style assessments. Goldberg and Pedulla (Citation2002) found students taking the paper version outperformed students taking the computer-based test, d = 0.679, on the quantitative subtest. Similarly, Clariana and Wallace (Citation2002) also found that undergraduate business students who took the paper-based test outperformed the computer-based students, d = 0.462, without differentiating between verbal and quantitative results.
We used G*Power (Version 3.1.9.3) to calculate the a priori minimum sample size to reduce the likelihood of Type I and II errors to acceptable rates. We assumed “ANOVA: Repeated measures, within-between interaction,” an alpha error probability of .05, Power (1-beta error probability) of .8, a correlation of r = .5 between PBT and CBT scores, and effect sizes of between f = .23 and f = .34 (roughly equivalent to d = .462 and d = .679, respectively). These assumptions yielded a required sample between 20 and 40. Assuming that the Clariana and Wallace (Citation2002) results for the quantitative portion of the GRE were a better predictor of performance on GMAT Integrated Reasoning questions, we believed that a sample of 28 was sufficient to proceed. A post hoc Power analysis is presented at the end of the Results section.
8. Instrument
Our clinical interview task included six GMAT-type Integrated Reasoning Graphics Comprehension questions in multiple-choice format excerpted with permission from a popular GMAT practice book (Hilbert & Jaffe, Citation2012). Each question included a graphic representation of data and textual information. Questions 1 and 4 (see ) shared the same two-set Venn diagram with a symbol key indicating the number of students taking Spanish and French classes at a College. Questions 2 and 5 (see ) shared the same bi-modal scatterplot representing frequency and duration of eruptions from a certain geyser. Questions 3 and 6 (see ) shared the same divided bar charts, one representing absolute Gross Domestic Product (GDP) in one year for five world regions and the other representing percentage growth in GDP the following year for the same regions.
Figure 1. Question 1, Answer: B; GMAT-style Integrated Reasoning Graphics Comprehension question requiring comprehension of a Venn diagram. From Barron’s new GMAT: Graduate Management Admission Test (17th ed.) (p. 60), by S. Hilbert and E. D. Jaffe, 2012, Hauppauge, NY: Barron’s Educational Series, Inc. Copyright 2012 by Stephen Hilbert. Used with permission
Figure 2. Question 4, Answer: D; GMAT-style Integrated Reasoning Graphics Comprehension question requiring comprehension of a Venn diagram. From Barron’s new GMAT Graduate Management Admission Test (17th ed.) (p. 60), by S. Hilbert and E. D. Jaffe, 2012, Hauppauge, NY: Barron’s Educational Series, Inc. Copyright 2012 by Stephen Hilbert. Used with permission
Figure 3. Question 2, Answer: D; GMAT-style Integrated Reasoning Graphics Comprehension question requiring comprehension of a bimodal scatter plot. From Barron’s new GMAT: Graduate Management Admission Test (17th ed.) (p. 498), by S. Hilbert and E. D. Jaffe, 2012, Hauppauge, NY: Barron’s Educational Series, Inc. Copyright 2012 by Stephen Hilbert. Used with permission
Figure 4. Question 5, Answer: C; GMAT-style Integrated Reasoning Graphics Comprehension question requiring comprehension of a bimodal scatter plot. From Barron’s new GMAT: Graduate Management Admission Test (17th ed.) (p. 60), by S. Hilbert and E. D. Jaffe, 2012, Hauppauge, NY: Barron’s Educational Series, Inc. Copyright 2012 by Stephen Hilbert. Used with permission
Figure 5. Question 3, Answer: A; GMAT-style Integrated Reasoning Graphics Comprehension question requiring comprehension of horizontal and vertical bar graphs. From Barron’s new GMAT: Graduate Management Admission Test (17th ed.) (p. 416), by S. Hilbert and E. D. Jaffe, 2012, Hauppauge, NY: Barron’s Educational Series, Inc. Copyright 2012 by Stephen Hilbert. Used with permission
Figure 6. Question 6, Answer: B; GMAT-style Integrated Reasoning Graphics Comprehension question requiring comprehension of horizontal and vertical bar graphs. From Barron’s new GMAT: Graduate Management Admission Test (17th ed.) (p. 416), by S. Hilbert and E. D. Jaffe, 2012, Hauppauge, NY: Barron’s Educational Series, Inc. Copyright 2012 by Stephen Hilbert. Used with permission
Together, Questions 1, 2, and 3 made up Question Set A, and Questions 4, 5, and 6 made up Question Set B. Print and electronic Portable Document File (PDF) versions each had three questions (1–3 and 4–6) to allow both formats to be used during each interview. Consistent with GMAT Integrated Reasoning Graphics Comprehension questions, all items asked participants to read a passage and an accompanying graph that supported the text. Each set of questions assessed participants’ understanding of the interplay among the graph and textual passage as well as their ability to identify and perform appropriate computations. These cognitive behaviors are what is meant by “integrated reasoning.”
Graph comprehension processes and graph question levels. We classified Questions 1 & 3 as Intermediate Level Questions using Bertin’s typology of graph question levels (1983), since they required integrating multiple data points following the encoding of the graph’s visual features. We classified Questions 2, 4, 5, & 6 as Overall Level Questions (1983), since they required integrating all data points represented on the graphs after encoding the visual features.
The Venn diagram in Questions 1 and 4 represented a categorical independent variable (French, Spanish, both French and Spanish, neither French nor Spanish) and frequency counts as dependent variables. The divided bar charts in Questions 3 and 6 also represented a categorical independent variable (each of the five world regions) and continuous dependent variables (GDP in trillions of dollars and annualized percentage change in GDP). The scatterplot in Questions 2 and 5 represented continuous independent and dependent variables (duration of eruptions, in minutes, and time interval between eruptions, in minutes, respectively).
9. Procedures
To measure possible differences in graph comprehension performance, we designed an instrument with 6 GMAT-style Integrated Reasoning multiple choice questions separated into two question order sets (Set A-B & B-A) of three questions (Set A: 1–3, & Set B: 4–6) administered across two assessment formats, PBT and CBT. Each set shared the same three graphs with each graph having different combinations of measurement levels: Venn diagram (categorical independent variable and frequency count for the dependent variable), scatterplot (continuous independent variable and continuous dependent variable), and divided bar charts (categorical independent variable and continuous dependent variable). Question sets were administered in different combinations of PBT and CBT formats and different orders of question set presentation.
After IRB approval, the first author administered questions to each of 28 participants in individual data collection sittings that supported our research question to be answered using a within-subject experimental design (Creswell, Citation2014; Shadish et al., Citation2002). Our first participant was randomly assigned to answer Questions 1–3 (Question Set A) on Paper and Questions 4–6 (Question set B) on Computer (Assignment 1). Thereafter, the sequence of assessment format alternated (i.e., Participant 2 answered Questions 1–3 on Computer and Questions 4–6 on paper, Assignment 2). To control for question order effect, 14 participants answered Questions 1–3 and then Questions 4–6, and 14 participants answered Questions 4–6 and then Questions 1–3 (Assignments 3 and 4).Footnote7
Our within-subject experimental design provided the freedom to make comparisons in performance for each participant across graph types presented in two assessment formats. In addition, by reducing error variance resulting from participant differences, our within-subject design provided higher statistical power compared to a between-subjects design (Buerger et al., Citation2016, p. 602; see also Schroeders & Wilhelm, Citation2011). Bertin’s semiotic theory of graph of comprehension (1983) guided our research design, augmented by two cognitive learning theories (Hutchins, Citation2010; Sweller, Citation1988).
Using these procedures, participants were effectively assigned randomly to one of four Assignments (see ). While the use of alternating assignments would be considered a quasi-experimental design for between-subjects studies (Shadish et al., Citation2002), it is, nonetheless, acceptable for within-subject experimental design studies where differences are assessed for each participant individually (Draeger, Citation2009). In all assignments, the same six questions were used. Order effects and format effects were controlled by varying sequences of test items and formats.
Table 1. Four Test Assignments
Participants could take as much time as they needed to answer each question. Thus, it was a “power” testing condition rather than a “timed” testing condition, different than the GMAT in which applicants have 30 minutes to answer 12 questions.
With participants’ consent, their GRE or GMAT scores, and their Graduate GPA, were collected from the University’s Registrar’s office after they graduated from the MBA program.
10. Data Analysis
Individual questions were scored as either correct or incorrect (dichotomous). Aggregate scores were treated as continuous. Data were analyzed using a 2x2x2x2 ANOVA to answer the research question, using one within-subject variable (Media Format) and three between-subjects variables (Media Order, Question Order, and Gender). Before conducting the analysis, we verified the data met the assumptions of the statistic. Analysis revealed no univariate or multivariate outliers. According to the Shapiro-Wilk Normality Test, participants’ scores deviated slightly from a normal distribution, W = .87, compared to a threshold value of .896 at p = .01. However, ANOVA is quite robust to minor violations of normality, so we proceeded. Variances among the sub-samples were sufficiently similar, meeting the assumption of sphericity. Within-subject, between-subjects, and interaction effects are reported. Partial eta-squared is reported as the measure of effect size.
11. Results
Data from 28 MBA students in their final semester, each of whom completed one of four assignments during individual testing sessions, were used to answer our research question. Preliminary analysis showed the six GMAT-style questions proved sufficiently challenging for participants who scored a mean of 3.72 (1.2). shows participant characteristics and scores across four assignment groups including gender, GMAT/GRE scores, final MBA GPA, test performance on PBT, test performance on CBT, and total score. Evidence of convergent validity of our instrument is seen in the total score having moderate to strong correlations with both MBA program final GPA (r = .42, p = .013) and GMAT scores (r = .32, p = .048).
Table 2. Participant Characteristics and Scores Across Four Assignment Groups
Descriptive statistics for our data (see ) showed our directional hypothesis was not supported. Participants did not have greater success answering GMAT-style Integrated Reasoning Graphics comprehension questions on PBT versus CBT.
Mantel-Haenszel common odds ratio estimate was used to measure differential item functioning (DIF) for both the between-subjects demographic factor (Gender) as well as the within-subject (Media Format) and between-subjects factors that resulted from experimental assignment (Media Order, Question Set Order). None of the items evinced statistically significant DIF for Gender or Media Format. However, participants were much more successful answering Question 3 when it appeared in the second set of questions compared to appearing in the first set (p = .002). Among the 15 people to answer Question 3 correctly, 11 did so when they answered Question 3 in the second set of questions (φ = .5). shows that such set-order effects were not evident in the other items.
Table 3. Effects of Question Order on Item Performance
In addition, the DIF analysis showed participants who answered on a PBT first were more successful answering Question 5, one of the scatterplot items (computer first, 5 correct; paper first, 11 correct; p = .03, OR = 6.6). Conversely, participants who answered on a CBT first were more successful answering Question 2, the other scatterplot item, though the difference was not statistically significant (paper first, 7 correct; computer first, 12 correct; p = .055, OR = 6).
To understand this result, we analyzed differences in performance between test formats for each of the three graph types, using chi-squared tests of independence for each graph type (see ).
Table 4. Graph Type Question Performance Differences Across Formats
Results showed participants did statistically significantly better answering the two scatterplot items on CBT format compared to PBT format, answering only 12 items correctly on PBT compared to 23 on CBT, χ2(27) = 7.62 using the Yates correction, p < .005, φ = 0.41. Participants’ performance on the other graph types were identical on both formats.
Results from the 2x2x2x2 ANOVA showed the within-subject main effect was not statistically significant for all 28 participants’ performance between the three items they answered on PBT (M = 1.68, SD = 0.86) versus the three items they answered on CBT (M = 2.04, SD = .69), F(1, 20) = 1.53, p = .23, despite the moderate effect size (η2 = .07). The effect size was larger than prior studies on which we calculated our minimum sample size, so the lack of statistical significance was surprising. However, the correlation of r = .1 between PBT and CBT scores was much lower than assumed a priori, resulting in considerably lower power. If all else stayed constant, a sample of n = 50 would be necessary to detect statistical significance in this research design.
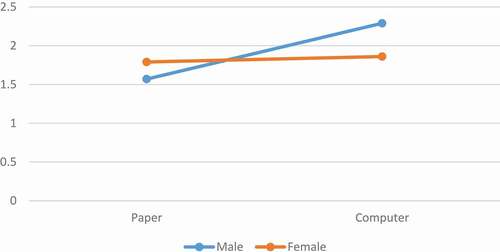
The analysis also revealed the interaction effect between Media Format*Gender was not statistically significant F(1, 20) = 0.53, p = .47, nor was the interaction between Media Format*Media Order*Gender, F(1, 20) = 0.3, p = .87. This lack of statistically significant difference reflects the small total difference in performance between males (M = 3.86, SD = 1.23) and females (M = 3.64, SD = 1.15). However, the interactions between Media Format*Question Order*Gender F(1, 20) = 7.26, p = .014, η2 = .27, and the interaction between Media Format*Question Order*Media Order*Gender F(1, 20) = 8.52, p = .008, η2 = .30, were both large and statistically significant. Evident in , these interaction effects show male participants performed much better on CBT compared to PBT (2.29 vs 1.57), while female participants performed about the same on both media (1.86 vs 1.19).
Figure 7. Graph of interaction effect between Media*Gender, showing the performance of male and female participants on paper-based and computer-based graph comprehension tests. F(1, 20) = 8.52, p = .008, η2 = .30
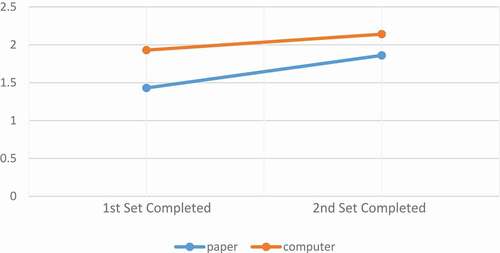
Finally, the interaction analysis revealed a statistically significant carryover effect, F(1, 20) = 18.7, p < .000, η2 = .48. Participants performed better on the second set of three questions they answered compared to the first set. The 14 participants who started on computer had lower scores on the first three CBT questions (1.86) versus the second set they completed on PBT (1.93). Similarly, the 14 participants who started on paper had lower scores on the first three PBT questions (1.43) versus the second set completed on CBT (2.14). While the 14 participants who started on computer did marginally better (0.07) on PBT questions, participants who started on paper performed much better (0.71) on the later CBT questions. In sum, regardless of media format, question set order, and gender, participants’ performance was better on the second set of three questions compared to the first set of three questions. These differences are reflected in .
Figure 8. Graph of interaction effect of Media Format*Media Order, showing that participants performed better on the second set of questions completed, regardless of test format or sub-test version. F(1, 20) = 18.7, p < .000, η2 = .48
12. Discussion
This was the first study designed to examine format effects with graph comprehension questions, despite their increasing frequency on standardized tests in K-12 and higher education. Contrary to our hypothesis that MBA students in their final semester would perform better interpreting graphs and text on PBT, our participants performed better on CBT; though the difference was not statistically significant. Interestingly, an interaction analysis revealed a statistically significant improved performance for the male sub-sample answering CBT questions compared to PBT. DIF analysis revealed a statistically significant difference for scatterplot items favoring CBT, a difference not evident for Venn diagrams or divided bar charts. The DIF analysis also revealed a question-level order effect when participants answered an Overall Level before an Intermediate Level Question based on the same graph.
13. Format Differences Across All Participants
Analysis revealed a statistically non-significant difference between participants’ performance favoring CBT with a moderate effect size (η2 = .07). This result is contrary to findings from studies in which participants were found to perform better on mathematics PBT compared to CBT (Lee & Hopkins, Citation1985; Lee et al., Citation1986; Mazzeo & Harvey, Citation1988). One interpretation is that reading comprehension is a more integral component to graph comprehension than previously realized. Similar to Kingston’s literature synthesis findings, reading comprehension performance assessed on CBT was slightly better than PPT (2009a). While 4 of our 6 questions required arithmetic reasoning and calculations, participants first had to comprehend the question text and graph information before they could reason with calculations. For reasons not yet clear, reading the text and graph of CBT questions seemed to be an advantage, though the difference was not statistically significant across all participants.
14. Format Differences Favoring CBT for Male Participants
Interaction analysis of data revealed males as a subgroup performed statically significantly better on CBT compared to PBT with a large effect size (p = .008, η2 = .30). Parshall and Kromrey (Citation1993) found a significant main effect for their entire sample favoring CBT for three subtests of a GRE pilot. They also found a statistically significant interaction effect between format and gender, suggesting female participants were less affected by format effects while male participants performed better on the CBT format.
By contrast, our finding concerning gender and format contradicts more recent research. Both Sandene et al. (Citation2005) and MacCann (Citation2006) found no disadvantage to students taking the test on either format and no format interactions with gender. None of these studies, however, included (or disaggregated) test items requiring graph comprehension.
Our results regarding gender differences in format effects are concerning but interesting. This result is concerning because males did worse comprehending graphs on PBT, and because females did not experience an advantage comprehending graphs administered on CBT. However, this is simultaneously interesting, because it is not immediately evident why males would be more supported taking a graph comprehension test on a computer. All participants were in their final semester of an MBA program that emphasized quantitative data analysis using a variety of graphical representations. There were no statistically significant differences between males’ and females’ quantitative reasoning ability or performance during coursework; therefore, participants’ gender, by itself, should not explain these differences.
15. Comprehending Scatterplots More Successfully on Computer
Participants interacting with a bi-modal scatterplot were more likely to answer correctly on CBT compared to PBT. No prior studies have examined format effects across different graph types. These results suggest questions about bi-model scatterplots were more easily interpreted on CBT. No format effects were found with Venn diagram or divided bar chart questions.
Poggio et al. (Citation2005) found that 7th graders did not show a performance advantage for either CBT or PBT on a state mathematics achievement test (195 out of 204 items). However, the 9 test items showing differences were longer and more complex than most others and favored CBT. While our Questions 2 and 5 did not require complex computations, the bi-model data distribution requiring participants to interpolate among about 100 data points may have proven more challenging than their previous scatterplot experiences.
16. Learning Effects
Participants learned from answering a more complicated graph question before an easier one, evident in a large, statistically significant item-order effect. While intended to be of comparable difficulty, our data showed Question 6 was inadvertently much more difficult than the other Overall Level Questions and much more difficult than Intermediate Level Question 3. Participants were more likely to answer Question 3 correctly after answering Question 6 compared to the opposite order, even when they answered Question 6 incorrectly. This finding contradicts an earlier study of item order effects on a mathematics test (Hambleton & Traub, Citation1974) in which participants scored better when questions were ordered from easy to hard.
Overall Level Questions like Questions 4 and 6 required graph readers to attend to the entire data set within the graph. Intermediate Level Questions like 1 and 3 only required attention to a group or subset of data within the graph. When participants were assigned Question Set Order B-A (4–6, 1–3), encountering Question 6 before Question 3, they were prompted to comprehend the entire data set within the divided bar charts for Question 6 and, consequently, benefitting from this interaction when later answering Question 3. It also seems possible when participants encountered Question 6 first, they experienced a greater level of “immersion” (Mangen et al., Citation2013) with the problem scenario. Since no answer choice matched participants’ simplistic calculations enacted on calculator and paper, they had to “keep thinking” (Berg & Smith, Citation1994). By contrast, when participants encountered Question 3 first, their place value conversions and calculations may have inadvertently corresponded with one of the distractors, providing no feedback for them to check their work (Schoenfeld, Citation2008). We interpreted the question item order effect as a result of participant learning. Prior research has suggested two explanations for item order effects—learning and fatigue (Hohensinn et al., Citation2008).
17. Comprehension Benefits of Changing One’s Focus When Shifting from Screen to Paper
Reading a mathematics problem on computer screen and then rewriting selected problem details before performing necessary computations “requires multiple changes of focus” (Kingston, Citation2009a, p. 32). Switching one’s focus between reading on computer screen to writing on paper increases cognitive load (DeLeeuw & Mayer, Citation2008; Noyes et al., Citation2004). Our hypothesis presumed the CBT format would increase extraneous load due to participants’ inability to interact with graphs on screen as they would on paper (Sweller & Chandler, Citation1994). We were wrong. Focus switching may have improved comprehension by supporting cognitive load that was germane to schema acquisition without increasing interference of extraneous cognitive load (Paas et al., Citation2010). Specifically, answering Intermediate and Overall Level Questions (Bertin, Citation1983) during second and third graph comprehension processes (1983; Carpenter & Shah, Citation1998; Shah & Hoeffner, Citation2002) required participants to process a larger number of interactivity elements when working between screen and paper. Alternating between representational media to build conceptual relationships among graph clusters, trends, and values allowed participants to connect more effectively their encoding and meaning-making outcomes (Bertin, Citation1983; Boote, Citation2014; Carpenter & Shah, Citation1998; Shah & Hoeffner, Citation2002).
18. Future Research
Our results encourage more questions to be investigated. Considering the prevalence of standards and assessments related to graph comprehension in K-12 and higher education, more research is needed to investigate these questions. However, some of the questions raised in this study were only evident because of our careful efforts to control for order effects in the research design and to extricate the effects of gender, graph types, and question levels in the analysis.
19. Hybrid Computer Paper Test (CPT) Assessment Format
We initially hypothesized MBA students would have greater success with PBT graph comprehension tasks. This incorrect prediction was based on our assumption that paper provided a more efficient medium for cognitive interactions and a more accessible way to record and highlight salient data elements needed to answer Intermediate and Overall Level Questions.
This hypothesis, like most prior research on format effects, presumed a straightforward dichotomy between PBT and CBT. However, CBT assessments almost always allow paper for inscriptional purposes during mathematics portions of the test. Specifically, individuals taking a mathematics test on computer, like the official GMAT or GRE, have access to paperFootnote8 to solve embedded probability, statistics, and rational number calculations. Future research on format effects with graph comprehension should explore effects of this “in between option” of using paper for handwritten inscriptions for mathematics tests presented electronically on screen.
Investigating a new hybrid category of Computer Paper Test (CPT) could capture behaviors of extracting salient mathematical information from a screen and transposing it on paper to perform necessary mathematical reasoning actions. While our findings did not support our initial hypothesis, we still believe comprehension is supported using tangible interactions while interrogating graphs and texts. We now speculate our Computer Paper Test(CPT) format improved comprehension with each deliberate graph interaction between screen and paper media.
20. Conclusion
While the GMAT may be specific to MBA applicants, assessing graph comprehension across academic domains is commonplace (Card, S. K, Citation2009; Donnelly-Hermosillo et al., Citation2020; Wainer, Citation1992). Over the last decade, shifting PBT to analogous CBT formats has become increasingly popular (Jeong, 2014). Reduced administration costs is one reason for the shift in popularity of CBT (Bennett et al., Citation2008; Broadfoot & Black, Citation2004; Clariana & Wallace, Citation2002). Not surprising, reducing costs has enabled publishing companies to increase profits. While the big business of assessment (Carmody, Citation2012) continues to grow (Russell et al., Citation2003) and political pressures surrounding assessment decisions intensify (Broadfoot & Black, Citation2004), researchers, educators, and test creators must protect students by ensuring assessment data used to admit and advance them accurately represent their abilities to think and reason.
Additional information
Funding
Notes on contributors

Stacy K. Boote
Dr. Stacy K. Boote is an Associate Professor of Elementary Mathematics Education at the University of North Florida. Her research focuses on using and assessing semiotic, mental, and physical models within STEM+C problem solving. She is Co-PI on Project InTERSECT, a multimillion dollar US DOE SEED Grant.
David N. Boote
Dr. David N. Boote is an Associate Professor of Learning Sciences and Educational Research at the University of Central Florida. His publications have focused mainly on mathematics education, science education, and doctoral education. He teaches qualitative and quantitative research methods.
Steven Williamson
Dr. Steven Williamson is a Professor of Strategic Management and directs both the MBA Program and the PAPER Institute at the University of North Florida. Much of Dr. Williamson’s research has involved the evolution of the paper industry and the replacement of paper via electronic media.
Notes
1. Throughout the K-12 curriculum, various academic organizations within the US have established graphing standards to support data collection and analysis across disciplines (National Council for Social Studies, Citation2010; National Governors Association Center for Best Practice & Council of Chief State School Officers, Citation2010; National Research Council, Citation2012; NGSS Lead States, Citation2013). Following secondary education, graph comprehension continues to be used to demonstrate integrated, systematic, and disciplinary-specific thinking (Hilbert & Jaffe, Citation2012; Meletiou-Mavrotheris & Lee, Citation2010).
2. SAT (originally Scholastic Aptitude Test and later the Scholastic Assessment Test), ACT (American College Testing), GRE (Graduate Record Exam), GMAT (Graduate Management Admissions Test), LSAT (Law School Admissions Test), and MCAT (Medical College Admissions Test).
3. Gift cards were funded by UNF’s Paper and Plastics Education Research (PAPER) Institute.
4. Two male MBA students contacted the first author after completing the initial survey. One of the two scheduled an interview appointment but did not show up, and the other could not find a convenient time to participate due to his work schedule. These two students were not counted in the total number of participants.
5. The GMAT total score is composed of Verbal and Quantitative exam sections. Total GMAT Scores range from 200 to 800. Two-thirds of test takers scored between 400 and 600.
6. The GRE has three sections: Verbal Reasoning, Quantitative Reasoning, and Analytical Writing. For the GRE scores reported here, Verbal Reasoning and Quantitative Reasoning are both scored from 130–170 in one-point increments. Combined GRE scores range from 260–340.
7. Data collected from the first 12 participants showed a large and statistically significant difference favoring performance on CBT compared to PBT, CBT, M = 2.08 (.67), and PBT, M = 1.25 (.87), t = 2.64, p = .01, 2-tailed, z = 2.32, p = .02, 2-tailed. The strength of this difference was evident in the effect size (d = 1.07). To control for a potential threat to internal validity caused by item order, the sequence of the two sets of questions, Set A, Set B (1–3, 4–6), was reversed, Set B, Set A (4–6, 1–3), for the next 12 participants. The final four participants received alternating versions of the test for a total of 14 participants receiving each order of the test. As the analysis for the research question showed, with the inclusion of these additional data, the finding became less statistically significant.
8. With the GMAT, test takers are given a laminated note board by administrators as needed (Hilbert & Jaffe, Citation2012).
References
- ACT. (2013). The ACT Sample Science Questions: Passage 4. http://www.actstudent.org/sampletest/science/sci_04.html
- Alexander, M. W., Bartlett, J. E., Truell, A. D., & Ouwenga, K. (2001). Testing in a computer technology course: An investigation of equivalency in performance between online and paper and pencil methods. Journal of Career and Technical Education, 18(1), 69–21. https://doi.org/https://doi.org/10.21061/jcte.v18i1.600
- Anakwe, B. (2008). Comparison of student performance in paper-based versus computer-based testing. Journal of Education for Business, 84(1), 13–17. https://doi.org/https://doi.org/10.3200/JOEB.84.1.13-17
- Bennett, R. E. (2015). The changing nature of educational assessment. Review of Research in Education, 39(1), 370–407. https://doi.org/https://doi.org/10.3102/0091732X14554179
- Bennett, R. E., Braswell, J., Oranje, A., Sandene, B., Kaplan, B., & Yan, F. (2008). Does it matter if I take my mathematics test on computer? A second empirical study of mode effects in NAEP. The Journal of Technology, Learning, and Assessment, 6(9), 1–37.
- Berg, C. A., & Boote, S. K. (2017). Format effects of empirically derived multiple-choice versus free-response instruments when assessing graphing abilities. International Journal of Science and Mathematics Education, 15(1), 19–38. https://doi.org/https://doi.org/10.1007/s10763-015-9678-6
- Berg, C. A., & Smith, P. (1994). Assessing students’ abilities to construct and interpret line graphs: Disparities between multiple-choice and free-response instruments. Science Education, 78(6), 527–554. https://doi.org/https://doi.org/10.1002/sce.3730780602
- Bertin, J. 1973. Semiologie Graphique. W. Berg & H. Wainer, 2nd. The Hague: Mouton–Gautier.
- Bertin, J. (1983). Semiology of graphics: Diagrams, networks, maps (W. J. Berg, Trans.). The University of Wisconsin Press, Ltd.
- Board, C. (2015). Test specifications for the redesigned SAT®.
- Boote, S. K. (2014). Assessing and understanding line graph interpretations using a scoring rubric of organized cited factors. Journal of Science Teacher Education, 25(3), 333–354. https://doi.org/https://doi.org/10.1007/s10972-012-9318-8
- Boote, S. K., & Boote, D. N. (2017). Leaping from discrete to continuous independent variables: Sixth graders’ science line graph interpretations. The Elementary School Journal, 117(3), 455–484. https://doi.org/https://doi.org/10.1086/690204
- Broadfoot, P., & Black, P. (2004). Redefining assessment? The first ten years of Assessment in Education. Assessment in Education: Principles, Policy & Practice, 11(1), 7–26.
- Brunet Marks, A., & Moss, S. A. (2016). What predicts law student success? A longitudinal study correlating law student applicant data and law school outcomes. Journal of Empirical Legal Studies, 13(2), 205–265. https://doi.org/https://doi.org/10.1111/jels.12114
- Buerger, S., Kroehne, U., & Goldhammer, F. (2016). The transition to computer-based testing in large-scale assessments: Investigating (partial) measurement invariance between modes. Psychological Test and Assessment Modeling, 58(4), 597–616.
- Card, S. K. (2009). Information visualization. In A. Sears & J. A. Jacko (Eds.), Human-computer interaction: Design issues, solutions, and applications (pp. 182–216). Taylor & Francis Group.
- Carmody, T. (2012). Why education publishing is big business. WIRED. https://www.wired.com/2012/01/why-education-publishing-is-big-business
- Carpenter, P. A., & Shah, P. (1998). A model of the perceptual and conceptual processes in graph comprehension. Journal of Experimental Psychology. Applied, 4(2), 75–100. https://doi.org/https://doi.org/10.1037/1076-898X.4.2.75
- Chen, J., & Perie, M. (2018). Comparability within Computer-Based Assessment: Does Screen Size Matter? Computers in the Schools, 35(4), 268–283. https://doi.org/https://doi.org/10.1080/07380569.2018.1531599
- Clariana, R. B., & Wallace, P. (2002). Paper–based versus computer–based assessment: Key factors associated with the test mode effect. British Journal of Educational Technology, 33(5), 593–602. https://doi.org/https://doi.org/10.1111/1467-8535.00294
- Creswell, J. W. (2014). Research design: Qualitative, quantitative, and mixed methods approaches. Sage Publications, Inc.
- Debeer, D., & Janssen, R. (2013). Modeling item‐position effects within an IRT framework. Journal of Educational Measurement, 50(2), 164–185. https://doi.org/https://doi.org/10.1111/jedm.12009
- DeLeeuw, K. E., & Mayer, R. E. (2008). A comparison of three measures of cognitive load: Evidence for separable measures of intrinsic, extraneous, and germane load. Journal of Educational Psychology, 100(1), 223–234. https://doi.org/https://doi.org/10.1037/0022-0663.100.1.223
- Dillon, A. (1992). Reading from paper versus screens: A critical review of the empirical literature. Ergonomics, 35(10), 1297–1326. https://doi.org/https://doi.org/10.1080/00140139208967394
- Donnelly-Hermosillo, D. F., Gerard, L. F., & Linn, M. C. (2020). Impact of graph technologies in K-12 science and mathematics education. Computers & Education, 146, 1–32. https://doi.org/https://doi.org/10.1016/j.compedu.2019.103748
- Draeger, R. (2009). Within-Subjects Design. In M. Allen (Ed.), The SAGE Encyclopedia of Communication Research Methods (pp. 1878–1880). Sage.
- Dreben, E. K., Fiske, S. T., & Hastie, R. (1979). The independence of evaluative and item information: Impression and recall order effects in behavior-based impression formation. Journal of Personality and Social Psychology, 37(10), 1758–1768. https://doi.org/https://doi.org/10.1037/0022-3514.37.10.1758
- ETS-GRE. (2018). GRE® General test: Quantitative reasoning question types. https://www.ets.org/gre/revised_general/about/content/quantitative_reasoning
- Friel, S. N., Curcio, F. R., & Bright, G. W. (2001). Making sense of graphs: Critical factors influencing comprehension and instructional implications. Journal for Research in Mathematics Education, 32(2), 124–158. https://doi.org/https://doi.org/10.2307/749671
- Gallagher, A., Bridgeman, B., & Cahalan, C. (2000). The effect of computer-based tests on racial/ethnic, gender, and language groups (GRE Board Professional Report No. 96–21P). Education Testing Service.
- Garas, S., & Hassan, M. (2018). Student performance on computer-based tests versus paper-based tests in introductory financial accountig: UAE evidence. Academy of Accounting and Financial Studies Journal, 22(2), 1–14.
- Goldberg, A. L., & Pedulla, J. J. (2002). Performance differences according to test mode and computer familiarity on a practice Graduate Record Exam. Educational and Psychological Measurement, 62(6), 1053–1067. https://doi.org/https://doi.org/10.1177/0013164402238092
- Graduate Management Admissions Council. (2012). GMAT Review (13th ed.). John Wiley & Sons, Inc.
- Greeno, J. G., & Hall, R. P. (1997). Practicing representation: Learning with and about representational forms. Phi Delta Kappan, 78(5), 361–367.
- Groth, R. E. (2007). Toward a conceptualization of statistical knowledge for teaching. Journal for Research in Mathematics Education, 38(5), 427–437.
- Hambleton, R. K., & Traub, R. E. (1974). The effects of item order on test performance and stress. The Journal of Experimental Education, 43(1), 40–46. https://doi.org/https://doi.org/10.1080/00220973.1974.10806302
- Heer, J., & Shneiderman, B. (2012). Interactive dynamics: A taxonomy of tools that support the fluent and flexible use of visualizations. Queue, 10(2), 1–26. https://doi.org/https://doi.org/10.1145/2133416.2146416
- Hegarty, M. (2011). The cognitive science of Visual‐Spatial displays: Implications for design. Topics in Cognitive Science, 3(3), 446–474. https://doi.org/https://doi.org/10.1111/j.1756-8765.2011.01150.x
- Herrington, J. D. (2010). MBA: Past, present and future. Academy of Educational Leadership Journal, 14(1), 63–76.
- Higgins, J., Russell, M., & Hoffmann, T. (2005). Examining the effect of computer-based passage presentation on reading test performance. The Journal of Technology, Learning, and Assessment, 3(4), 1–35.
- Hilbert, S., & Jaffe, E. D. (2012). Barron’s new GMAT: Graduate Management Admission Test (17th ed.). Barron’s Educational Series, Inc.
- Hohensinn, C., Kubinger, K. D., Reif, M., Holocher-Ertl, S., Khorramdel, L., & Frebort, M. (2008). Examining item-position effects in large-scale assessment using the linear logistic test model. Psychology Science Quarterly, 50(3), 391–402.
- Hutchins, E. (1995). Cognition in the wild. MIT Press.
- Hutchins, E. (2010). Cognitive ecology. Topics in Cognitive Science, 2(4), 705–715. https://doi.org/https://doi.org/10.1111/j.1756-8765.2010.01089.x
- Jang, J., Trickett, S. B., Schunn, C. D., & Trafton, J. G. (2012). Unpacking the temporal advantage of distributing complex visual displays. International Journal of Human-Computer Studies, 70(11), 812–827. https://doi.org/https://doi.org/10.1016/j.ijhcs.2012.07.003
- Kingston, N. M. (2009a). Comparability of computer- and paper-administered multiple-choice tests for K-12 populations: A synthesis. Applied Measurement in Education, 22(1), 22–37. https://doi.org/https://doi.org/10.1080/08957340802558326
- Kingston, N. M., & Dorans, N. J. (1984). Item location effects and their implications for IRT equating and adaptive testing. Applied Psychological Measurement, 8(2), 147–154. https://doi.org/https://doi.org/10.1177/014662168400800202
- Konold, C., Higgins, T., Russell, S. J., & Khalil, K. (2015). Data seen through different lenses. Educational Studies in Mathematics, 88(3), 305–325. https://doi.org/https://doi.org/10.1007/s10649-013-9529-8
- Kuncel, N. R., Credé, M., & Thomas, L. L. (2007). A meta-analysis of the predictive validity of the Graduate Management Admission Test (GMAT) and undergraduate grade point average (UGPA) for graduate student academic performance. Academy of Management Learning & Education, 6(1), 51–68. https://doi.org/https://doi.org/10.5465/amle.2007.24401702
- Kuo, C.-Y., & Wu, H.-K. (2013). Toward an integrated model for designing assessment systems: An analysis of the current status of computer-based assessments in science. Computers & Education, 68, 388–403. https://doi.org/https://doi.org/10.1016/j.compedu.2013.06.002
- Lai, K., Cabrera, J., Vitale, J. M., Madhok, J., Tinker, R., & Linn, M. C. (2016). Measuring graph comprehension, critique, and construction in science. Journal of Science Education and Technology, 25(4), 665–681. https://doi.org/https://doi.org/10.1007/s10956-016-9621-9
- Latour, B. (1986). Visualization and cognition: Thinking with eyes and hands. Knowledge and Society, 6(6), 1–40. http://hci.ucsd.edu/10/readings/Latour(1986).pdf
- Lead States, N. G. S. S. (2013). Next generation science standards: For states, by states. The National Academies Press.
- Lee, J., & Hopkins, L. (1985). The effects of training on computerized aptitude test performance and anxiety. Paper presented at the The Annual Meeting of the Eastern Psychological Association, Boston, MA.
- Lee, J., Moreno, K. E., & Sympson, J. B. (1986). The effects of mode of test administration on test performance. Educational and Psychological Measurement, 46(2), 467–474. https://doi.org/https://doi.org/10.1177/001316448604600224
- Leeson, H. V. (2006). The mode effect: A literature review of human and technological issues in computerized testing. International Journal of Testing, 6(1), 1–24. https://doi.org/https://doi.org/10.1207/s15327574ijt0601_1
- Lissitz, R. W., & Jiao, H. (Eds.). (2012). Computers and their impact on state assessments: Recent history and predictions for the future. Information Age Publishing, Inc.
- MacCann, R. S. (2006). The equivalence of online and traditional testing for different subpopulations and item types. British Journal of Educational Technology, 37(1), 79–91. https://doi.org/https://doi.org/10.1111/j.1467-8535.2005.00524.x
- Mangen, A., Walgermo, B. R., & Brønnick, K. (2013). Reading linear texts on paper versus computer screen: Effects on reading comprehension. International Journal of Educational Research, 58, 61–68. https://doi.org/https://doi.org/10.1016/j.ijer.2012.12.002
- Mazzeo, J., & Harvey, A. L. (1988). The equivalence of scores from conventional and automated educational and psychological tests: A review of literature. Educational Testing Service.
- Meletiou-Mavrotheris, M., & Lee, C. (2010). Investigating college-level introductory statistics students’ prior knowledge of graphing. Canadian Journal of Science, Mathematics and Technology Education, 10(4), 339–355. https://doi.org/https://doi.org/10.1080/14926156.2010.524964
- Mitchell, K., Lewis, R. S., Satterfield, J., & Hong, B. A. (2016). The new Medical College Admission Test: Implications for teaching psychology. American Psychologist, 71(2), 125–135. https://doi.org/https://doi.org/10.1037/a0039975
- National Council for Social Studies. (2010). National curriculum standards for social studies: A framework for teaching, learning, and assessment Retrieved from
- National Governors Association Center for Best Practice & Council of Chief State School Officers. (2010). Common Core State Standards.
- National Research Council. (2012). A framework for K-12 science education: Practices, crosscutting concepts, and core ideas. The National Academies Press.
- Noyes, J. M., Garland, K. J., & Robbins, E. (2004). Paper-based versus computer-based assessment—Is workload another test mode effect? British Journal of Educational Technology, 35(1), 111–113. https://doi.org/https://doi.org/10.1111/j.1467-8535.2004.00373.x
- Oh, I.-S., Schmidt, F. L., Shaffer, F. A., & Le, H. (2008). The Graduate Management Admission Test (GMAT) is even more valid than we thought: A new development in meta-analysis and its implications for the validity of the GMAT. Academy of Management Learning & Education, 7(4), 563–570. https://doi.org/https://doi.org/10.5465/amle.2008.35882196
- Paas, F., Van Gog, T., & Sweller, J. (2010). Cognitive load theory: New conceptualizations, specifications, and integrated research perspectives. Educational Psychology Review, 22(2), 123–138. https://doi.org/https://doi.org/10.1007/s10648-010-9133-8
- Padilla, L. M., Creem-Regehr, S. H., Hegarty, M., & Stefanucci, J. K. (2018). Decision making with visualizations: A cognitive framework across disciplines. Cognitive Research: Principles and Implications, 3(29), 1–25. https://doi.org/https://doi.org/10.1186/s41235-018-0120-9
- Parshall, C. G., & Kromrey, J. D. (1993). Computer testing versus paper-and-pencil testing: An analysis of examinee characteristics associated with mode effect. Paper presented at the Annual Meeting of the American Educational Research Association Atlanta, GA.
- Phage, I. B., Lemmer, M., & Hitge, M. (2017). Probing factors influencing students’ graph comprehension regarding four operations in kinematics graphs. African Journal of Research in Mathematics, Science and Technology Education, 21(2), 200–210. https://doi.org/https://doi.org/10.1080/18117295.2017.1333751
- Poggio, J., Glasnapp, D. R., Yang, X., & Poggio, A. J. (2005). A comparative evaluation of score results from computerized and paper & pencil mathematics testing in a large scale state assessment program. Journal of Technology, Learning, and Assessment, 3(6), 1–29.
- Rodriguez, M. C. (2013). Trends in graduate admissions measures. Paper presented at the BUROS Big Issues in Testing Conference, Lincoln, NE.
- Russell, M., Goldberg, A., & O’Connor, K. (2003). Computer-based testing and validity: A look back into the future. Assessment in Education: Principles, Policy & Practice, 10(3), 279–293.
- Sandene, B., Horkay, N., Bennett, R., Allen, N., Kaplan, B., & Oranje, A. (2005). Online assessment in mathematics and writing: Reports from NAEP technology-based assessment project. Retrieved from Washington, DC:
- Schoenfeld, A. H. (2008). Problem solving in the United States, 1970-2008: Research and theory, practice and politics. ZDM Mathematics Education, 39(5–6), 537–551. https://doi.org/https://doi.org/10.1007/s11858-007-0038-z
- Schroeders, U., & Wilhelm, O. (2011). Equivalence of reading and listening comprehension across test media. Educational and Psychological Measurement, 71(5), 849–869. https://doi.org/https://doi.org/10.1177/0013164410391468
- Shadish, W. R., Cook, T. D., & Campbell, D. T. (2002). Experimental and quasi-experimental designs for generalized causal inference. Houghton Mifflin.
- Shah, P., & Hoeffner, J. (2002). Review of graph comprehension research: Implications for instruction. Educational Psychology Review, 14(1), 47–69. https://doi.org/https://doi.org/10.1023/A:1013180410169
- Shah, P., Meyer, R. E., & Hegarty, M. (1999). Graphs as aids to knowledge construction: Signaling techniques for guiding the process of graph comprehension. Journal of Educational Psychology, 91(4), 690–702. https://doi.org/https://doi.org/10.1037/0022-0663.91.4.690
- Shaughnessy, J. M. (2007). Research on statistical learning and reasoning. In F. K. Lester (Ed.), Second Handbook of Research on Mathematics Teaching and Learning (Vol. 2, pp. 957–1010). Information Age Publishing.
- Singer, L. M., & Alexander, P. A. (2017). Reading on paper and digitally: What the past decades of empirical research reveal. Review of educational research, 87(6), 1007-1041.
- Strobel, B., Grund, S., & Lindner, M. A. (2018). Do seductive details do their damage in the context of graph comprehension? Insights from eye movements. Applied Cognitive Psychology, 33(1), 95–108. https://doi.org/https://doi.org/10.1002/acp.3491
- Sweller, J. (1988). Cognitive load during problem solving: Effects on learning. Cognitive Science, 12(2), 257–285. https://doi.org/https://doi.org/10.1207/s15516709cog1202_4
- Sweller, J., & Chandler, P. (1994). Why some material is difficult to learn. Cognition and Instruction, 12(3), 185–233. https://doi.org/https://doi.org/10.1207/s1532690xci1203_1
- Tufte, E. R. (2001). The visual display of quantitative information (2nd Ed. ed.). Graphics Press.
- Wainer, H. (1992). Understanding graphs and tables. Educational Researcher, 21(1), 14–23. https://doi.org/https://doi.org/10.3102/0013189X021001014
- Wao, J. O., Ries, R., Flood, I., Lavy, S., & Ozbek, M. E. (2016). Relationship between admission GRE scores and graduation GPA scores of construction management graduate students. International Journal of Construction Education and Research, 12(1), 37–53. https://doi.org/https://doi.org/10.1080/15578771.2015.1050562
- Watson, B. (2001). Key factors affecting conceptual gains from CAL material. British Journal of Education Technology, 32(587-593).