
Abstract
Assessing customers’ satisfaction with service quality has been a common practice that allows leaders and managers to improve service delivery to the customers in business studies. In education, the measurement of student satisfaction has received popularity and so does the satisfaction of teaching staff. Studies examining student teachers’ and tutors’ satisfaction with service quality particularly in teacher education are scant. The aims of this study are threefold: to determine the level of support that the Teacher Education Support Project (TESP) provides to strengthen teacher education in Tanzania; to explore the student teachers’ and tutors’ perceptions and satisfaction with the facilities and overall college environment in public TCs and to determine the factors explaining student teachers’ and tutors’ satisfaction with service quality. A survey study involving 2772 student teachers and 302 tutors from all 35 public TCs was conducted in the Tanzania Mainland. The study findings revealed that the TESP has provided significant support of textual and non-textual facilities and learning materials in all public TCs. Besides, student teachers’ satisfaction is most strongly predicted by in-class teaching aids and practical materials albeit other factors such as library and ICT facilities had a considerable prediction. Whereas tutors’ teaching strategies made a significant contribution in regression analysis to explain student teachers’ satisfaction Tutors’ satisfaction was most strongly explained by ICT-supported teaching environments followed up by teaching aids and science facilities. The study concludes by proposing that the measurement of student teachers’ and tutors’ satisfaction be approached and improved separately. Implications for these findings are discussed.
PUBLIC INTEREST STATEMENT
Strengthening teacher education is critical in ensuring that new teachers are skilled, masterful, and well-prepared to enhance student learning. It aims at keeping teachers abreast of what it means and takes to facilitate meaningful learning. The responsibility of strengthening teacher education calls for a collaborative commitment of diverse stakeholders, including government institutions and international partners. For years, Tanzania and development partners have taken strategic efforts to improve its teacher education. This is exemplified by the ongoing implementation of the Teacher Education Support Project (TESP). TESP, funded by the Government of Canada, is designed to strengthen the 35 government teacher colleges. It is from this backdrop that the researchers became interested in assessing the perceptions of tutors and student-teachers on the service quality of TESP. In particular, this paper draws from the project to report the level of satisfaction of tutors and student-teachers with college facilities and the learning environment.
1. Introduction
The status of teacher education in Tanzania has long been challenged by several factors, including limited teaching and learning facilities and materials particularly for science teacher programs (Kafyulilo et al., Citation2015). For decades, the Government of Tanzania in collaboration with educational stakeholders and development partners has committed efforts to improve teacher education with the intention of ensuring preparation of effective teachers to teach in primary and secondary schools. The efforts are exemplified by the implementation of strategic projects in the education sector. One of such projects is the Teacher Education in Mathematics and Science (TEAMS) implemented from 1996 to 2004 (Ottevanger et al., Citation2005). The project, funded by the Dutch public, focused on improving the capacity of science and mathematics teachers in both pedagogy and content knowledge as well as in leadership skill development.
The Education II Project, implemented from 1993 to 2006, focused on strengthening the training of teachers (Semali & Mehta, Citation2012). The project was observed to have improved teachers’ professional growth. Again, the Enabling Science Learning (ENSCIENCE) project, financed by the Swiss Federal Institute for Technology, embarked on improving science teaching in rural Tanzania from 2011 to 2021 (Mamlok-naaman, Citation2015). Likewise, the Hisabati ni Maisha project (Mathematics is Life/Living), was implemented through the support of the Government of Canada, to enhance the capacity for mathematics teaching in rural schools (Swai & Glanfield, Citation2018).
Despite all such efforts, teacher education has not realized its expected outcomes that are geared towards preparing an effective teaching force (Tarmo, Citation2016). And this has attracted the Government of Tanzania and development partners to continue to support teacher education in Tanzania. Recently, the Government of Canada through the Global Affairs Canada (GAC) and the Government of Tanzania launched a development project, namely the Teacher Education Support Project (TESP) to strengthen teacher education in Tanzania. The project focuses on creating a conducive environment for teaching and learning in all public TCs in Tanzania. To achieve its broad objective, TESP provides teacher colleges (TCs) with facilities, materials, and equipment as well as improving college infrastructure, new construction and rehabilitation of science and ICT laboratories, libraries, classrooms, and staff houses, and so on. However, since its inception, a comprehensive, systematic evaluation has not been conducted to assess the satisfaction of beneficiaries with the college facilities and learning environment following the intervention. It is against this backdrop, this article reports the level of satisfaction of student teachers and tutors with teaching and learning facilities and classroom environment following the three-year implementation of TESP in TCs.
More particularly, this article sought to identify the level of support that TESP has provided to improve TE in Tanzania; to determine the level of student teachers’ and tutors’ perceptions and satisfaction with the teaching and learning facilities in their colleges; and to establish the determining factors that strongly explain student teachers’ and tutors’ satisfaction with college facilities and environment. The recommendations are drawn to inform project implementers, beneficiaries, and teacher education stakeholders.
2. Literature review
2.1. Contextualizing service quality and satisfaction with an organizational setting
Service quality has been defined from different perspectives by different authors (Abdullah, Citation2006b). For example, Parasuraman et al. (Citation1985) consider service quality as an outcome of perceptions resulting from consumers’ comparison between the expected and the actual service performance. Jaiswal (Citation2008), on the other hand, sees service quality as not only the determinant of the end product but also an integral component of the production and provision process, and therefore its measurement requires the involvement of consumer’s perception about the product used. Broadly, service quality can be viewed as an indicator of an individual’s judgment about the product received/used regarding the extent to which the expected outcomes have been realized.
Although service quality has been widely explored in business studies (e.g., Jaiswal, Citation2008; Parasuraman et al., Citation1985), empirical and theoretical evidence in educational institutions has as well been documented (Danjuma et al., Citation2018; Steppacher et al., Citation2021; Teeroovengadum et al., Citation2016). In business-oriented organizations, it is the task of each manager to ensure the organization meets customers’ expectations (Icli & Anil, Citation2014). Similarly, educational organizations need to fulfill the needs and expectations of students and teaching staff as a way towards realizing the expectations of students and teachers (Abbas, Citation2020; Lodesso et al., Citation2019). It is necessary that educational organizations determine the quality of their service as perceived by students and educators. Notwithstanding, scholars have maintained that service quality and satisfaction are distinct but related constructs, therefore, it is critical for them to be measured and treated separately to establish service performance as perceived by beneficiaries and actors (Dabholkar et al., Citation2000).
2.2. Theoretical and empirical contexts of satisfaction with service quality
Understanding what satisfaction implies depends on several factors and the context in which it is defined. In a business context, Churchill and Surprenant (Citation1982) define satisfaction as a major outcome originating from a marketing process confined in the context of a customer’s change in attitude after purchasing and using a given business product. Thus, satisfaction indicates a connection between the product purchased and the profits generated after meeting the client’s needs and wants. In the educational context, albeit satisfaction has become a potential component in determining stakeholders’ perceptions of service quality, it is still a complex phenomenon to define in its entirety (Lazibat et al., Citation2014). Broadly, Weerasinghe et al. (Citation2017) regard satisfaction as an evaluative outcome indicating a short-term attitude of educational experiences, service delivery, and available facilities.
Although the measurement of satisfaction with service quality has been widely documented in the business-oriented contexts (Parasuraman et al., Citation1985), it has also received considerable attention in other fields. In particular, satisfaction measurement has been reported in other disciplines such as health (Rad & Yarmohammadian, Citation2006), environmental conditions (Pelletier et al., Citation1996), in sports and games (Liu et al., Citation2017), and in the engineering (Bielefeldt & Canney, Citation2019) just to mention few. The popularity of the measurement of satisfaction level reveals the potential of using the measurement to determine the quality of the delivered service (Chandra, Hafni, Chandra, Purwati, & Chandra, Citation2019).
Based on such potentiality, student and staff satisfaction with service quality have been investigated broadly in the education sector with a particular focus on satisfaction with instructional competency, teaching and learning materials, as well as organizational management and leadership among others (Geier, Citation2021; Kärnä & Julin, Citation2015; Wilkins & Balakrishnan, Citation2013). The measurement of student satisfaction is well-documented in Higher Education Institutions (HEIs) such as universities whereas there is a paucity of studies in TCs particularly in developing countries, Tanzania included. Assessing students’ satisfaction in educational institutions has the potential to add value to the participatory approach of decision-making before deciding on the required adjustments for improving service delivery (Razinkina et al., Citation2018). It also provides an opportunity for the respective organs to evaluate the ways to fulfill the expectations and needs of beneficiaries such as students, staff, and other education stakeholders (Liu et al., Citation2017).
Satisfaction in the educational context could be determined by two major aspects; personal and organizational factors (Appleton-Knapp & Krentler, Citation2006). Personal factors include preferred learning styles, demographic features such as age and gender, temperament as well as learners’ academic performance reasonably identified as potential predictors of learners’ satisfaction (Appleton-Knapp & Krentler, Citation2006; Desai et al., Citation2001). On the other hand, organizational factors include but are not limited to; leadership skills, access to teaching and learning facilities, teachers/tutors’ instructional styles, classroom environment, and professional guidance and timely feedback to learners (McCollough & Gremler, Citation1999). Both personal and organizational factors may pose different influences on either student or staff satisfaction levels, and they can be approached differently as well.
2.3. Determinants of satisfaction with service quality
Various studies have been conducted to examine satisfaction with service quality in education and different determinants have been documented in different parts of the world including Europe (Herdlein & Zurner, Citation2015; Sofroniou et al., Citation2020; Wach, Karbach, Ruffing, Brünken, & Spinath, Citation2016), Asia (Al-Sheeb et al., Citation2018; Butt & Rehman, Citation2010), North America (Geier, Citation2021), South America (Martínez-Flisser et al., Citation2020) and Africa (Lodesso et al., Citation2019) among other cross-cultural studies. In the educational context, however, considerable attention has largely been put to assess student satisfaction with factors related to instructors’ competency and teaching methods whereas institutional influence related to teaching and learning facilities as well as institutional environments have not been systematically researched (Rahman et al., Citation2020). Besides, little is known about the combined satisfaction of students and staff in educational institutions, particularly in TCs.
Noticeably, institutional factors such as teaching and learning facilities have been identified as the key determinants of students’ learning outcomes and instructors’ means of creative and innovative planning for teaching (Mallika Appuhamilage & Torii, Citation2019). For example, a study by McLaughlin and Faulkner (Citation2012) in an Italian HEI revealed that facilities influenced students’ learning and teaching styles. Furthermore, McLaughlin and Faulkner found that students placed substantial emphasis on the available technological opportunities that in turn influenced their level of interaction and technology exchange among themselves. This was also true for Wilkins and Balakrishnan (Citation2013) who observed that the quality of instructors and that of available facilities, and effective use of technology influenced students’ high level of satisfaction with their learning institution in the United Arab Emirates (UAE). Conversely, Hanssen and Solvoll (Citation2015) found that students’ access to computers had no impact on their satisfaction at a Norwegian University. On the other hand, El Ansari (Citation2002) observed that the age of students influenced their satisfaction levels with older students being more satisfied than young ones. Besides, El Ansari revealed that there was no statistical gender difference in satisfaction with learning facilities in England.
On the other hand, Kärnä and Julin (Citation2015) observed that contextual factors such as conducive learning environment and availability of laboratory facilities form the basis for students’ and teacher’s satisfaction with the service quality at the institutional level. Broadly, considerable empirical evidence supports the existence of the relationship between service quality and students and tutors’ satisfaction. Yet, based on the existing literature, it remains inconclusive on the factors mediating one’s satisfaction level with the quality of facilities and materials used to support teaching and learning. Thus, cross-cultural accumulation of evidence is still of useful contribution particularly from regions that are comparatively understudied such as Africa and Tanzania in particular. The question of how well service quality and satisfaction might be appropriately measured is however still a matter of discussion as presented next.
2.4. The measurement of satisfaction with service quality
Different instruments have been developed and used to measure the service quality in organizations particularly by the means of determining satisfaction of consumers with services provided. Despite a range of instruments used so far, the service quality model (SERVQUAL) is the most widely used instrument (Cronin & Taylor, Citation1994). The SERVQUAL is a five-dimension model that assesses satisfaction with service quality based on responsiveness, reliability, empathy, tangibles, and assurance (Parasuraman et al., Citation1985). However, criticism has been raised on its limited validity and reliability measures that necessitated formulation of service performance (SERVPERF) model to fill this gap by focusing on perceptions of service quality as an attitudinal construct and reduced the number of items by 50% from 44 of SERVQUAL to 22 (Cronin & Taylor, Citation1992). Subsequently, Abdullah (Citation2006b) proposed the higher performance-HEdPERF model as a new and the most appropriate scale for measuring service quality in the higher education sector. Nevertheless, a recent review by Silva et al. (Citation2017) revealed that SERVQUAL and SERVPERF had more substantive literature support for measuring service quality than the HEdPERF model.
Correspondingly, Steppacher et al. (Citation2021) developed a new scale for measuring service quality in education as an attribute-based framework (HEADSQUAL). Yet, the scale is specific to service quality related to administrative services. Consequently, a more comprehensive instrument has been developed to measure higher education service quality (HEISQUAL) by including dimensions of safety and security as well as students’ skills development that were previously excluded in other scales (Abbas, Citation2020). Likewise, Teeroovengadum et al. (Citation2016) designed a tool for quality assessment in higher education named the hierarchical model (HESQUAL). But, the length of the HESQUAL model with 48 items may not be friendly for both completion rate and time-saving. Then again, Schijns (Citation2021) designed and validated a measure of students’ satisfaction and ability to give recommendations for service quality of online learning coined as National Student Enquiry (NSE). Notwithstanding, the scale fits more appropriately for service offered through an online platform than a blended system or a face-to-face delivery model.
Comparative analyses have provided substantial evidence suggesting variations of models in measuring satisfaction with service quality at different organizational levels (Rodrigues et al., Citation2011). For instance, Abdullah (Citation2006a) analyzed the relative efficacy of three models and concluded that the HEdPERF model provides the best measurement outcomes in the education sector. Correspondingly, Brochado (Citation2009) compared five models and concluded that the SERVPERF and HEdPERF models offer the appropriate measurement attributes compared with others. In contrast, Danjuma et al. (Citation2018) compared the three models; SERVQUAL, SERVPERF, and HEDPERF on their ability in measuring the service quality in HEIs. They concluded that the SERVQUAL model is the most robust scale as it provides more flexibility than others due to its diagnostic ability that gives decision-makers the ability to make service improvements on the dimensions rated by service consumers. It is worth noting that the question of which model provides the best measurement outcomes remains debatable in the existing literature, implying that more culturally specific scales are needed to serve a potential role.
Given the above-presented observations, it makes sense to contextualize a particular model with which the nature and purpose of the study fit accordingly. In the context of the present study, we employed Kärnä and Julin’s (Citation2015) framework for measuring students’ and teachers’ satisfaction with teaching and learning facilities and environment in TCs. Tested in Finland, the model assesses the factors related to facilities and facility services that are stronger determinants of student and staff satisfaction at the institutional level. Empirically, the initial findings of Kärnä and Julin revealed that student and teachers’ satisfaction is affected differently, and the availability of teaching and laboratory facilities play the most mediatory role to influence satisfaction levels. It should also be noted that TCs in Tanzania are not regarded as higher learning institutions as they are not registered by the Tanzania Commission for Universities (TCU). Likewise, some of the recruited student teachers in TCs are lower secondary school leavers with no entry/equivalent qualifications required for HEIs in Tanzania. Therefore, specific tools for this study context were more appropriate than using the existing tools that have been tested elsewhere in HEIs.
Contextualized in the present study, facilities are defined as science and ICT facilities, teaching aids and practical materials as well as textbooks and other reference and learning materials. We use the term student teachers to refer to learners in TCs who are pursuing different teacher education courses before becoming professional teachers. On the other hand, we refer to tutors to mean instructors in TCs who guide student teachers in their routine learning activities in Tanzania. We believe that the findings from this study will provide insights on the key issues that require considerable attention towards improving service delivery on the teaching and learning facilities in TCs and enhancing the sustainability of teacher education projects in Tanzania and around the world.
3. Methodology
3.1. Participants
Data were collected from all the 35 public TCs located in different parts of Tanzania. Of the 17,600 student teachers enrolled in all the public TCs, 3500 were randomly selected to complete the survey out of whom 2772 or 79.2% (1342 boys, 1430 girls) completed the questionnaire. Then again, 400 of 1200 tutors were selected to complete the tutor questionnaire and participate in the focus group discussions (FGDs). Of the 400 tutors, 302 (75.5%) of them (186 males, 116 females) returned the correctly filled questionnaires. Tutors and student teachers were preferentially considered since they are direct beneficiaries of the project and are considered to have relevant information about the impact of the project on creating a teaching and learning environment in TCs. The purpose of the study was communicated in advance to research participants. They were also informed that their responses would not be treated as wrong or right answers. Being realistic in responding to research items was highly encouraged by researchers during the data collection to avoid socially desirable responses (SDR) from the participants.
3.2. Materials
Quantitative and qualitative data were collected from both primary and secondary sources of information. Specifically, the primary information was gathered directly from the field using systematically designed tools for both qualitative and quantitative data. In particular, quantitative data was collected using designed questionnaires and direct classroom observations. Sixteen items in the questionnaires were developed, modified, and tested before administering them to the participants. Four aspects constituted the questionnaires, including access to and use of library facilities, access to and use of ICT facilities, the effectiveness of teaching methods as well as availability and use of teaching aids and science facilities. Each aspect was measured by three items plus one overall satisfaction item in each case. As such, four items measured overall satisfaction whereas the other 12 items measured respondents’ perceptions of access, use, and effectiveness of the supplied facilities and related service quality. All the items were rated on a 5-point Likert scale from 1 to 5. Whereas qualitative data from primary sources was gathered through FGDs and classroom observations, document reviews supplemented the qualitative data from secondary sources that included reviews of the project and the government reports. The use of multiple tools in data collection aimed at maximizing authenticity of data through the triangulation process (Pallant, Citation2016). It should be noted, however, that both qualitative and quantitative data was collected together in a single point at a time (Creswell & Plano Clark, Citation2018).
3.3. Data analysis
Data from questionnaires was screened, coded, and entered into Statistical Product and Service Solutions (SPSS, version 25). Statistical analyses were conducted to test the normality of data, outliers, validity, and reliability whereas comparative analysis of groups was conducted using an independent samples t-test. Before examining the predictive power of predictor variables over-dependent ones, Principal Component Analysis (PCA) was conducted for dimensionality testing and item reduction. The Kaiser-Mayer-Olkin of Sampling adequacy and Bartlett’s test of sphericity were computed for testing compliance of data to the assumptions of the PCA. Regression analysis was used to assess the predictive power of predictors and its related assumptions were thoroughly examined and presented in the results section. On the other hand, qualitative data was transcribed from recorded audios and document reviews in which similar themes were grouped and presented in form of quotations. Quantitative and qualitative data were analyzed separately but they were merged during the presentation and discussion of the study findings.
4. Results
4.1. The extent to which TESP has supported public TCs
Document reviews from the TESP Annual Report (2020/21) and the review of documents from the Ministry of Education, Science and Technology (MoEST) Procurement Management Unit provided data on facilities and other teaching and learning materials procured and supplied to public TCs. The findings revealed that TESP has provided substantial support to TCs, ranging from supplying science facilities to science-offering colleges, supplying ICT facilities, text-and reference books and materials as well as teaching and learning resources to all public TCs in Tanzania Mainland
Ten public TCs—Mpwapwa, Monduli, Butimba, Songea, Korogwe, Klerruu, Morogoro, Tabora, Kasulu, and Tukuyu—received science facilities including teaching/learning models, chemical reagents, and apparatuses for conducting science experiments. Subsequently, 1120 desk computers, 1120 Uninterrupted Power Supply (UPS), 186 projectors, 113 laptops, and 35 duplicating machines were procured and supplied to all TCs. Equally, 27,390 reference books with 470 different subject titles, and 593 teaching and learning aids were provided to TCs. The supply of books has reduced student teachers to book ratio from 6:1 (when the project started) to 2:1 (during this study) whereas the supply of computers has reduced student-teachers to functional computers ratio from 21:1 (baseline data) to 2:1 (during this study). The review of the project reports indicates that overall levels of satisfaction of tutors with facilities were 1.9, 2.6, and 2.9 for ICT, library, and teaching aids as well as science facilities, respectively. Student teachers’ satisfaction levels were not assessed at the initial stage of the project.
4.2. Appropriateness of data to the analytic models for measuring perceptions and satisfaction
Before conducting the PCA, data was scrutinized for accuracy and coherence with the regression analysis assumptions and with the violation of assumptions to normality test. In particular, the KMO and Bartlett’s Test of Sphericity was computed to assess the appropriateness of data with the sample size used. The results indicated that the sample size used was adequate for both student teachers (KMO = .891, Sig. = p< .0001, df = 120, and Chi-Square(r2) = 21,004.365) and tutors (KMO = .846, Sig. = p< .0001, df = 66, and Chi-Square(x2) = 3129.36). Therefore, data was appropriate for conducting PCA for dimensionality tests and item reduction analysis (see, Table ).
Table 1. Principal component analysis for student teachers (N = 2772)
The PCA was conducted stepwise. At the initial stage, the PCA was computed to assess the number of dimensions and reliable items to retain for subsequent analyses. At this stage, the minimum item loading value was set at 0.4 as recommended by Pallant (Citation2016) whereas the cutoff eigenvalue was set at 1 and Monte Carlo parallel analysis was conducted to compare the calculated and simulated eigenvalues. The first stage was conducted with an unrotated factor solution. Moreover, the second stage involved an extraction of the number of factors as generated in the first stage. In the preliminary phase of the second stage, the analysis was conducted using direct Oblimin/oblique rotation for correlated factors followed by varimax rotation for uncorrelated factors.
The PCA for student teachers indicated that the scale used has four uncorrelated dimensions after the initial analysis revealed that the four factors were not highly correlated, and ranged from r= .326 to r= .448. For item factors to be highly correlated, the correlation coefficient should be; r = ≥ .5 (Tabachnick & Fidell, Citation2007). Hence, the varimax rotation was considered appropriate to extract the four separated dimensions with each item loading heavily on its component (Table ). Cronbach’s alpha of internal consistency reliability ranged from α = .808 to 868, implying that the items in each dimension measured related constructs (Nunnaly, Citation1978). Likewise, Corrected Item-Total Correlation (CITC) for each item was greater than the cut-off-point of .30 signifying that all the items were highly reliable to be retained for subsequent analyses (Pallant, Citation2016).
On the other hand, the PCA for tutors extracted three dimensions suggesting that two of the factors were highly correlated therefore they were combined and measured as a single dimension. Consequently, items related to teaching methods and ICT were merged to form a single dimension referred to hereinafter as ICT-supported teaching environment (ISTE). Other dimensions included teaching aids and science facilities (TASF), and textbooks and reference materials (TRM) in the TC library. Nevertheless, two items from the TRM were deleted to improve reliability from α = .512 to a = .817. Therefore, the scale used for tutors is a three-dimensional scale with uncorrelated factors of ISTE, TASF, and TRF (Table ).
Table 2. Principal component analysis for tutors’ questionnaire (N = 302)
Furthermore, examining the violation of the multicollinearity assumption before regression analysis was conducted for both student teachers and tutors. Analysis for student teachers’ questionnaire indicated that all the independent variables (IV) had some significant relationships with the dependent variable (DV). As expected, IV was not highly correlated, implying that there was no serious violation of multicollinearity assumptions. According to Tabachnick and Fidell (Citation2007), highly correlated variables (r = ≥.7) should not be included in the same analytic model.
For student teachers, inter-correlations between the IVs ranged from r= .326 to r= .448 suggesting that all the IVs were appropriate for being included within the same analytic model. Equally, all the tolerance values were greater than 0.10, implying that multiple correlations with other variables were small (Table ). In the same vein, the Variance Inflation Factor (VIF) values were less than 10, confirming that there were no serious violations of the multicollinearity assumptions with the present data (Pallant, Citation2016). The same was also evident for tutors’ questionnaire after combining the highly correlated factors into a single dimension. As such, regression analysis was appropriate for both student teachers’ and tutors’ questionnaires.
Table 3. The explanatory power of each independent variable over respondents’ overall satisfaction
Normality test was assessed through the probability residual plots and it indicated that our data was reasonably normally distributed as the residual plots indicated a reasonable diagonal straight line from the bottom left to top right proposing that there were no serious deviations from normality (Figure for student teachers and Appendix 2 for tutors). This was also supported by scatterplots, indicating that scores were scattered along with the rectangular shape, particularly around the zero point. Standardized residuals were inspected for detecting outliers. As indicated in Appendix 1, there was no considerable number of outliers to affect the proposed analysis for both student teachers and tutors.
Figure 1. Probability plot to show the normality of data for student teachers.
Broadly, the present data were both valid and reliable for further analysis particularly with parametric analytic pathways as there were no serious violations of the assumptions for parametric tests. Besides, data was reasonably normally distributed and the sample size was appropriate and adequate for conducting the proposed model of analysis. Parametric tests were also conducted for comparing demographic features of respondents. In particular, independent samples t-tests were conducted to assess if respondents differed on gender basis in their perceptions and satisfaction with the facilities and college environment. The findings are presented in .
4.3. Student teachers’ perceptions and satisfaction with the college facilities and learning environment
The study findings revealed that student teachers perceived college teaching and learning facilities to have improved over the past two years (when TESP started). Specifically, student teachers’ average responses ranged from 3.4 (access to and availability of ICT facilities) to 3.9 (effectiveness of tutors’ pedagogical strategies) on a five-point Likert scale. Generally, students’ perceptions indicated relatively lower satisfaction with ICT and in-class teaching aids and science facilities whereas they expressed more satisfaction with tutors’ instructional strategies than access to and use of college facilities (Table ).
Table 4. Student teachers’ perceptions and satisfaction with science and ICT facilities
Although there was a statistically significant difference between male and female student teachers regarding access to and use of library facilities, the magnitude of the difference was very small (eta squared (η2) = 0.0023 or 0.23%) to account for gender variation in responses. This implies that about 99.8% of the variance could be attributed to other factors different from gender. It can, therefore, be concluded that there were no statistically significant differences in how student teachers perceived service quality of college learning facilities as well as their overall satisfaction with the college learning environment.
Student teachers were also compared based on their subjects (sciences and arts/social sciences) using cumulative satisfaction levels of the measured variables. The magnitude of the differences was very small on all of the measured variables ranging from η2 = .000054 (satisfaction with ICT) to η2 = .011 (tutors’ instructional methods) as they also indicated marginal mean variations. This suggests that the values that student teachers attach to the project support do not vary considerably among the student teachers (see Appendix 3).
4.4. Tutors’ perceptions and satisfaction with the college facilities and teaching environment
Tutors’ perceptions revealed that access to and use of textbooks and other reference materials have considerably improved in TCs over the past two years. The average response for the access and availability of textbooks and reference materials was the same for male and female tutors (i.e., male = 4.0, SD = 0.48; female = 4.0, SD = 0.44, p= .365). This was also true for the perceived use of library facilities for both male and female tutors (male: M= 4.0, SD = 0.51; female: M= 4.0, SD = 0.51, p= .793). Statistically, male and female tutors did not differ significantly in their perceptions regarding college facilities and overall satisfaction with the college teaching environment (Table ).
Table 5. Tutors’ perceptions and satisfaction with science and ICT facilities
Furthermore, there was a significant difference between tutors in sciences and social sciences in their satisfaction with TASF (science M = 15.5, SD = 2.03; arts M = 14.7, SD = 2.70, p = .004) and ISTE (science M = 20.7, SD = 8.48; arts M = 24.2, SD = 2.99, p < .0005). Nonetheless, the magnitude of the difference was small for TASF (η2 = .025), implying that the difference in science and art tutors could be explained 2.5% whereas for ISTE the magnitude of the difference was moderate (η2 = .06), suggesting that only 6% could be attributed to tutors being in science or social science discipline, leaving nearly 94% of the variance in tutors’ satisfaction explained by other factors. Generally, satisfaction between tutors and student teachers on the service delivered by the project does not seem to be influenced by being in either science or social science discipline. This indicates that all the project beneficiaries have nearly equal perception regarding the project support (see Appendix 4).
Broadly, the tutors’ findings were in agreement with those of student teachers as they both perceived college facilities and the effectiveness of teaching methods to have been considerably improved. Equally, they both expressed that they were, above average, satisfied with college facilities and effectiveness of teaching strategies albeit student teachers’ overall satisfaction was relatively lower than that of their tutors (see, Tables ). On average, they both rated ICT facilities relatively lower than other college services delivered. The slight variation observed between student teachers and tutors could be partly due to differences in their contextual variation in access to teaching and learning materials in colleges. It seems that tutors had more access to the college facilities than student teachers as revealed in the FGDs. During FGDs, participants revealed that the frequency of use of ICT materials and books has considerably improved when compared to what was the case in the past two years as two of the participants pointed out;
… initially, the preparation of lessons was conducted manually where I used handwritten notes and lesson plans. Currently, this practice has changed as the preparation of lessons is done through computers and the setting of exams is done digitally. Additionally, the availability of duplicating machines has enabled us to easily print out and photocopy our exams using a short time compared to previous experience … (Tutor’s response during the FGD, June 2021).
… although the books are still inadequate, especially textbooks, the supply of new books by this project (TESP) has enabled me and other tutors to rely on books when preparing and executing the lesson for students. Available books in the library can be borrowed by tutors when preparing a lesson or implementing the same to student teachers … (Tutor’s response during the FGD, June 2021).
Subsequently, participants were further explicit that the use of books and ICT facilities in public TCs has been improved following TESP intervention as two student teachers stressed;
… the use of projectors by our tutors has made it possible for us (student teachers) to take a close look at the materials presented during the classroom instruction. It makes it easier to follow up an audio-visual presentation as both video and still pictures can be combined in a single presentation. Although not all tutors are using projectors all the time, it is quite impressive to find the class friendly for us (student teachers) to grasp the subject content … (student teacher’s view during the FGDs, June 2021).
… the computers that have been brought, though not sufficient, have helped us to have practical experience of how a computer assisted teaching and learning can be used. For example, we have been taught how to analyze students’ results and grade students. This is different from when computers were only available in the library and computer courses were only taught theoretically … (student teacher’s view during the FGDs, June 2021).
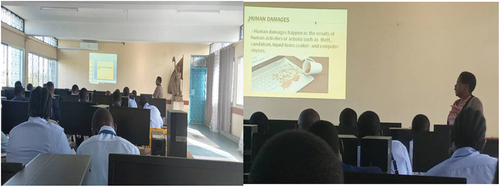
The latter statement is consistent with what was learned during classroom observations conducted during the study. We observed some of the tutors using projectors, computers, and other ICT-supported means to enhance student teacher learning in lessons. Below are some of the selected images captured from direct classroom facilitation by tutors (See ;
Figure 2. Use of ICT supported facilities in teaching in TCsSource: Field data (June 2021).
4.5. Factors affecting student teachers’ overall satisfaction with the college environment
Standard regression analysis was conducted to examine which predictor(s) had the strongest explanatory power for student teachers’ overall satisfaction. Of the four predictors; in-class teaching aids and learning facilities contributed most strongly to the model (Beta = .313, p< .0005) implying that 31.3% of the variance was explained by this variable. It is worth noting, however, that all other predictors had significant contributions to the model albeit library facilities had the lowest but significant (Beta = .199, p< .0005) explanatory power (see, Table ). The R square for this model was .612, suggesting that 61.2% of the variance in the overall student teachers’ satisfaction could be explained by the measured IVs. Thus, the correlation between the model and student teachers’ overall satisfaction was statistically significant, and that the model with IVs fits the data more accurately than the one without independent variables.
4.6. Factors affecting tutors’ overall satisfaction
As with student teachers, regression analysis was computed for tutors to determine IVs with significant explanatory powers for tutors’ overall satisfaction with the service quality of supplied materials in TCs and overall college environment. As noted earlier, three factors as extracted in the PCA; ISTE, TASF, and TRM were examined. The analysis revealed that ISTE contributed more strongly (Beta = .852, p< .0005) than TASF (Beta = .166, p< .0005). On the contrary, TRM did not make a statistically significant contribution to the model. The ANOVA statistics showed that the probability value was significant (p< .0005) and the F-test provides a better fit to the data than the one with no IVs. Overall evaluation of the model suggests that it fits more accurately to the data (R2 = .799), denoting that the model explains 79.9% of the variance in tutors ‘overall satisfaction (see, Table ).
4.7. Overall assessment of student teachers and tutors’ satisfaction
The evaluation of the model denotes that student teachers’ overall satisfaction can be explained by four factors. These factors can be named in order of their importance as in-class teaching and learning materials, tutors’ pedagogical strategies, access, and availability of ICT materials as well as access to and use of library resources particularly textbooks and other reference materials. It is interesting to note that all these factors have contributed to the model statistically significantly. On the other hand, tutors’ satisfaction is more strongly mediated by instructional strategies coupled with ICT facilities. It is also explained by teaching aids and science facilities whereas textbooks and reference materials were not significantly predicting tutors’ overall satisfaction. Although student teachers and tutors could be exposed to the same environment, their satisfaction may not necessarily be affected by the same factors. Thus, these findings suggest different but related strategies to improve the satisfaction of student teachers and tutors in public TCs.
5. Discussion of the findings
This study aimed at assessing; first, the extent of support that the TESP has provided in upgrading teacher education in public TCs in Tanzania. Second, to examine the level of satisfaction of student teachers and tutors with the college facilities and overall teaching and learning environment. Finally, to determine factors mediating satisfaction of student teachers and tutors from which the authors draw recommendations that may help to provide insightful contribution to improve the implementation of the ongoing project and shed light to enhance the sustainability of the project activities after the project life.
The study findings revealed that TESP has enabled public TCs to improve their teaching and learning environment for effective teacher preparation. This support includes access to text and reference books, supply of science facilities as well as provision of ICT facilities and materials. Both respondents expressed considerable improvement and satisfaction with the support that the project has provided so far compared with the baseline data. The findings suggest that the project has provided significant service quality to improve teacher education in Tanzania as perceived by both student teachers and tutors. Therefore, these findings imply that more effort is needed to sustain the improvement situation contributed by the project. It also worth noting that there was marginal difference in the overall satisfaction level between tutors based in science TCs against those in social sciences. Partly, small variation could be explained by mixing of teaching aids and science facilities when collecting data or because both science and social sciences give relatively equal weight to the support provided by the project regardless of their disciplines.
A previous study that assessed the satisfaction of the project beneficiaries conducted by Muluh et al. (Citation2019) in Cameroon observed that although beneficiaries benefited from the donor-funded projects; transparency, socio-economic factors, and the status of the beneficiaries were key factors to the sustainability or failure of the gained changes. Thus, for project sustainability, transparency, and cooperation between the project implementers and beneficiaries is a crucial determining role.
It is logical to note that service related to ICT was rated relatively lower than other services by both student teachers and tutors. This could be partly explained by the late procurement and supply of the required ICT facilities. This situation seems to be against the expectations of beneficiaries. Since ICT has become a cornerstone in teacher preparation in the contemporary context (Batez, Citation2021; Basri et al., Citation2018), it is critical to rethink how this service could be approached to meet the expectations of users.
Further, it can be argued that the satisfaction of TESP beneficiaries provides a fundamental indicator for the progress and success of the project on one hand and sets the planning strategy for subsequent actions on the other. Since the funding agencies have the right to hold the public accountable in light of misuse of the provided support (Sundberg, Citation2019), it is necessary to make a frequent assessment of the progress of the project activities during the project implementation and examine the sustainability of the project activities after the project life.
Another important observation indicated that student teachers’ and tutors ‘satisfaction is mediated by related but different factors. While student teachers’ satisfaction seems to be more strongly predicted by in-class teaching aids and learning materials, ISTE was the most powerful predictor variable of tutors’ satisfaction. These findings coincide with those reported by Lazibat et al. (Citation2014) which found students’ and teachers’ satisfaction with service quality to be influenced by different factors. Equally, these findings are also consistent with those reported by Kärnä and Julin (Citation2015) and Woltering et al. (Citation2009). These findings call for the use of multilevel interventions in public TCs when one targets an improved teaching and learning environment in public TCs. The findings also suggest that the measurement of satisfaction levels of student teachers and college tutors should be approached differently. As a result, the findings may help to inform the college management, the MoEST, and other educational stakeholders on the key areas that need considerable attention to improve TE in Tanzania. The difference in the level of satisfaction between tutors and student teachers has been explained by the study findings documented from the FGDs. As noted, tutors seem to have more access to the facilities than student teachers do and therefore variation in satisfaction levels was not a surprising finding given the reports and findings from the participants and the actual observations in TCs.
Finally, the findings showed that gender as a variable does not make any significant difference in the ways in which student teachers and tutors perceive and get satisfied with the service quality of facilities and learning environment in public TCs. Thus, equal treatment of both sexes in TCs could be appropriate for student teachers and tutors when considering procurement of teaching and learning materials, instructional approaches, and delivery of varied services to both of the beneficiaries. The findings are inconsistent with Dang et al.’s (Citation2016) study that observed variation amongst genders in their satisfaction with technologically supported environments. Mixed findings have also been reported elsewhere (Harvey et al., Citation2017). It can therefore be argued that describing satisfaction levels remains a complex topic and a critical issue for further research. The complexity could partly be linked to variation in cultural contexts and socio-economic aspects among the studied groups (Eroğlu et al., Citation2009). Subsequent studies are inevitable to examine other mediating factors beyond the scope of this study.
6. Limitations of the study
Although this study presents a useful contribution to the existing literature, it is worth mentioning some of the limitations. First, the study employed a self-rated survey and group discussion with research participants. This presents a methodological limitation for social desirability responding and Hawthorne’s effect, respectively (Lambert et al., Citation2016). However, some meta-analytic reviews have provided considerable support to the measurement of self-reported responses indicating that they provide authentic findings particularly in social science research (Vesely & Klöckner, Citation2020). Correspondingly, the use of multiple tools such as observation, FGDs, and document review in addition to questionnaires provide more evidence to the collected data, hence less likely to the occurrence of response bias (Podsakoff et al., Citation2012). Besides, the purpose of the study was communicated to respondents before they decided to take part in this study for the sake of maximizing the trustworthiness of their responses.
Second, satisfaction is mediated by several factors (see, Hemsley-Brown et al., Citation2010; Sofroniou et al., Citation2020) some of which are beyond the scope of this study. Other factors such as college management and leadership style, college infrastructure, access to social services such as food and water as well as security issues on campus have not been measured in this study (Abbas, Citation2020). Nevertheless, the focus of this study was not to examine comprehensive mediating factors for student teachers’ and tutors’ satisfaction. We believe that these findings are useful to give insights required for decision-making about the improvement of teacher education in TCs in Tanzania. Thus, future research may focus on other areas such as professional development and its impacts on the satisfaction of student learning that was beyond the scope of this study.
Third, the study employed questionnaires with limited cross-cultural validations. Therefore, construct and criterion validity could be questioned. Nonetheless, a thorough assessment of the questionnaire items was conducted before administering them to the participants. Similarly, the sample used was adequate to assess the reliability and validity of the scales as it included all public TCs, hence a representative one. The psychometric values obtained were adequate for survey research. Yet, future research needs to address these potential limitations.
7. Conclusions and recommendations
This study draws threefold conclusions. First, it is evident from the findings that TESP has considerably improved the teaching and learning environment in public TCs and the spillover effect could be expected in other education levels where the project did not provide direct support. Thus, a follow-up study could be conducted to examine the impact of TESP in other education levels from primary to university education levels. Consequently, there is a need to close the gaps, particularly on student teachers to books ratio and student teachers to functional computers ratio of 1:1 targeted by the project.
Second, both male and female student teachers and tutors require equal treatment in the process of improving their satisfaction with access to and use of college facilities and other teaching and learning environments. This could be done by encouraging both of them to have equal access and use of the available college facilities such as ICT facilities, teaching aids, library services, and science materials in the laboratories.
Third, the measurement of satisfaction levels for student teachers and tutors should be assessed separately in public TCs. This also draws attention to the different means required to address their challenges. More importantly, considerable attention needs to be paid to improving the quality and access of student teachers to in-class teaching and practical materials without neglecting other factors such as tutors’ pedagogical skills, access to ICT facilities and services as well as improving access to library facilities and services. On the other hand, an integrated ICT with improved tutors’ pedagogical strategies should be continuously upgraded together with teaching aids and a teaching environment. Moreover, there is a need to conduct a systematic study to examine a detailed analysis regarding the limited explanatory power of library facilities and services over tutors’ satisfaction in public TCs. Finally, these findings provide TCs, the MoEST, and other teacher educational stakeholders with the priority areas that need a strong emphasis to redefine teacher education in Tanzania.
Disclosure statement
No potential conflict of interest was reported by the author(s).
Additional information
Funding
Notes on contributors
Josephat Paul Nkaizirwa
Calvin Zakaria Swai (Ph.D.) is a seasoned educational consultant and Lecturer at the University of Dodoma, Tanzania. His research focuses on areas of teacher education. He has enormous experience in designing and evaluating internationally inspired and locally implemented educational projects.
Josephat Paul Nkaizirwa is an academician at the University of Dodoma, College of Education, Tanzania. He is a doctoral student at the University of Rwanda focusing on enhancing Education for Sustainable Development and Environmental Sustainability in Teacher Education.
Alfred Kisuda Hugo (PhD.) is a lecturer in the Department of Mathematics and Statistics at the College of Natural and Mathematical Science of the University of Dodoma. His research interests include ecological modeling, mathematical epidemiology, and mathematics education.
Cosmas Anyelwisye Mahenge is an educational officer in the Teacher Education Unit of the Ministry of Education, Science and Technology, Tanzania.
Philibert Sixbert Komba is an academician at the college of Education, University of Dodoma, Tanzania. His research area focuses on the integration of ICT in teaching and learning.
References
- Abbas, J. (2020). HEISQUAL: A modern approach to measure service quality in higher education institutions. Studies in Educational Evaluation, 67, 100933. https://doi.org/10.1016/j.stueduc.2020.100933
- Abdullah, F. (2006a). Measuring service quality in higher education: HEdPERF versus SERVPERF. Marketing Intelligence and Planning, 24(1), 31–25. https://doi.org/10.1108/02634500610641543
- Abdullah, F. (2006b). The development of HEdPERF: A new measuring instrument of service quality for the higher education sector. International Journal of Consumer Studies, 30(6), 569–581. https://doi.org/10.1111/j.1470-6431.2005.00480.x
- Al-Sheeb, B., Hamouda, A. M., & Abdella, G. M. (2018). Investigating determinants of student satisfaction in the first year of college in a public university in the state of Qatar. Education Research International, 2018, 1–14. https://doi.org/10.1155/2018/7194106
- Appleton-Knapp, S. L., & Krentler, K. A. (2006). Measuring student expectations and their effects on satisfaction: The importance of managing student expectations. Journal of Marketing Education, 28(3), 254–264. https://doi.org/10.1177/0273475306293359
- Basri, W. S., Alandejani, J. A., & Almadani, F. M. (2018). ICT adoption impact on students’ academic performance: Evidence from Saudi universities. Education Research International, 2018, 1–9. https://doi.org/10.1155/2018/1240197
- Batez, M. (2021). ICT skills of university students from the faculty of sport and physical education during the COVID-19 pandemic. Sustainability, 13(4), 1–13. https://doi.org/10.3390/su13041711
- Bielefeldt, A. R., & Canney, N. E. (2019). Working engineers’ satisfaction with helping people and society through their jobs. European Journal of Engineering Education, 44(6), 939–953. https://doi.org/10.1080/03043797.2018.1476468
- Brochado, A. (2009). Comparing alternative instruments to measure service quality in higher education. Quality Assurance in Education, 17(2), 174–190. https://doi.org/10.1108/09684880910951381
- Butt, B., & Rehman, K. (2010). A study examining the students’ satisfaction in higher education. Procedia-Social and Behavioral Sciences, 2(2), 5446–5450. https://doi.org/10.1016/j.sbspro.2010.03.888
- Chandra, T., Hafni, L., Chandra, S., Purwati, A. A., & Chandra, J. (2019). The influence of service quality, university image on student satisfaction and student loyalty, Benchmarking. An International Journal. https://doi.org/10.1108/BIJ-07-2018-0212
- Churchill, G. A., & Surprenant, C. (1982). An investigation into the determinants of customer satisfaction. Journal of Marketing Research, 19(4), 491–504. https://doi.org/10.1177/002224378201900410
- Creswell, J. W., & Plano Clark, V. L. (2018). Designing and conducting mixed methods research. In Designing and conducting mixed methods research approach (3rd ed.). SAGE Publications, Inc.
- Cronin, J. J., & Taylor, S. A. (1992). Measuring service quality: A reexamination and extension. Journal of Marketing, 56(3), 55. https://doi.org/10.1177/002224299205600304
- Cronin, J. J., & Taylor, S. A. (1994). SERVPERF versus SERVQUAL: Reconciling performance-based and perceptions-minus-expectations measurement of service quality. Journal of Marketing, 58(1), 125. https://doi.org/10.1177/002224299405800110
- Dabholkar, P. A., Shepherd, C. D., & Thorpe, D. I. (2000). A comprehensive framework for service quality: An investigation of critical conceptual and measurement issues through a longitudinal study. Journal of Retailing, 76(2), 139–173. https://doi.org/10.1016/S0022-4359(00)00029-4
- Dang, Y., Zhang, Y., Ravindran, S., & Osmonbekov, T. (2016). Examining student satisfaction and gender differences in technology-supported, blended learning. Journal of Information Systems Education, 27(2), 119–130. https://aisel.aisnet.org/jise/vol27/iss2/5
- Danjuma, I., Bawuro, F. A., Vassumu, M. A., & Habibu, S. A. (2018). The service quality scale debate: A tri-instrument perspective for higher education institutions. Expert Journal of Business and Management, 6(2), 127–133. https://doi.org/10.1515/mt-1999-417-807
- Desai, S., Damewood, E., & Jones, R. (2001). Be a good teacher and be seen as a good teacher. Journal of Marketing Education, 23(2), 136–144. https://doi.org/10.1177/0273475301232007
- El Ansari, W. (2002). Student nurse satisfaction levels with their courses: Part I- effects of demographic variables. Nurse Education Today, 22(2), 159–170. https://doi.org/10.1054/nedt.2001.0682
- Eroğlu, S. E., Bozgeyikli, H., & Çalişir, V. (2009). Life satisfaction depending on socio-economic status and gender among Turkish students. Policy Future in Education, 7(4), 379–386. https://doi.org/10.2304/pfie.2009.7.4.379
- Geier, M. T. (2021). Students’ expectations and students’ satisfaction: The mediating role of excellent teacher behaviors. Teaching of Psychology, 48(1), 9–17. https://doi.org/10.1177/0098628320959923
- Hanssen, T.-E. S., & Solvoll, G. (2015). The importance of university facilities for student satisfaction at a Norwegian University. Facilities, 33(13/14), 744–759. https://doi.org/10.1108/F-11-2014-0081
- Harvey, H. L., Parahoo, S., & Santally, M. (2017). Should gender differences be considered when assessing student satisfaction in the online learning environment for millennials? Higher Education Quarterly, 71(2), 141–158. https://doi.org/10.1111/hequ.12116
- Hemsley-Brown, J., Lowrie, A., Gruber, T., Fuß, S., Voss, R., & Gläser-Zikuda, M. (2010). Examining student satisfaction with higher education services: Using a new measurement tool. International Journal of Public Sector Management, 23(2), 105–123. https://doi.org/10.1108/09513551011022474
- Herdlein, R., & Zurner, E. (2015). Student satisfaction, needs, and learning outcomes: A case study approach at a European university. SAGE Open, 5(2), 1–10. https://doi.org/10.1177/2158244015580373
- Icli, G. H., & Anil, N. K. (2014). The HEDQUAL scale: A new measurement scale of service quality for MBA programs in higher education. South African Journal of Business Management, 45(3), 31–43. http://dx.doi.org/10.4102/sajbm.v45i3.129
- Jaiswal, A. K. (2008). Customer satisfaction and service quality measurement in Indian call centres. Managing Service Quality: An International Journal, 18(4), 405–416. https://doi.org/10.1108/09604520810885635
- Kafyulilo, A., Fisser, P., Pieters, J., & Voogt, J. (2015). ICT use in science and mathematics teacher education in Tanzania: Developing technological pedagogical content knowledge. Australasian Journal of Educational Technology, 31(4), 381–399. https://doi.org/10.14742/ajet.1240
- Kärnä, S., & Julin, P. (2015). A framework for measuring student and staff satisfaction with university campus facilities. Quality Assurance in Education, 23(1), 47–66. https://doi.org/10.1108/QAE-10-2013-0041
- Lambert, C. E., Arbucklambere, S. A., & Holden, R. R. (2016). The Marlowe-Crowne social desirability scale outperforms the BIDR impression management scale for identifying fakers. Journal of Research in Personality, 61, 80–86. https://doi.org/10.1016/j.jrp.2016.02.004
- Lazibat, T., Baković, T., & Dužević, I. (2014). How perceived service quality influences students’ satisfaction? Teachers’ and students’ perspectives. Total Quality Management and Business Excellence, 25(7–8), 923–934. https://doi.org/10.1080/14783363.2014.916036
- Liu, L., Wang, Y. S., & Wu, T. J. (2017). Student satisfaction scale development and application for sport management in China. Eurasia Journal of Mathematics, Science and Technology Education, 13(5), 1429–1444. https://doi.org/10.12973/eurasia.2017.00678a
- Lodesso, S. L., van Niekerk, E. J., Jansen, C. A., & Müller, H. (2019). Student satisfaction regarding service quality at Ethiopian public higher education institutions: A case study. Journal of Student Affairs in Africa, 6(2), 51–64. https://doi.org/10.24085/jsaa.v6i2.3309
- Mallika Appuhamilage, K. S., & Torii, H. (2019). The impact of loyalty on the student satisfaction in higher education: A structural equation modeling analysis. Higher Education Evaluation and Development, 13(2), 82–96. https://doi.org/10.1108/HEED-01-2019-0003
- Mamlok-naaman, R. (2015). A reform in science education in Tanzania a reform in science education in Tanzania, Conference: 22nd Symposium on Chemical and Science Education: Bremen.
- Martínez-Flisser, G., Flisser, A., Castro-Guerrero, M. A., & Plett-Torres, T. (2020). Measuring student satisfaction as the first assessment of the program of combined studies in medicine, an MD/PhD-like program of the faculty of medicine, national autonomous university of Mexico. BMC Medical Education, 20(1), 1–15. https://doi.org/10.1186/s12909-020-02357-1
- McCollough, M. A., & Gremler, D. D. (1999). Student satisfaction guarantees: An empirical investigation of student and faculty attitudes 1. Marketing Education Review, 9(2), 53–64. https://doi.org/10.1080/10528008.1999.11488676
- McLaughlin, P., & Faulkner, J. (2012). Flexible spaces … what students expect from university facilities. Journal of Facilities Management, 10(2), 140–149. https://doi.org/10.1108/14725961211218776
- Muluh, G. N., Kimengsi, J. N., & Azibo, N. K. (2019). Challenges and prospects of sustaining donor-funded projects in rural Cameroon. Sustainability, 11(24), 1–25. https://doi.org/10.3390/su11246990
- Nunally, J. C. 1978. Psychometric theory (2nd Ed.). McGraw-Hill.
- Ottevanger, W., De Feiter, L., Kalafunja, O.-S., & Van Den Akker, J. (2005). The TEAMS project in Tanzania: From intervention to capacity building. Journal of International Cooperation in Education, 8 (1), 111–123. https://cice.hiroshima-u.ac.jp/wp-content/uploads/2014/03/8-1-9.pdf
- Pallant, J. 2016. A step by step guide to data analysis using IBM SPSS (6th Ed.). MC Graw-Hill Education.
- Parasuraman, A., Zeithaml, V. A., & Berry, L. L. (1985). A conceptual model of service quality and its implications for future research. Journal of Marketing, 49(4), 41–50. https://doi.org/10.1177/002224298504900403
- Pelletier, L., Legault, L., & Tuson, K. M. (1996). The environmental satisfaction scale. Environment and Behavior, 28(1), 5–26. https://doi.org/10.1177/0013916596281001
- Podsakoff, P. M., MacKenzie, S. B., & Podsakoff, N. P. (2012). Sources of method bias in social science research and recommendations on how to control it. Annual Review of Psychology, 63(1), 539–569. https://doi.org/10.1146/annurev-psych-120710-100452
- Rad, A. M. M., & Yarmohammadian, M. H. (2006). A study of the relationship between managers’ leadership style and employees’ job satisfaction. Leadership in Health Services, 19(1), 11–28. https://doi.org/10.1108/13660750610665008
- Rahman, S. M. M., Mia, M. S., Ahmed, F., Thongrak, S., & Kiatpathomchai, S. (2020). Assessing students’ satisfaction in public universities in Bangladesh: An empirical study. Journal of Asian Finance, Economics, and Business, 7(8), 323–332. https://doi.org/10.13106/JAFEB.2020.VOL7.NO8.323
- Razinkina, E., Pankova, L., Trostinskaya, I., Pozdeeva, E., Evseeva, L., & Tanova, A. (2018). Student satisfaction as an element of education quality monitoring in innovative higher education institutions. E3S Web of Conferences, 33, 3043. https://doi.org/10.1051/e3sconf/20183303043
- Rodrigues, L. L. R., Barkur, G., Varambally, K. V. M., & Motlagh, F. G. (2011). Comparison of SERVQUAL and SERVPERF metrics: An empirical study. The TQM Journal, 23(6), 629–643. https://doi.org/10.1108/17542731111175248
- Schijns, J. M. C. (2021). Measuring service quality at an online university: Using PLS-SEM with archival data. Tertiary Education and Management, 27(2), 161–185. https://doi.org/10.1007/s11233-021-09071-7
- Semali, L. M., & Mehta, K. (2012). Science education in Tanzania: Challenges and policy responses. International Journal of Educational Research, 53, 225–239. https://doi.org/10.1016/j.ijer.2012.03.012
- Silva, D. S., Moraes, G. H. M., Makiya, Ieda K, & Cesar, F. I. (2017). Measurement of perceived service quality in higher education institutions: A review of HEdPERF scale use. Quality Assurance in Education, 25(4), 415–439. https://doi.org/10.1108/QAE-10-2016-0058
- Sofroniou, A., Premnath, B., & Poutos, K. (2020). Capturing student satisfaction: A case study on the national student survey results to identify the needs of students in stem related courses for a better learning experience. Education Sciences, 10(12), 1–22. https://doi.org/10.3390/educsci10120378
- Steppacher, D., Cannarozzo Tinoco, M. A., Caten, C. S. T., & Marcon, A. (2021). Assessing administrative service quality in higher education: Development of an attribute-based framework (HEADSQUAL) in a Brazilian University. Studies in Higher Education, 46(9), 1785–1800. https://doi.org/10.1080/03075079.2019.1706076
- Sundberg, M. (2019). Donors dealing with ‘aid effectiveness’ inconsistencies: National staff in foreign aid agencies in Tanzania. Journal of Eastern African Studies, 13(3), 445–464. https://doi.org/10.1080/17531055.2019.1628384
- Swai, C. Z., & Glanfield, F. (2018). Teacher-led professional learning in Tanzania: Perspectives of mathematics teacher leaders. Global Education Review, 5(3), 183–195. https://ger.mercy.edu/index.php/ger/article/view/406
- Tabachnick, B. G., & Fidell, L. S. (2007). Using multivariate statistics (5th ed.). Pearson Allyn and Bacon.
- Tarmo, A. (2016). Pre-service science teachers’ epistemological beliefs and teaching reforms in Tanzania. Cogent Education, 3(1), 1–20. http://dx.doi.org/10.1080/2331186X.2016.1178457
- Teeroovengadum, V., Kamalanabhan, T. J., & Seebaluck, A. K. (2016). Measuring service quality in higher education: Development of a hierarchical model (HESQUAL). Quality Assurance in Education, 24(2), 244–258. https://doi.org/10.1108/QAE-06-2014-0028
- Vesely, S., & Klöckner, C. A. (2020). Social desirability in environmental psychology research: Three meta-analyses. Frontiers in Psychology, 11, 1–9. https://doi.org/10.3389/fpsyg.2020.01395
- Wach, S., Karbach, J., Ruffing, S., Brünken, R., & Spinath, F. M. (2016). University students' satisfaction with their academic studies: Personality and motivation matter. Frontiers in Psychology, 7(1–12). https://doi.org/10.3389/fpsyg.2016.00055
- Weerasinghe, I. S., Lalitha, R., & Fernando, S. (2017). Students’ satisfaction in higher education literature review. American Journal of Educational Research, 5(5), 533–539. https://doi.org/10.12691/education-5-5-9
- Wilkins, S., & Balakrishnan, M. S. (2013). Assessing student satisfaction in transnational higher education. International Journal of Educational Management, 27(2), 143–156. https://doi.org/10.1108/09513541311297568
- Woltering, V., Herrler, A., Spitzer, K., & Spreckelsen, C. (2009). Blended learning positively affects students’ satisfaction and the role of the tutor in the problem-based learning process: Results of a mixed-method evaluation. Advances in Health Sciences Education, 14(5), 725–738. https://doi.org/10.1007/s10459-009-9154-6
Appendix 1
Scatterplot for student teachers’ responses
Appendix 2
Probability plot for tutors’ responses
