
Abstract
Field course is an important learning activity for students in disciplines like geography and biology. Unfortunately, lack of resources, large student groups, and unprepared students can result in students being passive rather than active during field course preparation. This article reports from a learning intervention where the use of StoryMaps replaced traditional lectures to increase active learning during field course preparation. StoryMaps is a multimedia platform with interactive functionalities, and we assess potential increased learning outcome from a learning intervention based on theories from geographic visualization. Students used StoryMaps to become familiar with the field course site and the field course assignments. As a follow-up, students had to write a reflection note about their thoughts and experiences from using StoryMaps. These notes revealed that students consider StoryMaps as helpful to access information from multiple sources in one visual platform, where they can choose how and what they want to learn, at what time, and in which order. Students also found that complex physical geographical-, and geomorphological principles became more concrete as StoryMaps helped them perceive these principles from multiple angles using pictures, videos, tasks, animations, and graphs. The few critical reflections are mainly related to minor technical issues.
1. Introduction
Field course is described by Holt-Jensen (Citation1990) as a core-activity in geography, and it is an essential part of education and research also in many other field-based disciplines (Caliscan, Citation2011). Field-based education is described as having three phases: preparation to the field course, the actual field course, and post-field course activity (Remmen & Frøyland, Citation2014, Citation2015, Citation2017). This article is about field course preparation, recognized as vital to fully utilize the learning potential (Remmen & Frøyland, Citation2014) and to engage students making them more focused during the field course (Warburton & Higgitt, Citation1997). The preparation part of a field course is nevertheless often the most passive part of field-based education (Remmen & Frøyland, Citation2014) and the phase where the potential to improve the learning outcome is highest (Midtaune et al., Citation2018).
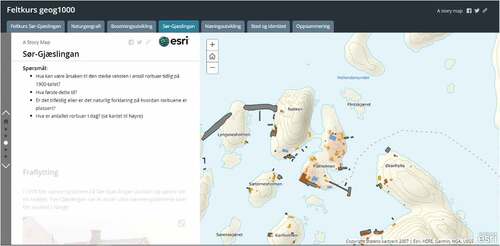
StoryMaps is a web-based multimedia platform developed by ESRI, with possibilities to present a story through maps, pictures, videos, websites, text, and URLs to other web portals (https//storymaps.arcgis.com). Figure shows a screenshot from the StoryMap application we created for self-studying and teacher-initiated group-work ahead of a field course for geography students. The left panel contains reflective questions to encourage exploration of the field site shown in the map at the right panel.
Figure 1. StoryMap application for the field course area.
We have two objectives for this study: first to evaluate how StoryMaps can promote active learning for field course preparation, and second, to understand students’ reflections after having used StoryMaps.
To pursue our objectives, we structure the article followingly: We start by outlining the communication paradigm and the geovisualization perspective within cartography using MacEachren’s map use cube (MacEachren, Citation1994). Thereafter, we present other authors’ experiences with StoryMaps as a means for learning in higher education. We then introduce the StoryMap application we developed for field course preparation. We discuss StoryMaps as a tool for visualization and adapt MacEachren’s theoretical framework to describe how StoryMaps may be used for learning. The theory section is followed by a section outlining the methods used. We thereafter present results and discuss these based on the theoretical framework. Finally, we end the article with some concluding remarks.
1.1. Cartographic communication and geographic visualization
In the period after the Second World War, cartography was a discipline that developed towards an empirical science where the main purpose of the map was to communicate information to the map user. Inspired by mathematical information theory (Shannon & Weaver, Citation1949) where communication was regarded as a message mediated from a sender and interpreted by a receiver, cartographers tried to develop principles for map design that would make the information transfer efficient (Robinson, Citation1952). Efficient cartographic communication was achieved if the receiver understood the information in the map similarly as the sender (Koláčný, Citation1969). In retrospect, this perspective has been called the communication paradigm within cartography (MacEachren, Citation1995). The paradigm was replaced by new perspectives in the early 1990s where the map was considered as a tool to discover new knowledge (MacEachren & Kraak, Citation2001). Cartographic communication was still important, but with an added emphasis on cartographic visualization, which later is denoted geographic visualization or just geovisualization (MacEachren et al., Citation1999). In geovisualization there is no predefined message. The message is unknown and there is, therefore, no optimal map that communicates the message efficiently (MacEachren & Ganter, Citation1990). This shift from a communication paradigm to a visualization perspective implied a change in map-use along three dimensions as portrayed in Figure .
Figure 2. The map-use cube after MacEachren (Citation1994).
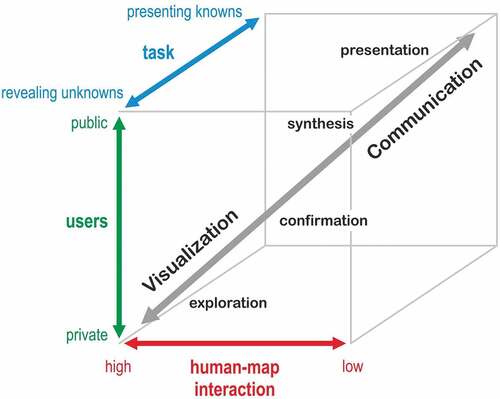
The first axis is about map use tasks. From being a medium to transfer a predefined message (presenting knowns), the purpose of a map is also to assist exploration of huge amounts of information in search for relationships or patterns (revealing unknowns). The second axis is about the map user. The map is currently not only used as a medium for dissemination of knowledge to a large audience (public domain). It is also a device for individual data exploration (private domain). The third axis is about human-map interaction. From being a map with limited level of interaction (low human-map interaction), the map is becoming a tool with an abundant set of interaction possibilities (high human-map interaction).
Whereas the distinction between presentation and exploration has been a central element in the theorization of map use cube, the map uses in-between these are rather vague and denoted differently (Schiewe, Citation2013). However, MacEachren (Citation1995) recognised four map use goals: exploration, confirmation, synthesis, and presentation. These four map use goals were positioned in the cube as illustrated in Figure and make the map uses between presentation and exploration more concrete.
The static traditional paper map aimed to present or communicate public information easily is situated in the upper, back corner of the map use cube. Similarly, in the early event of web cartography, many scans of existing paper maps were put on the web and would also fulfil a map use situated close to the “presentation” corner (van Elzakker, Citation2001).
Exploration is in the diametrically opposite corner. Visualization to explore unknown and often raw data creatively, is the dominant strategy at the private – high interaction—revealing unknown corner (MacEachren, Citation1995). More recent map-based services are exploratory and situated in the lower-front corner as they emphasize an interactive use of visual tools where individuals, or a small group of people, analyse data, discover relationships, and formulate assumptions. With exploratory maps, one can zoom and pan, look at data in 3D, turn on or off additional thematic layers, and the maps are dynamically linked to diagrams and other maps (Smith, Citation2014; Triantafyllou, Watlet & Bastin, 2017). A high degree of human-map interaction is an important principle within geovisualization and refers to both the possibility to use knowledge and analytical capabilities held by the reader of the map, and to reveal unknowns (Smith, Citation2014).
In principle, maps found in StoryMap applications (and elsewhere on the internet) can occupy several places in the cube than the above examples. StoryMaps is often used both for science communication and knowledge discovery, which represent different ends of a continuum on how maps may be used (MacEachren, Citation1995). MacEachren depicted the use of maps by means of a cubic map-use space in which visualization (knowledge discovery) and communication (knowledge dissemination) occupy opposite corners. We revisit this theoretical framework, adapt it to a multimedia-use-cube, and locate the StoryMap application we developed in this cube.
1.2. Educational use of StoryMaps
StoryMaps has previously been used for presenting field experience and “harness technology to create geocoded narratives” (Mukherjee, Citation2018, p. 219). StoryMaps has become popular within education and field-related courses within disciplines such as history, geography, environmental sciences, physics, and languages. Both Marta and Osso (Citation2015), as well as Egiebor and Foster (Citation2018) describe the use of StoryMaps as engaging and motivating for pupils learning history. Egiebor and Foster (Citation2018) also found that students regarded that StoryMaps presented cartography as something relevant for their daily life. Teachers were found to be positive to the platform as an effective tool for learning (Strachan & Mitchell, Citation2014) and future teacher students said that they would use various types of StoryMaps made by others in their future teaching, as well as creating their own (Vojteková et al., Citation2022). Master students at the University of Trieste, Italy, also created their own StoryMaps as a project about cultural heritage. In their concluding summarizing remark about StoryMaps, they stated that students “[…] showed the educational potential of this device” (Mauro & Segantin, Citation2021). Mukherjee (Citation2018) wrote that: “an overwhelming 80 % (of the students) rated that it was very easy to capture their field experience using the story map project” (Mukherjee, Citation2018, p. 218).
Roth (Citation2020) recognizes that visual storytelling is different from traditional perspectives on cartographic design, and states that “visual storytelling combines the primarily quantitative and analytical approaches developed from journalism, information visualization, and visual analytics with the primarily qualitative and reflexive approaches developed from critical cartography, indigenous mapping, and participatory GIS” (Roth, Citation2020, p. 1). Not so surprisingly therefore, we also find examples of StoryMaps being used as a means for learning qualitative methods, with emphasis on the decisions taken when building StoryMaps and the reflections behind these decisions (Dickinson & Telford, Citation2020). However, to the best of our knowledge, there is a limited number of academic studies investigating how useful StoryMaps is to prepare students for field-based education.
The StoryMaps content we developed had interactive maps with clickable elements, allowing students to zoom, pan and explore pop-ups. We also included other visual means such as pictures, animations and videos, tables, and graphs—allowing the students to become familiar with the field course area and the field course objectives in an interactive way, navigating between different media representations. We designed the StoryMap application on the results of preferred learning methods from previous first year geography students (Midtaune et al., Citation2018) with content aiming both to present knowns, but also to provide students with several activating tasks and tools to reveal unknown.
A challenge with creating an explorative StoryMap was that most of the application’s templates are built around a linear presentation of content, which were at odds with our ideas of student autonomy, thus that students should be free to explore the content in their self-chosen order. This is also in line with how other researchers find that explorative learning increases the learning outcome of the learners (Bunterm et al., Citation2014; Peng & Chen, Citation2019). We therefore developed the StoryMap application thematically with a high degree of interactivity allowing students to navigate around at their own discretion in their quest for new knowledge about the field site and field assignment.
2. Method
We replaced one pre-field course lecture (2 × 45 min) with digital lab-work with the same duration where students were requested to use the developed StoryMap application and to write a reflection note afterwards. There were 70 students in 2016 and 74 students in 2017 who attended the lab-work. The empirical part of this paper contains reflection notes from students that accepted their notes to be used for research (this includes 33 notes from 2016 and 17 from 2017). Student names were anonymized, and we used only citations from students that provided written consent. The research is carried out in line with the institutional regulations, as well as in line with the Norwegian Centre for Research Data (NSD) regulations for data privacy and ethics (https://www.nsd.no).
We analysed the following questions given in the reflection note:
What were the positive and negative aspects of using the StoryMap application?
What could have been done differently?
We used content analysis to reveal possible patterns in students’ reflection notes. Content analysis has three distinct approaches: conventional, directed, or summative (Hsieh & Shannon, Citation2005). All three approaches can be used to interpret meaning from the content of text data but a major difference between them is the way that categories emerge from text data. In conventional content analysis, researchers avoid using preconceived categories (Kondracki & Wellman, Citation2002). Conventional content analysis is therefore also called inductive category formation (Mayring, Citation2019). Without any presumptions or plans for different categories, we created categories as we read the reflection notes. This qualitative method is often used with a study design whose aim is to describe a phenomenon, in this case students’ reflections after experiencing a learning intervention. This type of design is usually appropriate when existing theory or research literature on a phenomenon is limited (Hsieh & Shannon, Citation2005). We followed Zhang and Wildemuth (Citation2017) research design of combining successively a conventional analysis with a summative analysis since a combination of these methods are likely to reveal more information than just using one of them (Hsieh & Shannon, Citation2005; Zhang & Wildemuth, Citation2017). Whereas the inductive conventional qualitative analysis provided us with information about how the students thought StoryMaps worked as a mean for learning, the summative word analysis provided us with information about the student group, and their feedback.
The summative method consists of three steps. The first step is a qualitative analysis of the reflection notes. Relevant paragraphs were classified into categories based on similarities. In the second step, words within the relevant paragraphs where counted, as a quantitative word analysis. Finally, words with similar meaning were merged back into new categories (e.g., merging fun, exciting, and interesting) and we counted the number of individual words and “hits” within each word category.
3. Results and discussion
Table presents the results from the cumulative analysis we did on the students’ feedback expressed in the reflection notes. The table is divided into positive feedbacks and negative feedbacks and are sorted by the number of instances that the feedback was given.
Table 1. Results from the cumulative word count data analysis (n = 50). Green corresponds to explicit or implicit positive feedback. Orange is critical feedback
Table . Results from the cumulative word count data analysis (n = 50). Green corresponds to explicit or implicit positive feedback. Orange is critical feedback.
* The answers are not mutually exclusive. That means feedback elements can be represented in more than one row.
** “Combine data” is a result of merging feedback expressing that StoryMaps was positive for combining sources, or feedback containing more than three or more of the words in rows 5 through 10.
All but 4 of the 50 students had positive remarks about using the StoryMap application. Words like “fun, exciting and interesting” were used 31 times, to describe the application (row 1, Table ), while the “simple, easy and lucid” (row 4, Table ) were mentioned 22 times. Multiple positive feedback was related to combining different types of media. There were 21 positive feedbacks about the ability to combine data or several media features. Table shows that pictures (14) and maps (14) were the most popular features, closely followed by questions (10), animations (9), and videos (7). One wrote that “StoryMaps was a good learning platform as it combined facts, photos and videos in a fun way” whilst another stated that what impressed him the most was “to combine URLs, maps, statistics and other sources directly into the text, which makes it easy and time-efficient to access this material”.
There were 13 critical comments to StoryMaps, which were mainly technical issues. One student wrote “It was some paragraphs/categories where only the text became visible” and another wrote about a technical problem on “unsecured scripts” and issues with the use of Chrome as a web-browser.1 These technical drawbacks prevented students from exploring sections of the StoryMaps that did not become available for them and therefore made the tool less interactive. Another negative feedback about technical issues was related to the size of the photos. One student wrote that “some of the pictures that are in the side text box can become too small […]” and another student expressed very similar sentiments. Such negative sentiments can be prevented by selecting photos with higher resolution.
We have further divided this section into addressing the three axes (interaction, task, and users) of a StoryMap adapted version of, which we call a “multimedia-use-cube”. Further, we situate the use of the StoryMap application within this cube based on the cumulative feedback from students. We have done this by investigating each axis separately, combining each category created in the qualitative text analysis with the best corresponding axis in an adapted “multimedia-use-cube”.
3.1. Interaction (high—low)
Cope et al. (Citation2018) showed that StoryMaps is an efficient tool for undergraduates in different environmental studies, in organizing the information in a user-friendly way. The lucid and simple presentation of the combined data seemed to encourage the students to use it, which is in line with Marta and Osso’s (Citation2015) and Egiebor and Foster (Citation2018) description of StoryMaps as being both motivating and engaging. From the reflection notes, we find that some students explicitly described their exploration of the data material and their interactive experience. One student mentioned, “the ability to read, explore and watch films/animations and maps without changing web-page” whilst another wrote that “all the illustrations, animation and videos gave an interesting view, and the interactive experience gave a totally different learning experience.” According to MacEachren (Citation1994; 2009), geovisualization is about facilitation of exploration and the unknown. Interaction is also stated as a premise for exploration (MacEachren, Citation1994), and the response from our students supported StoryMaps’ ability to create such an environment.
Furthermore, Peng and Chen (Citation2019) and Bunterm et al. (Citation2014) declared that explorative learning increases deep learning and a positive effect on the learning outcome. From our empirical material, several students considered StoryMap as a tool to go deeper into the material and to learn at different levels. One student expressed how the StoryMap application made her see a “landscape from many perspectives and geographical levels” while another wrote about how he liked that “you could read in general about a topic but at the same time, through links and maps, quickly go into the details and depth”. These citations support the aim of geovisualization to facilitate exploration, and its ability to dynamically link different sources to each other for a deeper meaning.
Questions added to the StoryMap application were another means of initiating explorative learning, which were referred to as reflective and increased learning outcomes by the students One student wrote, “it made me reflect about the field trip”. Another one mentioned that the questions “will be in the back of my head on the field trip to increase learning outcome.” A total of 17 students wrote that questions given in the StoryMap application stimulated reflection. One student wrote, “I liked that you could go through pictures placed at different spots on the map so you could connect a sort of feeling to the place”. The same results were found by Egiebor and Foster (Citation2018) where students explored a StoryMap application and as a result, understood geographical and cultural connections between places.
Based on the cumulative word analysis and supported by the findings from Egiebor and Foster (Citation2018) and MacEachren (Citation1994), we situate the StoryMap application towards the high end at the interaction axis. The descriptions of the StoryMap application as an “interactive experience”, the possibility to “explore”, and the 21 out of 50 students stating a positive effect of combining data (Table , row 2) supports a high level of interaction facilitating exploration. However, the StoryMap used by the students was not fully interactive as it presented some static data without any possibility for the learner to further explore media content such as text, maps, pictures, and more. Such exploration could have been facilitated using hyper-links, pop-up windows, and other interactive functions. Further, some students’ feedbacks reported on technical issues, which made it difficult for them to make use of existing interactive functions.
3.2. Task (present knowns—reveal unknowns)
As Table , row 3 illustrates, 21 of the students compared the StoryMap application with other learning methods (textbooks, PowerPoint slides, lectures, etc.) and the ability to combine data is also mentioned 21 times (row 2). One student described the StoryMap application as “something different than an A4 lecture with PowerPoint”. Another student wrote, “the interactive experience gave a completely different learning experience than by reading a textbook”. A third student noted that the StoryMap application represented “different ways of working with content than just sitting and listening to a lecture”. These feedbacks illustrate that students compared the StoryMap application with other learning methods and learning materials. Interestingly, they all compared the StoryMap application with traditional and passive learning methods where the dissemination of information is about presenting knowns rather than encouraging exploration to reveal unknowns.
During a lecture, students can ask questions, but the number of questions posed are normally very few. Short and Martin (Citation2011) explain the rather passive attitude of students by the fact that a lecture is based on the idea that a teacher presents publicly known information (presenting knowns) to students in a similar manner as presented in Shannon and Weavers’ (1949) communication theory. As an alternative to being passive receivers of known information, we wanted to activate students with tasks aiming to inspire students to look for answers as well as formulating new questions (revealing unknowns). Although the information content in the StoryMap application is already known for the educators, it is not known for the students who are learning something new and relevant before the field course (revealing unknown). Besides, the citations mentioning the possibilities of exploration and the comparisons with passive lectures where the StoryMap application is described as the opposite, make us situate the StoryMap application towards the revealing unknowns corner.
3.3. User (Public—Private)
A StoryMap application is, if it is not restricted, available to anyone (public domain) through any device with an Internet connection. However, StoryMap applications are more often explored individually or in small groups (private domain), which is how we used the StoryMap application to prepare students for their field work. As content for the StoryMap application, we specifically added questions and media resources relevant for the upcoming field course (Table , rows 5–9), and students worked with these issues in small groups (2–3 students per group).
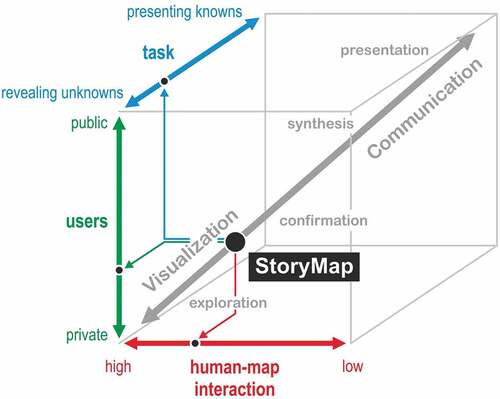
From the reflection notes, there were some students who thought that the StoryMap application presented too much information whilst others thought the opposite. One student hoped that she could explore other places than only the field course location and wrote “What I thought was negative with the StoryMap application, was that I thought it would present a bigger scale, that you could choose more places in Norway and learn about that area/place in the same way as for the field course site”. We think it is positive that students themselves are asking for web atlas functionalities to be able to explore and compare other areas or places, and as tutors we should motivate for further exploration by adding links and resources for such investigations. However, to engage students in using StoryMaps to prepare themselves for field work, it is necessary to keep the StoryMap application focused on the field area and field assignment. The StoryMap application we developed were therefore probably less interesting for a wider audience. Therefore, we have decided to place the User towards the private corner of the multimedia-use-cube (see, Figure ).
Figure 3. The location of our StoryMap application in the “multimedia-use-cube” (based on MacEachren, Citation1994) based on the reflection notes.
3.4. Situating the StoryMap application in the multimedia-use-cube
Cope et al. (Citation2018) describe StoryMaps as a tool which both effectively communicates and visualizes complicated ideas and large amounts of information in an organized, user-friendly interface targeted to the specific audience or lesson. Following this logic, we argue that StoryMap applications can be situated anywhere along the diagonal continuum from visualization to communication. Where a particular StoryMap application should be situated will depend on its aim. If the aim of a certain StoryMap application is to facilitate learning we would argue that a favourable location would be towards the corner with high interaction, revealing unknown in a private domain. shows how we situate the StoryMap application we developed in the multimedia-use-cube based on the cumulative analysis of geography students’ reflection notes combined with qualitative analysis of these reflection notes.
3.5. Limitations
Evidently, our study has some limitations. First, a cautious remark is that the overall positive feedback about the use of StoryMaps could be a result of the intervention itself. Extra use of resources, the feeling of taking part in something new, digital, and “different” are perspectives that may have influenced the participating students’ perceptions. Second, there were some technical issues experienced by some of the students. Although these issues are relatively easy to fix, we see the need for technically capable teachers to solve such problems as well as to further develop and maintain StoryMap applications. Anyhow, we urge others who want to use StoryMaps as a tool for learning, to run StoryMaps multiple times from different web-browsers and on different devices to ensure that everything is working properly. Third, we had a limited number of students that agreed to participate in the research (n = 50) and with one case study only. However, we did our investigation over a period of two years, which we claim made our findings more robust. Fourth, we did not perform any task-accomplished metrics and are thus not able to conclude that our StoryMap application increased the students’ learning outcome from the field work compared to previous students not using this application. The use of the StoryMap application as field course preparation was nevertheless based on a principle of activating students, motivated by studies supporting that an active students learn more than a passive one (Freeman et al., Citation2014). Our StoryMap application were positively assessed by the participating students but similarly as Roth (Citation2020), more research is needed to study the effect of visual storytelling, such as its effectiveness on learning outcome for preparation to field based education. Like any other digital educational tools, it is naïve to believe that a StoryMap application will enhance students’ learning just because it is digital. A StoryMap application can present too much information without any possibilities for exploration, or it could be like a platform facilitating exploratory and interactive geovisualizing that is engaging and motivating.
4. Concluding remarks
As cartographers always did when making paper maps, designers of StoryMap applications must consider the purpose of the maps and how the users’ may use them to their benefit. We are hereby proposing the multimedia-use-cube framework when developing multimedia platforms. The cube can be useful for development and critical evaluation of multimedia platforms while working with content, design, and user interface. To better plan for an added value of an educational intervention, we state that the multimedia-use-cube is a useful guideline for creation of visual multimedia learning platforms such as StoryMaps—e.g., where on the “interaction” axis would you like your StoryMap application to be? The StoryMap platform is rich in creating explorative and interactive content, and thus promising for teachers who want to design student active learning activities. Although it may be time consuming to build a StoryMap application with educational content and focus on active learning, the application can be reused year after year only with minor modifications. We have shown that designing a StoryMap application that introduces students to the field work site and the field work assignments are stimulating for students, who not only interact much with the application to obtain new knowledge—but also interact with each other while working.
The ability to combine data, consider different sources against each other and explore content from different angles is essential for the development of critical thinking. StoryMaps is a digital platform, which stimulates to this opportunity, and analysis of reflection notes reveals that students in geography found our StoryMap application useful for their field work preparation. The application is, as stated in one of the reflection notes, “lucid, easy to use and fun to explore” in the context of learning geography. The quotes also reveal that many students, without being asked, praised the introduction of a greater variation in learning methods. Students were welcoming alternatives to traditional learning methods, and the possibility to explore and go in depth, which geovisualization is aiming to stimulate. Based on our experience, we recognise a potential to increase deep learning when some of the traditional lectures are getting replaced with the use of self-explorative StoryMaps for field course preparations. StoryMaps is a tool that, used in the right educational context, can be helpful as preparation to field course activities, and can in that context replace some traditional lectures.
Acknowledgment
The work with this project is suported by NTNU Topp Education and the EU Erasmus + program, the two projects: EduChange 2.0 - Promoting active citizenship through innovative geoparticipatory methods to tackle wicked-environmental problems (project no. 2020-1-CZ01-KA203-078349) and DigiGeo - Transferring contact, technology- and field-based education to digital: methods and tools for geosciences training (project no. 2020-1-CZ01-KA226-HE-094425).
Disclosure statement
No potential conflict of interest was reported by the author(s).
Additional information
Funding
References
- Bunterm, T., Lee, K., Rachahoon, G., Srikoon, S., Vangpoomyai, P., Rattanavongsa, J., & Rachahoon, G. (2014). Do different levels of inquiry lead to different learning outcomes? A comparison between guided and structured inquiry. International Journal of Science Education, 36(12), 1937–12. https://doi.org/10.1080/09500693.2014.886347
- Caliscan, O. (2011). Virtual field trips in education of earth and environmental sciences. Procedia, Social and Behavioral Sciences, 15, 3239–3243 https://doi.org/10.1016/j.sbspro.2011.04.278.
- Cope, M. P., Mikhailova, E. A., Post, C. J., Schlautman, M. A., & Carbajales-Dale, P. (2018). Developing and Evaluating an ESRI Story Map as an Educational Tool. Natural Sciences Education, 47(1), 180008. https://doi.org/10.4195/nse2018.04.0008
- Dickinson, S., & Telford, A. (2020). The visualities of digital story mapping: Teaching the ‘messiness’ of qualitative methods through story mapping technologies. Journal of Geography in Higher Education, 44(3), 441–457. https://doi.org/10.1080/03098265.2020.1712686
- Egiebor, E. E., & Foster, E. J. (2018). Students’ Perceptions of Their Engagement Using GIS-Story Maps. Journal of Geography, 118(2), 1–15. https://doi.org/10.1080/00221341.2018.1515975
- Freeman, S., Eddy, S. L., McDonough, M., Smith, M. K., Okoroafor, N., Jordt, H., & Wenderoth, M. P. (2014). Active learning increases student performance in science, engineering, and mathematics. Proceedings of the National Academy of Sciences, 111(23), 8410–8415. https://doi.org/10.1073/pnas.1319030111
- Holt-Jensen, A. (1990). Geografiens innhold og metoder. Universitetsforlaget.
- Hsieh, H., & Shannon, S. E. (2005). Three Approaches to Qualitative Content Analysis. Qualitative Health Research, 15(9), 1277–1288 https://doi.org/10.1177/1049732305276687.
- Koláčný, A. (1969). Cartographic information: A fundamental concept and term in modern cartography. The Cartographic Journal, 6(1), 47–49. http://doi.org/10.1179/caj.1969.6.1.47
- Kondracki, N. L., & Wellman, N. S. (2002). Content analysis: Review of methods and their applications in nutrition education. Journal of Nutrition Education and Behavior, 34 4 , 224–230. https://doi.org/10.1016/S1499-4046(06)60097-3
- MacEachren, A. M. (1994). Visualization in modern cartography: Setting the agenda. In A. M. MacEachren & D. R. F. Taylor (Eds.), Visualization in modern cartography (pp. 1–12). Pergamon.
- MacEachren, A. M. (1995). How maps work: Representation, visualization, and design. Guilford Press.
- MacEachren, A. M., Edsall, R. M., Haug, D., Baxter, R., Otto, G., Masters, R., Fuhrmann, S., & Qian, L. (1999). Virtual environments for geographic visualization: Potential and challenges. NPIVM, 35–40. https://doi.org/10.1145/331770.331781
- MacEachren, A., & Ganter, J. H. (1990). A Pattern Identification Approach to Cartographic Visualization. Cartographica: The International Journal for Geographic Information and Geovisualization, 27(2), 64–81. https://doi.org/10.3138/M226-1337-2387-3007
- MacEachren, A. M., & Kraak, M. (2001). Research Challenges in Geovisualization. Cartography and Geographic Information Science, 28(1), 3–12 https://doi.org/10.1559/152304001782173970.
- Marta, M., & Osso, P. (2015). Story Maps at school: Teaching and learning stories with maps. Journal of Research and Didactics in Geography (J-READING), 2(4), 61–68. https://doi.org/10.4458/6063-0
- Mauro, B., & Segantin, S. (2021). Cultural heritage and storytelling: Didactic applications in Trieste with ESRI Story Maps. Journal Of Research And Didactics In Geography 1 , 23–37. https://books.google.no/books?id=wwKAzgEACAAJ
- Mayring, P. (2019). Qualitative content analysis: demarcation, varieties, developments, Forum Qualitative Social Research. 20(3 16 https://doi.org/10.17169/fqs-20.3.3343)
- Midtaune, Kristiane , Cyvin, Jakob Bonnevie , Panek, Jiri , Rød, Jan Ketil Author. (2018). Feltbasert undervisning. Kan digital teknologi og innsikt i studenters foretrukne læringsmetoder gjøre feltbasert undervisning bedre? [Field-based education. Can digital technology and insight into students' preferred learning methods improve field-based learning] UNIPED 41 4 452–468 doi:10.18261/issn.1893-8981-2018-04-07 .
- Mukherjee, F. (2018). Exploring cultural geography field course using story maps. Journal of Geography in Higher Education, 43(2), 201–223. https://doi.org/10.1080/03098265.2019.1597031
- Peng, M. Y., & Chen, C. C. (2019). The Effect of Instructor’s Learning Modes on Deep Approach to Student Learning and Learning Outcomes. Educational Sciences: Theory & Practice, 19(3), 65–85. https://doi.org/10.12738/estp.2019.3.005
- Remmen, K. B., & Frøyland, M. (2014). Implementation of guidelines for effective fieldwork designs: Exploring learning activities, learning processes, and student engagement in the classroom and the field. International Research in Geographical and Environmental Education, 23(2), 103–125. https://doi.org/10.1080/10382046.2014.891424
- Remmen, K. B., & Frøyland, M. (2015). Supporting student learning processes during preparation, fieldwork and follow-up work: Examples from upper secondary school in Norway. Nordic Studies in Science Education (Nordina), 11(1), 118–134. https://doi.org/10.5617/nordina.908
- Remmen, K. B., & Frøyland, M. (2017). «Utvidet klasserom» – Et verktøy for å designe uteundervisning i naturfag. NorDiNa, 13(2), 218–229. https://doi.org/10.5617/nordina.2957
- Robinson, A. H. (1952). The look of maps: an examination of cartographic design. University of Wisconsin Press.
- Roth, R. E. (2020). Cartographic design as visual storytelling: synthesis and review of map-based narratives, genres, and tropes. The Cartographic Journal 58 1 83–114 . https://doi.org/10.1080/00087041.2019.1633103
- Schiewe, J. (2013). Geovisualization and Geovisual Analytics: The Interdisciplinary Perspective on Cartography. KN - Journal of Cartography and Geographic Information, 63(3), 122–126. https://doi.org/10.1007/BF03546122
- Shannon, C. E., & Weaver, W. (1949). A Mathematical Model of Communication. University of Illinois Press.
- Short, F. &., & Martin, J. (2011). Presentation vs. Performance: Effects of Lecturing Style in Higher Education on Student Preference and Student Learning. Psychology Teaching Review, 17(2), 71–82 http://files.eric.ed.gov/fulltext/EJ959028.pdf.
- Smith, D. A. (2014). Domestic energy use in England and Wales: A 3D density grid approach. Regional Studies, Regional Science, 1(1), 347‒349 https://www.researchgate.net/deref/http%3A%2F%2Fdx.doi.org%2F10.1080%2F21681376.2014.986190.
- Stojšić, I., Ivkov-Dzigurski, A., Maričić, O., Bibić, L. I., & Đukičin, S. (2016). Possible application of virtual reality in geography teaching. Journal of Subject Didactics, 1(2), 83–96. https://doi.org/10.5281/zenodo.438169
- Strachan, C., & Mitchell, J. (2014). Teachers’ Perceptions of Esri Story Maps as Effective Teaching Tools. Review of International Geographical Education Online, 4(3 195–220 https://dergipark.org.tr/en/download/article-file/591037).
- van Elzakker, Corné P.J.M. (2001). Use of maps on the Web. In Kraak, M-J. and Brown (Eds). Use of maps on the Web. London: Taylor & Francis. 21‒36.
- Vojteková, J., Žoncová, M., Tirpáková, A., & Vojtek, M. (2022). Evaluation of story maps by future geography teachers. Journal of Geography in Higher Education, 46(3), 360–382. https://doi.org/10.1080/03098265.2021.1902958
- Warburton, J., & Higgitt, M. (1997). Improving the preparation for fieldwork with ‘it’: two examples from physical geography. Journal of Geography in Higher Education, 21(3), 333–347.
- Zhang, Y., & Wildemuth, B. M. (2017). Applications of Social Research Methods to Questions in Information and Library Science. Libraries Unlimited.