
Abstract
The Internet has been massively utilized for educational purposes during the last ten years with many platforms, including e-Learning Services (e-LS). This survey study aimed to report factors affecting the intention to use e-LS in the Indonesian Open University (OU) context. The original technology acceptance model (TAM) was extended, involving seven variables: facilitating conditions, perceived enjoyment, subjective norms, perceived ease of use, usefulness, attitudes, and intention to use. The survey questionnaire was piloted prior to the main data collection. Through random sampling, 2787 out of 341,956 Indonesian OU students responded to the questionnaire. The main data were analyzed through partial least square structural equation modeling (PLS-SEM) procedures. For predicting intention to use e-LS, the strongest affecting factor is attitudes. Subjective norms play a bigger than perceived usefulness in predicting intention to use. In predicting attitudes, perceived ease of use is the strongest predictor, followed by perceived usefulness. Subjective norms, facilitating conditions, and perceived enjoyment are significant predictors of perceived usefulness and perceived ease of use. Recommendations were elaborated for all stakeholders: researchers, tutors, policymakers, and OU students.
1. Introduction
Significant educational changes have occurred in the past few decades, particularly in remote education, where the setting necessitates technology use. Technological tools have transformed classroom instruction that enhance higher-order thinking, problem-solving skills, and instructional efficacy. The Internet, which includes cross-platform apps, social media, and messaging services, is among the most frequently utilized resource. Electronic learning (e-learning) sources, such as Coursera, Moodle, EdX, and Blackboard Learn Collaborate, offer online learning opportunities. E-learning is the delivery of knowledge and instructions to users using computer technology platforms, typically via the Internet (Wang et al., Citation2010). It encompasses a variety of applications and procedures, including websites, online videos, and audio (Hassenburg, Citation2009; Sewandono et al., Citation2022). Factors like participation, curiosity, modeling, and experience are included in the experiential e-learning aspects (Gao et al., Citation2021). The system and tools have facilitated time and location limitations. Moodle, for example, enables effective and efficient online learning materials such as text documents, photos, slideshows, sound, and video content, as well as the use of lexicons, blogs, databases, and dynamic communication via forums.
Integrating these platforms and resources facilitated the achievement of the instructional goals conditioned. To reveal findings from diverse cohorts, students’ opinions of the e-Learning Services (e-LS) are important with regard to drawing perspectives on the technology acceptance. For e-LS use in education, many studies have been conducted on users’ perceptions (Chang et al., Citation2020; Hwang & Kim, Citation2022; Panjaburee et al., Citation2022; Ritzhaupt, Citation2019). However, a few studies explored factors affecting e-learning in Indonesian education (Amka & Dalle, Citation2022; Pangarso & Setyorini, Citation2023; Prasetyanto et al., Citation2022; Sukendro et al., Citation2020). For example, Sukendro et al. (Citation2020) investigated the use of e-learning in the context of sports sciences during Covid-19. Empirical research was also limited to exploring the use for certain contexts and settings, including the Open University (OU) context (Bubou & Job, Citation2022; Jawad & Shalash, Citation2020). Even fewer studies explored e-learning use in Indonesian OU (Rojabi, 2020; Santoso et al., Citation2022; Zuhairi et al., 2020) Zuhairi et al. (2020) reported through qualitative study about open and distance learning while Rojabi (2020) focused on the perceptions of English as a foreign language student on e-learning. To fill the gaps, this study explores Indonesian OU students’ perceptions from all fields of studies of e-LS through survey and inferential statistics of PLS-SEM (Habibi et al., Citation2022). Specifically, we investigated online-based services offered in Indonesian OU; digital library, online tutorial, dry lab, self-training portal, and Indonesia cyber education (ICE) institute. To meet the purposes, we extended the original technology acceptance model (TAM), a research question based on the objectives are:
What are the factors affecting the intention to use e-LS?
2. Literature review
Distance learning is not a new concept in higher education. It originated as a correspondence course in the early 18th century to enable students to complete their education without being on-site. It has evolved and gained popularity ever since, particularly with the fast advancement of technology and digitalization (Pregowska et al., Citation2021). Other remote educational programs have also emerged, such as blended learning, a mixture of traditional and technology-facilitated instruction that delivers a resilient and approachable student experience (Zaman et al., Citation2021; Zaugg et al., Citation2021). Many higher education institutions employ distance learning to keep up with the current COVID-19 epidemic (Kawaguchi-Suzuki et al., Citation2020; Saxena et al., Citation2021) that the quality should be studied (Saxena et al., Citation2021). Countries are required to take COVID-19 prevention measures, such as stopping face-to-face learning (Baber, Citation2020; Baber, Citation2021a). Baber (Citation2021a) explored the social interaction regarding online learning during the pandemic due to the existence of social distancing norms. In response to this significant shift, higher education institutions launched distance learning programs, employing available academic support tools such as social media, blogs, and LMS (Aristeidou & Cross, Citation2021). Open universities have had a long history of implementing distance learning. Over several eras, open universities have progressed. Education was presented via correspondence in the first era; broadcast radio and television in the second era; teleconferencing in the third era; and finally, the Internet and websites are prominent and important tools for open universities in the current technology era (Moore & Ve Kearsley, Citation2012). The technological advances should be followed by the improvement of e-Learning services (e-LS) in Indonesian OU.
2.1. E-Learning services: Indonesian open university
In the Indonesian OU, five types of e-LS are offered: digital library, online tutorial, dry lab, self-training portal, and ICE institute. Indonesian UT’s digital library (https://www.pustaka.ut.ac.id/lib/) provides information on various fields of knowledge, especially those relevant to the study programs (UT, Citation2022a). The library is also designed as a reference material resource for the entire academic community for developing teaching materials, tutors, and others. Today, the library collection has more than 30 thousand titles, consisting of textbooks, references, modules, documents, research reports, theses, and dissertations, in printed and digital forms. The digital library also collects recorded audio and video materials. Online tutorials that can be accessed through https://elearning.ut.ac.id/ is a platform for tutors and students to conduct the teaching and learning process; it is the Indonesian OU learning management system (UT, Citation2022b). This service provides applications for online activities, e-learning programs, and training content. It functions as a self-guided service to collect and deliver learning content quickly.
Dry lab or dry laboratories, https://www.ut.ac.id/drylab/drylab/index.html, is an online-operated laboratory of Indonesian OU (UT, Citation2022c). Through this facility, practicum can be done with simulation via computers and smartphones. The self-training portal on https://lm.ut.ac.id/ is a web-based training center for self-learning initiatives and motivation (UT, Citation2022d). The last service offered by Indonesian OU is the Indonesia Cyber Education (ICE) institute; ICE is an online learning center accredited by the Indonesian Ministry of Education and Culture. This online application provides a variety of online lectures from universities and online learning providers throughout Indonesia. The objective is to facilitate the provision of quality education while ensuring the quality of online learning and distance education services. Users can choose suitable online courses for career development in the Industry 4.0 era through the ICE, accessible at http://icei.ac.id/tracks/about/ (ICEI, Citation2022).
2.2. Conceptual framework of the study
TAM has been heavily criticized, prompting the original proposers to attempt to reinterpret it multiple times. It has been criticized for its dubious heuristic value, weak explanatory and predictive power, triviality, and lack of practical utility (Chuttur, Citation2009). While TAM has drawn attention away from other significant research questions and produced the illusion of progress in knowledge acquisition, various scholars have made individual efforts to broaden TAM to accommodate continually evolving technology settings; these have resulted in theoretical disarray and uncertainty (Benbasat & Barki, Citation2007).
TAM has remained a beneficial framework in line with various studies that have been performed into the factors that affect the intention to use technology. Many studies have successfully adapted TAM. When typing “technology acceptance model (TAM) in education” in Springer’s article search link (https://link.springer.com/search), 156 articles emerged. In the ScienceDirect database (https://www.sciencedirect.com/), more papers were found (287 articles). The search results (e.g., Drigas et al., Citation2020; Kabir et al., Citation2022; Lang & Hofer-Fischanger, Citation2022) prove that TAM is still considered one of the most prominent models for technology acceptance. Hence, the current study adapted the original model (Davis, Citation1989) with four core variables (perceived ease of use, perceived usefulness, attitudes, and intention to use). The theory suggests that people’s perceptions of a system’s usefulness and ease of use in the context of e-LS explain their behavioral intention to use it (Davis, Citation1989). The basic principle of TAM is that perceived ease of use predicts perceived usefulness. Additionally, the attitudes toward the system and its perceived usefulness influence the intention, defined as the degree to perform or not to perform a system for future activities (Davis, Citation1989).
To enhance its explanatory power, researchers have proposed extensions to the original TAM model (e.g., Alalwan et al., Citation2018; Gómez-Ramirez et al., Citation2019; Rizun & Strzelecki, Citation2020; Syahruddin et al., Citation2021). These extensions include adding extra variables to the model. By extending the TAM model, researchers can acquire a deeper knowledge of user acceptance and technological uptake. Besides the core TAM variables, three external variables were added: perceived enjoyment, facilitating conditions, and subjective norms. Indonesian people, or Asian in general, have high respect for other people’s opinions; therefore, subjective norms were included as an external factor (Habibi, Razak, et al., 2022). Similarly, facilitating conditions and perceived enjoyment are also grounded in the theory that should be analyzed in the Indonesian higher education context (Rizun & Strzelecki, Citation2020; Syahruddin et al., Citation2021). The institutional characteristics of Indonesian OU in implementing distance learning result in the importance of evaluating facilitating conditions. Enjoyment is also essential since the Internet has entertained many people, including Indonesian OU students.
2.3. Perceived Ease of Use, Perceived Usefulness, Attitudes, and Intention to Use
Perceived ease of use is defined as “the degree to which a person believes that using a particular system would be free of effort” (Davis, Citation1989). In the original TAM model, perceived ease of use is hypothesized to have a relationship with perceived usefulness and attitudes (Davis, Citation1989). Recent survey studies have reported that perceived ease of use is significantly linked with perceived usefulness and attitudes (Baber, Citation2021b; Hanham et al., Citation2021; Mutambara & Bayaga, Citation2021; Rizun & Strzelecki, Citation2020; Zardari et al., Citation2021). Baber (Citation2021b) explored the roles of perceived ease of use in affecting the behavioral intention of students to accept and use e-learning. Mutambara and Bayaga (Citation2021), who conducted a survey involving 550 students, emphasized the significant role of perceived ease of use in predicting perceived usefulness and attitudes regarding the use of mobile learning in STEM education. Another study by Sukendro et al. (Citation2020) presented similar results; perceived ease of use significantly affected the perceived usefulness and attitudes of Indonesian sport science students’ use of e-learning during Covid-19. On the other hand, perceived ease of use was insignificant in affecting perceived usefulness (Hanham et al., Citation2021). Two hypotheses (H8 and H9) are included regarding the role of perceived ease of use in affecting perceived usefulness and attitudes.
H8: Perceived ease of use will significantly affect perceived usefulness.
H9: Perceived ease of use will significantly influence attitudes.
Perceived usefulness, or “the degree to which a person believes that using a particular system would enhance his or her job performance” (Davis, Citation1989), is hypothesized to be the significant predictor of attitudes (H10) and intention to use (H11) e-LS. Previous research also revealed that perceived usefulness has a significant role in predicting technology integration in education (Mutambara & Bayaga, Citation2021; Racero et al., Citation2020; Rizun & Strzelecki, Citation2020; Sukendro et al., Citation2020; Zardari et al., Citation2021). Rizun and Strzelecki (Citation2020), who explored distance education during the COVID-19 pandemic, found that both attitudes and behavioral intention were influenced by perceived usefulness. Sukendro et al. (Citation2020 found an insignificant correlation between perceived usefulness and perceived ease of use.
H10: Perceived usefulness will be significant in predicting attitudes.
H11: Perceived usefulness will be significant in affecting intention to use.
Attitudes refer to users’ particular behavior toward using a system (Davis, Citation1989). In TAM, attitudes are expected to affect intention to use (users’ desire to use a system). Within the current study context, attitudes toward e-LS use among Indonesian OU students are hypothesized to influence intention to use e-LS (H12). Prior survey studies have explored the relationship between attitudes and intention to use (Racero et al., Citation2020; Rizun & Strzelecki, Citation2020; Sukendro et al., Citation2020; Syahruddin et al., Citation2021; Zardari et al., Citation2021). For instance, Rizun and Strzelecki (Citation2020) revealed that attitudes are vital in affecting the behavioral intention of distance learning perceived by Polish undergraduate and graduate students at Katowice University. In the Indonesian context, Syahruddin et al. (Citation2021) and Sukendro et al. (Citation2020) disclosed the important role of attitudes on intention to use e-learning among Sports Science students.
H12: Attitudes will significantly affect intention to use.
2.4. External Variables; Perceived Enjoyment, Facilitating Conditions, And Subjective Norms
Perceived enjoyment is the degree to which the action of system implementation is understood to be pleasurable (Venkatesh & Speier, Citation1999). An enjoyment system among users could be a key factor in improving user-friendly feelings and benefits that improves user desire to use the system. In this study, perceived enjoyment is hypothesized to influence perceived ease of use (H2) and perceived usefulness (H1). Prior research has shown that user perceptions of the easiness of using a system were affected by the degree of enjoyment they possess when adopting a system (Rizun & Strzelecki, Citation2020; Syahruddin et al., Citation2021). Researchers have also revealed a significant positive link between enjoyment and perceived usefulness, encouraging users’ intention to use the system (Alalwan et al., Citation2018; Rizun & Strzelecki, Citation2020; Syahruddin et al., Citation2021).
H1: Perceived enjoyment will have a significant correlation with perceived usefulness.
H2: Perceived enjoyment will have a significant correlation with perceived ease of use.
Facilitating conditions are the degree to which someone believes the provided organizational and technical infrastructures encourage and facilitate technology integration. In this study context facilitating conditions were used as a degree to which Indonesian OU students believe that institutions facilitate support for using e-LS (Venkatesh & Davis, Citation2000); it is hypothesized that perceived ease of use and perceived usefulness (H3 and H4) facilitating conditions can be infrastructure support, technical availability, professional development opportunity, and policies to support e-LS use within the context of Indonesian OU. A positive correlation between facilitating conditions and perceived ease of use was disclosed by prior researchers (Muhaimin et al., Citation2019; Nikou & Economides, Citation2019; Sukendro et al., Citation2020). Similarly, facilitating conditions were also significant in predicting perceived usefulness (Sukendro et al., Citation2020; Teo et al., Citation2019).
H3: Facilitating conditions will have a significant relationship with perceived ease of use.
H3: Facilitating conditions will have a significant relationship with perceived usefulness.
Subjective norms refer to the belief that an important person or group will approve and encourage a particular behavior. Subjective norms are determined by the perceived social pressure from others for an individual to behave in a certain manner and their motivation to comply with those people’s views (Ajzen, Citation1991). Subjective norms in this study are students’ beliefs that their important people would encourage e-LS use in Indonesian OU. The findings of prior studies also informed that subjective norms have a significant correlation with perceived ease of use, perceived usefulness, and intention to use (Abdullah et al., Citation2016; Gómez-Ramirez et al., Citation2019; Muhaimin et al., Citation2019). Therefore, three hypotheses (H5, H6, and H7) were proposed to confirm the significant role of subjective norms in affecting perceived ease of use and perceived usefulness.
H5: Subjective norms will be significant in affecting perceived usefulness.
H6: Subjective norms will significantly predict perceived ease of use.
H7: Subjective norms will significantly influence intention to use.
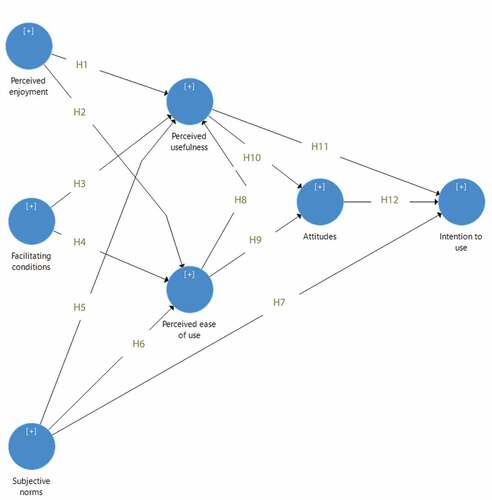
Figure Alt Text: Conceptual model of the study, extended TAM, that consists of seven latent variables and twelve hypotheses to measure factors affecting e-learning services within the context of Indonesian OU.
Figure 1. Caption: Conceptual model of the study.
3. Methods
This study was conducted through a survey in the Indonesian OU. A case-study survey approach was implemented since the study involved one higher education institution. Surveys have general capabilities when it comes to portraying a large group of individuals. The evidence gained gives a more precise picture of the larger population’s relative attributes due to the significant number of students participating in surveys (Evans & Mathur, Citation2005).
3.1. Instrumentation
Prior studies assist the current instrumentation process in defining and analyzing thoughts and ideas connected to the ground theory foundation and instruments. The instrument was created to achieve the research objectives. The characteristics that affect students’ intention to utilize e-LS were assessed using an adapted questionnaire in this study (Rizun & Strzelecki, Citation2020; Sabah, Citation2016; Venkatesh et al., Citation2008, Citation2003). The indicators varied and were constructed to suit distance education and e-LS situations. The new measure for the present study was developed based on the adaption procedure. During the initial set-up processes, twenty-nine indicators were adapted. After completing the content validity procedure, the indicators were evaluated by five experts in educational technology and policy through videoconferencing to verify that the measure was suitable for the study’s purposes and setting (Lynn, Citation1986). Following the discussion, 11 items were revised. Three others, on the other hand, were removed as the experts recommended; the three items dropped were facilitating conditions (FC5), perceived enjoyment (PE5), and subjective norms (SN5).
3.2. Data collection
The questionnaire (n. 101) was piloted using a Cronbach alpha test for reliability assessment. With alphas of >.700, all factors were considered reliable. After the pilot study, the final questionnaires were revised and administered. The study population includes all Indonesian OU students (n. 341,956). Through quota sampling, an online survey with Google forms was utilized for data collection. Quota sampling is a type of non-probability sampling that relies on the non-random selection of a predefined number or percentage of responses (Moser, 1952; Yang and Banamah, 2014). The questionnaire was shared from 1 September 2021, and it remained available until 30 September 2021; most responses were received during the first week. We predefined the samples to be more than 2500 responses since the survey was sent out to all 341,956 students’ email with the help of the administration staff of Indonesian OU. We closed the acceptance of the new responses since the expected responses reached more than 2800 in the fourth week of the distribution. For the level of data generalization, the obtained responses exceeded 1000, meaning that they can represent the total population. Further, a sample size estimation is the 10-times rule method for PLS-SEM; the sample size should be greater than ten times the maximum number of inner or outer model arrows of all latent variables. With 12 paths included in this study, the minimum sample size is 120 (Hair et al., 2019).
3.3. Data analysis
PLS-SEM techniques (measurement and structural model) were computed for the main data analysis (Akter et al., Citation2017; Habibi et al., Citation2022; Shmueli et al., Citation2019). The measurement model was created to test the model’s reliability and validity by assessing reflective indicator loadings, internal consistency reliability, convergent validity, and discriminant validity. When the loadings exceed .500, the construct is responsible for a large proportion of the metric (Noor et al., 2019). Further, the constructs’ internal consistency reliability was examined; values should range from .700 to .950 for Cronbach’s alpha (α) and Rho_A (Hair et al., Citation2022). Convergent validity was measured through average variance extracted (AVE) connected to a certain construct. The AVE should be at least .500 (Shmueli et al., Citation2019), accounting for ≥ 50% of the variation. Discriminant validity was assessed to indicate how empirically distinct a variable is from the others. The heterotrait–monotrait ratio of correlations was used as the most robust assessment for discriminant validity; values of .900 are considered thresholds (Palos-Sanchez et al., Citation2019). Cross-loading and Fornell–Larcker criteria were computed to support the heterotrait–monotrait findings. The item’s outer loadings should be greater than all cross-loadings on the other constructs. The AVE of every construct in this study is higher than its shared variance, a criterion for discriminant validity in the Fornell–Larcker context (Fornell & Larcker, Citation1981).
The structural model was examined following the measurement model. The structural model investigates structural theory, which requires the links between latent variables. Some metrics were provided to analyze the structural model (Romo-González et al., Citation2018), such as statistical significances, the coefficient of determination (R2), and effect sizes (f2; Dijkstra & Henseler, Citation2015; Henseler et al., Citation2015). The path coefficient symbolized by β, t-value, and p-value are informed in examining the statistical significance. The recommendation of t-values of 1.96 at p < .05 is the minimum criterion for a correlation that can be concluded as significant. To understand each statistical significance value, we estimated the criteria recommendation through PLS-SEM bootstrapping with 5,000 subsamples.
4. Findings
An online survey was addressed to active Indonesian OU students. We received 2854 responses, of which 67 of them were dropped because of missing data. Eventually, the data analysis covered 2787 data. There are 419 male students and 2368 female respondents in the sample. Two thousand and twenty-three students reside in cities, while 764 reside in the suburbs. Table presents a complete list of the respondents’ information.
Table 1. Demographic information (n. 2787)
4.1. Measurement model
All variables, having univariate data, were normally distributed. Skewness and kurtosis fell within the threshold range from −2 to +2 (Darren & Paul, Citation1999). Skewness values range from −.741 to −.337, and kurtosis varies between −.070 and .797 (). When the data were normally distributed, the measurement model was processed. Loading values from the computation exceed the thresholds of >.500 (Md Noor et al., Citation2019); the lowest value is AT3 (.842), while the highest value is PE2 (.953). Values of Cronbach’s alpha or α (from .843 to .939) and Rho_A (.868 to .939 are satisfactory based on the threshold (.700 to .950). For convergent validity, AVE values are informed to be greater than .500 (Shmueli et al., Citation2019), from .758 (Attitudes) to .950 (Subjective norms).
Table 2. Skewness, Kurtosis, Loading, reliability, and Average Variance Extracted (AVE)
All values of heterotrait–monotrait are below .900 (Franke & Sarstedt, Citation2019), ranging from .741 to 888. In addition, the item’s outer loadings (bold and italic) for each variable were greater than all cross-loadings on the other constructs (Shmueli et al., Citation2019). For instance, AT1 in attitudes gained the highest loading value (.880) when compared to their cross-loading variables (FC = .745, IU = .738, PEoU = .722, PE = .792, PU = .726, and SN = .769). The AVE of every construct in this study is higher than its shared variance, a criterion for Fornell–Larcker (Fornell & Larcker, Citation1981). From the criteria of heterotrait–monotrait, cross-loading, and Fornell-Larcker, the discriminant validity emerges (Campbell & Fiske, Citation1959; Franke & Sarstedt, Citation2019; Henseler et al., Citation2015). The discriminant validity of the variables is tabulated in Tables , Table , and Table .
Table 3. Heterotrait–monotrait
Table 4. Cross-loading
Table 5. Fornell-Larcker
4.2. Structural Model
In examining the statistical significance, the path coefficient symbolized by β, t-value, and p-value are recommended (Hair et al., Citation2022; Henseler et al., Citation2015). The recommendation of t-values of 1.65 at p < .05 is the minimum criterion for a significant correlation. To understand each statistical significance value, we estimated the criteria recommendation through PLS-SEM bootstrapping with 5,000 subsamples (Manley et al., Citation2020; Shmueli et al., Citation2019). All hypotheses are confirmed. For the prediction of intention to use e-LS, the strongest affecting factor is attitudes (β = .278; t = 11.483; p < . 001). Meanwhile, subjective norms (β = .308; t = 11.214; p < . 001) have a slightly better role than perceived usefulness in predicting intention to use (β = .259; t = 10.850; p < . 001). Regarding the factors predicting attitudes, perceived ease of use (β = .471; t = 15.469; p < . 001) is the strongest predictor, followed by perceived usefulness (β = .308; t = 9.941; p < . 001). Subjective norms as one of the external factors also play a significant role in predicting perceived usefulness (β = .119; t = 4.957; p < . 001) and perceived ease of use (β = .301; t = 11.9871; p < . 001). Similarly, facilitating conditions have also significantly influenced perceived usefulness (β = .078; t = 3.235; p < . 01) and perceived ease of use (β = .247; t = 9.023; p < . 001). Perceived enjoyment is a significant predictor of perceived usefulness (β = .210; t = 7.813; p < . 01) and perceived ease of use (β = .329; t = 12.394; p < . 001). Detailed information about all direct relationships proposed in this study can be seen in Table .
Table 6. Significance level and effect sizes
Besides the direct effects, the total indirect effects of the external variables on the intention to use e-LS among Indonesian OU students were also informed. Perceived ease of use has the most significant relationship with intention to use e-LS (β = .316; t = 16.139; p < . 001), followed by perceived enjoyment (β = .177; t = 10.990; p < . 001). The weakest total indirect effect emerges between facilitating conditions and intention to use (β = .105; t = 8.459; p < . 001).
The coefficient of determination (R2) is defined as the measurement of predictive accuracy. The R2 is computed as the squared correlation among certain endogenous variables (Chicco et al., Citation2021). The R2 values are between 0 and 1. A higher value indicates a higher level of R2 (.75 as substantial, .50 as moderate, and .25 as weak; Habibi et al., Citation2021). Figure exhibits the current results of R2; perceived ease of use (.661, moderate), perceived usefulness (.734, substantial), attitudes (.557, moderate), and intention to use (.603, moderate). The effect sizes or f2 (Lorah, Citation2018) assess the effect of a predicting variable on endogenous variables (.02 as a small effect, .15 as a medium effect, and .35 as a large effect). All exogenous predictors gain effect sizes to their endogenous (Table ). The strongest f2 is the effect of perceived ease of use on perceived usefulness (.344), while the lowest effect is between subjective norms and perceived usefulness (.014).
Figure 2. Caption: Final model of the study.
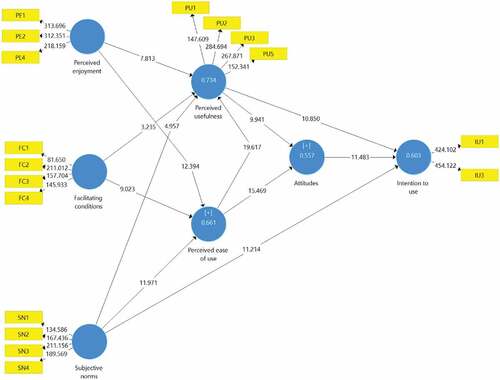
Figure Alt Text: Final model of the study informs that all hypotheses are confirmed that the most significant relationship emerged between perceived ease of use and attitudes, while the weakest exists between facilitating conditions and perceived usefulness.
5. Discussion
The extended TAM applied in the proposed model of the current study has succeeded in explaining the intention to use e-LS (digital library, online tutorial, dry lab, self-training portal, and ICE institute) perceived by Indonesian OU students through the content validity and measurement model processes. Similar validation processes were also carried out that resulted in a valid and reliable model for each study (Hsu & Chang, Citation2013; Rejón-Guardia et al., Citation2020; Zardari et al., Citation2021). The specific program, UT, included in the current study, focuses on a certain institution that can maximize the research on the related field of study. Future researchers are expected to use this study’s valid and reliable data to perform research in other contexts and settings. Valid and reliable data could significantly contribute to academia, especially in terms of the survey as a methodological approach and SEM as the statistical analysis (Davis & Stazyk, Citation2017).
According to the result of the computation, all hypotheses were confirmed. Perceived usefulness and perceived ease of use are significantly affected by perceived enjoyment, supporting hypotheses 1 and 2. The more students enjoy the use of e-LS in Indonesian UT, the better their perceived usefulness and perceived ease of use of e-LS are. Prior studies have also confirmed that perceived enjoyment had a significant role in predicting perceived usefulness and perceived ease of use (Mallya et al., Citation2019). These findings underscore the importance of encouraging fun feeling in students to use e-LS in improving the benefits and easiness of using e-LS in the context of Indonesian OU (Alalwan et al., Citation2018; Rizun & Strzelecki, Citation2020; Syahruddin et al., Citation2021). Further, facilitating conditions (organizational and technical infrastructures and resources) significantly predict perceived usefulness and perceived ease of use, confirming hypotheses 3 and 4. Facilitating conditions such as proper devices, a well-maintained environment, and Internet access could facilitate e-LS use among Indonesian OU students. The facilitating conditions also boost the positive impacts of intention to use e-LS, suggesting the advantages for the students to use e-LS. The findings are comparable to that of prior studies reporting the important role of resources and infrastructures in improving easiness (Muhaimin et al., Citation2019; Nikou & Economides, Citation2019; Sukendro et al., Citation2020) and benefits (Sukendro et al., Citation2020; Teo et al., Citation2019) of using technology in education. In addition, subjective norms significantly predict perceived usefulness, perceived ease of use, and intention to use e-LS. The community-based cultures of Indonesian people might contribute to these findings. Social encouragement from students’ important people should be perceived as important in shaping how Indonesian OU students use e-LS, the easiness, benefits, and intention to use. The findings support prior studies that revealed subjective norms as one of the significant variables predicting technology use (Abdullah et al., Citation2016; Gómez-Ramirez et al., Citation2019; Muhaimin et al., Citation2019). Three hypotheses (H5, H6, and H7) are confirmed.
Perceived ease of use is a significant predictor of perceived usefulness. Similar reports on the significant role of perceived ease of use on perceived usefulness have also been revealed from prior research (Hanham et al., Citation2021; Mutambara & Bayaga, Citation2021; Racero et al., Citation2020; Rizun & Strzelecki, Citation2020; Zardari et al., Citation2021). Further, perceived ease of use was also informed to be significant in predicting perceived usefulness (Muhaimin et al., Citation2019). A possible reason might be that Indonesian OU students’ perceived ease of use is a significant factor in fostering academic achievement. The structural model also informed that perceived ease of use and perceived usefulness have a significant correlation with attitudes, in which both variables have medium and large f2 values on attitudes. The findings are coherent with prior phenomena (Hanham et al., Citation2021; Mutambara & Bayaga, Citation2021; Zardari et al., Citation2021) and indicate the ease of use and benefits of e-LS encourage the respondents’ attitudes towards e-LS use. Finally, intention to use e-LS is significantly predicted by perceived usefulness and attitudes in which attitudes have more effect sizes (f2 = .075) on intention to use e-LS than perceived usefulness (f2 = .070). The findings confirm prior studies on technology adoption in education in terms of online instruction (Hanham et al., Citation2021; Racero et al., Citation2020; Rizun & Strzelecki, Citation2020; Sukendro et al., Citation2020; Syahruddin et al., Citation2021; Zardari et al., Citation2021). Encouraging and motivating Indonesian OU students’ perceived usefulness and attitudes towards the use of e-LS are very important to trigger and improve either the intention to use or actual e-LS use.
Theoretically, this work is valuable from an academic standpoint since it expands the quantitative comprehension of the behavioral intention to use e-LS in an OU. The study contributes to the literature review on the acceptance of e-LS (digital library, online tutorial, dry lab, self-training portal, and ICE institute) by Indonesian OU students should be further investigated. This survey report on the extension of the TAM could be useful to future researchers interested in similar topics. In the context of Indonesian higher education, it focuses on the survey instrument’s reliability and validity as the robustness and interpretability of the hypothesized extended TAM model to estimate behavioral intention to use e-LS. Other data collection approaches, such as in-depth interviews, observations, and experiments, can be conducted to elaborate more on the e-LS use phenomena.
Practically, the results of this analysis help students understand how students use e-LS during their learning, which would influence their learning behavior and acceptance in the future. This study’s postulated correlations between variables will guide teachers who wish to apply e-LS in their classrooms. The study also implicates the improvement of user intention to use e-LS. All stakeholders should collaborate to improve users’ attitudes, perceived usefulness, subjective norms, perceived ease of use, and perceived enjoyment. One of the best ways to improve attitudes is to promote e-LS use. Promoting the e-LS is the responsibility of all stakeholders, such as teachers and policymakers. Group learning is also important to improve peer influence for e-LS; connections and knowledge exchange among students and between students and tutors would facilitate a good learning environment. The effectiveness, clarity, efficiency, and simplicity of e-LS should always be maintained to improve students’ perceived usefulness, perceived ease of use, and facilitating conditions. Finally, support from higher education institutions, such as infrastructure, tools, and human resources, is critical to improving users’ intention to use e-LS during teaching and learning activities.
6. Conclusions
This work provided an insightful and meaningful understanding of Indonesian Indonesian OU students’ intention to use e-LS, digital library, online tutorial, dry lab, self-training portal, and ICE institute. A proposed model based on extended TAM with twelve research hypotheses was validated, tested, and reported with a sample of 2787 students at the Indonesian OU. Perceived ease of use, perceived usefulness, and attitudes were investigated as three core variables of TAM. The model also includes three extended variables: perceived enjoyment, facilitating conditions, and subjective norms. We adapted variables from prior studies; the findings support all twelve hypotheses. All relationships between variables are significant. As far as we know, these empirical findings are among the pilot academic work on e-LS acceptance in the Indonesian OU context. Thus, the findings could support researchers and practitioners in guiding their future projects in promoting e-LS; research with design and development, observation, and qualitative method should always be encouraged to improve online learning. Some limitations, however, also emerged from this study. The study only examined the hypotheses with Indonesian OU students as respondents in one country. Thus, comparative studies between two or more regions or countries are suggested for future research. More diverse respondents are recommended to explore research in other contexts and settings. The tests were undertaken only for the measurement and structural model. Demographic information could be involved in future studies with tests of differences.
Research data
The datasets (instrument and raw data) are available on https://figshare.com/s/e3c1073c0941581f5f54
Disclosure statement
No potential conflict of interest was reported by the author(s).
Additional information
Funding
References
- Abdullah, F., Ward, R., & Ahmed, E. (2016). Investigating the influence of the most commonly used external variables of TAM on students’ Perceived Ease of Use (PEOU) and Perceived Usefulness (PU) of e-portfolios. Computers in Human Behavior, 63, 75–17. https://doi.org/10.1016/j.chb.2016.05.014
- Ajzen, I. (1991). The theory of planned behavior. Organizational Behavior and Human Decision Processes, 50(2), 179–211. https://doi.org/10.1016/0749-5978(91)90020-T
- Akter, S., Fosso Wamba, S., & Dewan, S. (2017). Why PLS-SEM is suitable for complex modelling? An empirical illustration in big data analytics quality. Production Planning and Control, 28(11–12), 1011–1021. https://doi.org/10.1080/09537287.2016.1267411
- Alalwan, A. A., Baabdullah, A. M., Rana, N. P., Tamilmani, K., & Dwivedi, Y. K. (2018). Examining adoption of mobile Internet in Saudi Arabia: Extending TAM with perceived enjoyment, innovativeness and trust. Technology in Society, 55, 100–110. https://doi.org/10.1016/j.techsoc.2018.06.007
- Amka, A., & Dalle, J. (2022). The Satisfaction of the Special Need’ Students with E-Learning Experience During COVID-19 Pandemic: A Case of Educational Institutions in Indonesia. Contemporary Educational Technology, 14(1), 1–19. https://doi.org/10.30935/cedtech/11371
- Aristeidou, M., & Cross, S. (2021). Disrupted distance learning: The impact of Covid-19 on study habits of distance learning university students. Open Learning, 36(3), 263–282. https://doi.org/10.1080/02680513.2021.1973400
- Baber, H. (2020). Determinants of students’ perceived learning outcome and satisfaction in online learning during the pandemic of COVID-19. Journal of Education and e-learning Research, 7(3), 285–292. https://doi.org/10.20448/journal.509.2020.73.285.292
- Baber, H. (2021a). Modelling the acceptance of e-learning during the pandemic of COVID-19-A study of South Korea. The International Journal of Management Education, 19(2), 100503. https://doi.org/10.1016/j.ijme.2021.100503
- Baber, H. (2021b). Social interaction and effectiveness of the online learning–A moderating role of maintaining social distance during the pandemic COVID-19. Asian Education and Development Studies, 11(1), 159–171. https://doi.org/10.1108/AEDS-09-2020-0209
- Benbasat, I., & Barki, H. (2007). Quo vadis, TAM? Journal of the Association for Information Systems, 8(4), 211–218. https://doi.org/10.17705/1jais.00126
- Bubou, G. M., & Job, G. C. (2022). Individual innovativeness, self-efficacy and e-learning readiness of students of Yenagoa study centre, National Open University of Nigeria. Journal of Research in Innovative Teaching & Learning, 15(1), 2–22. https://doi.org/10.1108/JRIT-12-2019-0079
- Campbell, D. T., & Fiske, D. W. (1959). Convergent and discriminant validation by the multitrait-multimethod matrix. Psychological Bulletin, 56(2), 81–105. https://doi.org/10.1037/h0046016
- Chang, C. C., Liang, C., & Chiu, Y. C. (2020). Direct or indirect effects from “perceived characteristic of innovation” to “intention to pay”: Mediation of continuance intention to use e-learning. Journal of Computers in Education, 7(4), 511–530. https://doi.org/10.1007/s40692-020-00165-6
- Chicco, D., Warrens, M. J., & Jurman, G. (2021). The coefficient of determination R-squared is more informative than SMAPE, MAE, MAPE, MSE and RMSE in regression analysis evaluation. PeerJ Computer Science, 7, 1–24. https://doi.org/10.7717/PEERJ-CS.623
- Chuttur, M. (2009). Overview of the technology acceptance model: Origins, developments and future directions. Sprouts: Working Papers on Information Systems, 9(37), 9–37. https://aisel.aisnet.org/sprouts_all/290/
- Darren, G., & Paul, M. (1999). SPSS for windows step by step: A simple guide and reference. Pearson Education.
- Davis, F. D. (1989). Perceived usefulness, perceived ease of use, and user acceptance of information technology. MIS Quarterly: Management Information Systems, 13(3), 319–339. https://doi.org/10.2307/249008
- Davis, R. S., & Stazyk, E. C. (2017). Putting the methodological cart before the theoretical horse? examining the application of SEM to connect theory and method in public administration research. Review of Public Personnel Administration, 37(2), 202–218. https://doi.org/10.1177/0734371X17704268
- Dijkstra, T. K., & Henseler, J. (2015). Consistent and asymptotically normal PLS estimators for linear structural equations. Computational Statistics and Data Analysis, 81, 10–23. https://doi.org/10.1016/j.csda.2014.07.008
- Drigas, A., Dede, D. E., & Dedes, S. (2020). Mobile and other applications for mental imagery to improve learning disabilities and mental health. International Journal of Computer Science, 17(4), 18–23. https://doi.org/10.5281/zenodo.3987533
- Evans, J. R., & Mathur, A. (2005). The value of online surveys. Internet Research, 15(2), 195–219. https://doi.org/10.1108/10662240510590360
- Fornell, C., & Larcker, D. F. (1981). Evaluating structural equation models with unobservable variables and measurement error. Journal of Marketing Research, 18(1), 39–50. https://doi.org/10.2307/3151312
- Franke, G., & Sarstedt, M. (2019). Heuristics versus statistics in discriminant validity testing: A comparison of four procedures. Internet Research, 29(3). https://doi.org/10.1108/IntR-12-2017-0515
- Gao, H., Ou, Y., Zhang, Z., Ni, M., Zhou, X., & Liao, L. (2021). The relationship between family support and e-learning engagement in college students: The mediating role of e-learning normative consciousness and behaviors and self-efficacy. Frontiers in Psychology, 12, 1–9. https://doi.org/10.3389/fpsyg.2021.573779
- Gómez-Ramirez, I., Valencia-Arias, A., & Duque, L. (2019). Approach to M-learning acceptance among university students: An integrated model of TPB and TAM. International Review of Research in Open and Distance Learning, 20(3), 141–164. https://doi.org/10.19173/irrodl.v20i4.4061
- Habibi, A., Riady, Y., Al-Adwan, A. S., & Albelbisi, N. A. (2022). Beliefs and knowledge for pre-service teachers’ technology integration during teaching practice: An extended theory of planned behavior. Computers in the Schools, 0(0), 1–26. https://doi.org/10.1080/07380569.2022.2124752
- Habibi, A., Yaakob, M. F. M., Mukminin, A., Muhaimin, M., Prasojo, L. D., Yusop, F. D., & Muzakkir, M. (2021). Teachers’ digital technology access to motivation, skills and use: A structural equation modeling study. Aslib Journal of Information Management, 73(4), 543–559. https://doi.org/10.1108/ajim-11-2020-0382
- Hair, J., Hult, G. T. M., Ringle, C. M., & Sarstedt, M. (2022). PLS-SEM book: A Primer on PLS-SEM (3rd Ed.). Sage Publication.
- Hanham, J., Lee, C. B., & Teo, T. (2021). The influence of technology acceptance, academic self-efficacy, and gender on academic achievement through online tutoring. Computers and Education, 172, 1–14. https://doi.org/10.1016/j.compedu.2021.104252
- Hassenburg, A. (2009). Distance education versus the traditional classroom. Berkeley Scientific Journal, 13(1), 7–10. https://doi.org/10.5070/bs3131007609
- Henseler, J., Ringle, C. M., & Sarstedt, M. (2015). A new criterion for assessing discriminant validity in variance-based structural equation modelling. Journal of the Academy of Marketing Science, 43(1), 115–135. https://doi.org/10.1007/s11747-014-0403-8
- Hsu, H., & Chang, Y. (2013). Extended TAM model: Impacts of Convenience on Acceptance and Use of Moodle. US-China Education Review A, 3(4), 211–218.https://eric.ed.gov/?id=ED542974
- Hwang, S., & Kim, H. K. (2022). Development and validation of the e-learning satisfaction scale (eLSS). Teaching and Learning in Nursing, 00, 1–7. https://doi.org/10.1016/j.teln.2022.02.004
- ICEI. (2022). ICE institute. https://icei.ac.id/tracks/about/
- Jawad, Y. A. L. A., & Shalash, B. (2020). The Impact of E-Learning Strategy on Students’ Academic Achievement Case Study: Al-Quds Open University. International Journal of Higher Education, 9(6), 44–53. https://doi.org/10.5430/ijhe.v9n6p44
- Kabir, K. H., Hassan, F., Mukta, M. Z. N., Roy, D., Darr, D., Leggette, H., & Ullah, S. M. A. (2022). Application of the technology acceptance model to assess the use and preferences of ICTs among field-level extension officers in Bangladesh. Digital Geography and Society, 3, 1–13. https://doi.org/10.1016/j.diggeo.2022.100027
- Kawaguchi-Suzuki, M., Nagai, N., Akonoghrere, R. O., & Desborough, J. A. (2020). COVID-19 pandemic challenges and lessons learned by pharmacy educators around the globe. American Journal of Pharmaceutical Education, 84(8), 1–13. https://doi.org/10.5688/ajpe8197
- Lang, G., & Hofer-Fischanger, K. (2022). Factors associated with the implementation of health-promoting telework from the perspective of company decision makers after the first COVID-19 lockdown. Journal of Public Health, 00, 1–15. https://doi.org/10.1007/s10389-022-01717-z
- Lorah, J. (2018). Effect size measures for multilevel models: Definition, interpretation, and TIMSS example. Large-Scale Assessments in Education, 6(8), 1–11. https://doi.org/10.1186/s40536-018-0061-2
- Lynn, M. R. (1986). Determination and quantification of content validity. Nursing Research, 35(6), 382–386.https://doi.org/10.1097/00006199-198611000-00017
- Mallya, J., Lakshminarayanan, S., & Payini, V. (2019). Self-efficacy as an antecedent to students’ behavioral intention to use the Internet for academic purposes: A structural equation modeling approach. Library Philosophy and Practice, 3055, 1–13.https://digitalcommons.unl.edu/libphilprac/3055/
- Manley, S. C., Hair, J. F., Williams, R. I., & McDowell, W. C. (2020). Essential new PLS-SEM analysis methods for your entrepreneurship analytical toolbox. International Entrepreneurship and Management Journal, 17, 1805–1825. https://doi.org/10.1007/s11365-020-00687-6
- Md Noor, S., Rasoolimanesh, S. M., Jaafar, M., & Barghi, R. (2019). Inscription of a destination as a world heritage site and residents’ perceptions. Asia Pacific Journal of Tourism Research, 24(1), 14–30. https://doi.org/10.1080/10941665.2018.1541183
- Moore, M. G., & Ve Kearsley, G. (2012). Distance education: A systems view of online learning. Educational Review, 72(6), 800. https://doi.org/10.1080/00131911.2020.1766204
- Muhaimin, H., Mukminin, A., Pratama, A., Asrial, R., & Harja, H. (2019). Predicting factors affecting intention to use web 2.0 in learning: Evidence from science education. Journal of Baltic Science Education, 18(4), 595–606. https://doi.org/10.33225/jbse/19.18.595
- Mutambara, D., & Bayaga, A. (2021). Determinants of mobile learning acceptance for STEM education in rural areas. Computers and Education, 160, 1–16. https://doi.org/10.1016/j.compedu.2020.104010
- Nikou, S. A., & Economides, A. A. (2019). Factors that influence behavioral intention to use mobile-based assessment: A STEM teachers’ perspective. British Journal of Educational Technology, 50(2), 587–600. https://doi.org/10.1111/bjet.12609
- Palos-Sanchez, P. R., Robina-Ramirez, R., & Velicia-Martin, F. (2019). What role does corporate governance play in the intention to use cloud computing technology? Symmetry, 11(10), 1–19. https://doi.org/10.3390/sym11101253
- Pangarso, A., & Setyorini, R. (2023). The drivers of E-learning satisfaction during the early COVID-19 pandemic: Empirical evidence from an Indonesian private university. Cogent Education, 10(1), 2149226. https://doi.org/10.1080/2331186X.2022.2149226
- Panjaburee, P., Komalawardhana, N., & Ingkavara, T. (2022). Acceptance of personalized e-learning systems: A case study of concept-effect relationship approach on science, technology, and mathematics courses. Journal of Computers in Education, 00, 1–25. https://doi.org/10.1007/s40692-021-00216-6
- Prasetyanto, D., Rizki, M., & Sunitiyoso, Y. (2022). Online learning participation intention after COVID-19 pandemic in Indonesia: Do students still make trips for online class? Sustainability, 14(4), 1–18. https://doi.org/10.3390/su14041982
- Pregowska, A., Masztalerz, K., Garlińska, M., & Osial, M. (2021). A worldwide journey through distance education—from the post office to virtual, augmented and mixed realities, and education during the covid-19 pandemic. Education Sciences, 11(3), 1–26. https://doi.org/10.3390/educsci11030118
- Racero, F. J., Bueno, S., & Gallego, M. D. (2020). Predicting students’ behavioral intention to use open source software: A combined view of the technology acceptance model and self-determination theory. Applied Sciences, 10(8), 1–25. https://doi.org/10.3390/APP10082711
- Rejón-Guardia, F., Polo-Peña, A. I., & Maraver-Tarifa, G. (2020). The acceptance of a personal learning environment based on Google apps: The role of subjective norms and social image. Journal of Computing in Higher Education, 32(2), 203–233. https://doi.org/10.1007/s12528-019-09206-1
- Ritzhaupt, A. (2019). Measuring learner satisfaction in self-paced e-learning environments: Validation of the electronic learner satisfaction scale (eLSS). International Journal on E-Learning, 18(3), 279–299.https://www.learntechlib.org/primary/p/178466/
- Rizun, M., & Strzelecki, A. (2020). Students’ acceptance of the covid-19 impact on shifting higher education to distance learning in Poland. International Journal of Environmental Research and Public Health, 17(18). https://doi.org/10.3390/ijerph17186468
- Romo-González, J. R., Tarango, J., & Machin-Mastromatteo, J. D. (2018). PLS SEM, a quantitative methodology to test theoretical models from library and information science. Information Development, 34(5), 526–531. https://doi.org/10.1177/0266666918795025
- Sabah, N. M. (2016). Exploring students’ awareness and perceptions: Influencing factors and individual differences driving m-learning adoption. Computers in Human Behavior, 65, 522–533. https://doi.org/10.1016/j.chb.2016.09.009
- Santoso, H. B., Riyanti, R. D., Prastati, T., Susanty, A., & Yang, M. (2022). Learners’ Online Self-Regulated Learning Skills in Indonesia Open University: Implications for Policies and Practice. Education Sciences, 12(7), 469. https://doi.org/10.3390/educsci12070469
- Saxena, C., Baber, H., & Kumar, P. (2021). Examining the moderating effect of perceived benefits of maintaining social distance on e-learning quality during COVID-19 pandemic. Journal of Educational Technology Systems, 49(4), 532–554. https://doi.org/10.1177/0047239520977798
- Sewandono, R. E., Thoyib, A., Hadiwidjojo, D., & Rofiq, A. (2022). Performance expectancy of E-learning on higher institutions of education under uncertain conditions: Indonesia context. Education and Information Technologies, 1–28. https://doi.org/10.1007/s10639-022-11074-9
- Shmueli, G., Sarstedt, M., Hair, J. F., Cheah, J. H., Ting, H., Vaithilingam, S., & Ringle, C. M. (2019). Predictive model assessment in PLS-SEM: Guidelines for using PLSpredict. European Journal of Marketing, 53(11), 2322–2347. https://doi.org/10.1108/EJM-02-2019-0189
- Sukendro, S., Habibi, A., Khaeruddin, K., Indrayana, B., Syahruddin, S., Makadada, F. A., & Hakim, H. (2020). Using an extended Technology Acceptance Model to understand students’ use of e-learning during Covid-19: Indonesian sport science education context. Heliyon, 6(11), 1–9. https://doi.org/10.1016/j.heliyon.2020.e05410
- Syahruddin, S., Mohd Yaakob, M. F., Rasyad, A., Widodo, A. W., Sukendro, S., Suwardi, S., Lani, A., Sari, L. P., Mansur, M., Razali, R., & Syam, A. (2021). Students’ acceptance to distance learning during Covid-19: The role of geographical areas among Indonesian sports science students. Heliyon, 7(9), 1–9. https://doi.org/10.1016/j.heliyon.2021.e08043
- Teo, T., Sang, G., Mei, B., & Hoi, C. K. W. (2019). Investigating pre-service teachers’ acceptance of Web 2.0 technologies in their future teaching: A Chinese perspective. Interactive Learning Environments, 27(4), 530–546. https://doi.org/10.1080/10494820.2018.1489290
- UT. (2022a). Perpustakaan digital universitas terbuka. https://pustaka.ut.ac.id/lib/
- UT. (2022b). e-learning UT. https://elearning.ut.ac.id/
- UT. (2022c). UT dry lab. https://www.ut.ac.id/drylab/drylab/index.html
- UT. (2022d). Latihan madiri UT. https://lm.ut.ac.id/
- Venkatesh, V., Brown, S. A., Maruping, L. M., & Bala, H. (2008). Predicting different conceptualizations of system USE: The competing roles of behavioral intention, facilitating conditions, and behavioral expectation. MIS Quarterly: Management Information Systems, 32(3), 483–502. https://doi.org/10.2307/25148853
- Venkatesh, V., & Davis, F. D. (2000). Theoretical extension of the Technology Acceptance Model: Four longitudinal field studies. Management Science, 46(2), 186–204. https://doi.org/10.1287/mnsc.46.2.186.11926
- Venkatesh, V., Morris, M. G., Davis, G. B., & Davis, F. D. (2003). User acceptance of information technology: Toward a unified view. MIS Quarterly: Management Information Systems, 27(3), 425–478. https://doi.org/10.2307/30036540
- Venkatesh, V., & Speier, C. (1999). Computer technology training in the workplace: A longitudinal investigation of the effect of mood. Organizational Behavior And Human Decision Processes, 79(1), 1–28. https://doi.org/10.1006/obhd.1999.2837
- Wang, M., Ran, W., Liao, J., & Yang, S. J. H. (2010). A performance-oriented approach to e-learning in the workplace. Educational Technology and Society, 13(4), 167–179.https://www.jstor.org/stable/jeductechsoci.13.4.167
- Zaman, U., Aktan, M., Baber, H., & Nawaz, S. (2021). Does forced-shift to online learning affect university brand image in South Korea? Role of perceived harm and international students’ learning engagement. Journal of Marketing for Higher Education, (Online), 0(0), 1–25. https://doi.org/10.1080/08841241.2021.1998285
- Zardari, B. A., Hussain, Z., Arain, A. A., Rizvi, W. H., & Vighio, M. S. (2021). Development and validation of user experience-based e-learning acceptance model for sustainable higher education. Sustainability, 13(11), 1–17. https://doi.org/10.3390/su13116201
- Zaugg, H., Graham, C. R., Lim, C. P., & Wang, T. (2021). Current and future directions of blended learning and teaching in Asia. In C. P. Lim & C. R. Graham. Eds. Blended learning for inclusive and quality higher education in Asia (pp. 301–327). Springer. https://doi.org/10.1007/978-981-33-4106-7_16