
 ?Mathematical formulae have been encoded as MathML and are displayed in this HTML version using MathJax in order to improve their display. Uncheck the box to turn MathJax off. This feature requires Javascript. Click on a formula to zoom.
Abstract
The measurement of organizational satisfaction is a popular topic in organizational science; however, less attention is given to organizational happiness. There are very few measuring tools designed to evaluate organizational happiness. While the value-mediating role of higher education is indisputable, to the best of our knowledge, this is the first study to address organizational happiness in the context of higher education. In addition, this study proposes new data-driven approaches to analyze patterns of answers (i.e. regarding individual happiness); therefore, the relationships among individuals, groups, and organizational happiness can be better analyzed. This study is based on survey data; nevertheless, in addition to measuring organizational happiness in Hungarian higher education, this paper proposes using infrequently used data-driven approaches to determine who feels happy/unhappy in what areas.
Public interest statement
The measurement of organizational satisfaction is a popular topic in organizational science; however, less attention is given to organizational happiness. There are very few measuring tools designed to evaluate organizational happiness. While the value-mediating role of higher education is indisputable, to the best of our knowledge, this is the first study to address organizational happiness in the context of higher education. In addition, this study proposes new data-driven approaches to analyze patterns of answers (i.e., regarding individual happiness); therefore, the relationships among individuals, groups, and organizational happiness can be better analyzed. This study is based on survey data. The proposed approach has implications for scholars, practitioners, and decision-makers as well.
1. Introduction
Higher education institutions (HEIs) are integral parts of our society. Among their many functions, HEIs play an important role in transmitting values. This value transfer (Aldridge & Rowley, Citation1998; Limarev et al., Citation2019; Roohr et al., Citation2021) is achieved through services provided by HEIs. It is important to measure satisfaction not only in the business sector but also in the education sector (Alves & Raposo, Citation2007; Bassi, Citation2019; Hom, Citation2002; Kara & DeShields, Citation2004; Sipayung et al., Citation2019). However, notably, although several attempts have been made to measure satisfaction (Sen et al., Citation2020; Teeroovengadum et al., Citation2019), the utilized measurements are only partially suitable for defining the value transfer role of higher education. However, in our view, by placing the corresponding measurement logic within a broader framework, the value-transfer role of higher education can be comprehensively captured through a measurement of happiness. A more complete picture of this issue can be revealed if this measurement of happiness is extended to mapping not only students but also institutions through academics, as a strong interaction between them can be identified. Thus, the measurement of happiness can be used to conduct an overall systemic assessment of the experience of an HEI.
This study is about the possibility of researching and measuring happiness. For the sake of professionalism, it is worth clarifying the concepts that appear in the study and in the literature that underpin its theory. These are satisfaction, happiness and well-being. All three concepts are difficult to define, and there is no agreed-upon definition for any of them. Based on the literature approaches we have reviewed, we use these terms and their meanings in this paper as follows. Satisfaction is a mental or emotional state of satisfaction that is caused in someone’s state of being, body and mind by causing relief in these. When in a state of contentment, a person has accepted his or her situation (Graham et al., Citation2014). Happiness is an emotional state characterized by feelings of joy, satisfaction and fulfillment. It involves positive emotions and satisfaction with life. Since happiness is generally understood as a broad concept, psychologists and other social scientists usually use the term “subjective well-being” when talking about this emotional state (Nordenfelt, Citation1995). Subjective well-being generally focuses on an individual’s general personal feelings about his or her life in the present. It has two key components. Emotional balance refers to everyone experiencing both positive and negative emotions, feelings and moods. Happiness is generally associated with experiencing more positive emotions than negative emotions. Satisfaction with life refers to the extent to which a person feels satisfied with different aspects of his or her life, including his or her relationships, work, achievements and other things he or she considers important.
Following this logic, we will keep the following links in mind throughout the stages of this research. Three levels of happiness can be identified. The first is the level of pleasure, hedonistic happiness and satisfaction. This state of mind cannot be identified with a full sense of happiness. The second level of happiness is well-being, which refers to “engagement”, commitment, and the release of feelings while accomplishing a task or goal. This high level of experience is called “flow” (Csikszentmihalyi, Citation2000). This brings us to the third level of happiness, which corresponds to Aristotle’s “eudemonia” (Irwin, Citation2019). This level of happiness is characterized by inner harmony, life purpose, personal growth, constructive relationships, autonomy, and an overall sense of psychological, physical and natural balance (Kopp & Kovács, Citation2006). Universities are increasingly becoming for-profit organizations; thus, it is appropriate to use the gross national happiness (GNH) of business.
To the best of our knowledge, this study is the first to survey organizational happiness based on the GNH of business in the context of higher education. In addition, this paper is the first to propose a data-driven approach to analyze happiness. Based on the proposed method, this study shows how to find patterns among respondents and how to identify indicators with high/low ratings and satisfied/dissatisfied respondents simultaneously. In addition, this paper shows how to find areas that must be improved to increase the satisfaction of respondents. The proposed method identifies areas for improvement for the examined group of respondents. In this way, a map of happiness is developed to analyze and improve the satisfaction of the respondents.
The proposed method is not limited to the measurement of happiness; however, as measurements of happiness have been studied relatively infrequently, both the proposed data-driven method and the result may be of interest in this context.
The remainder of the study is organized as follows: Section 2 reviews the background of the study. In Section 3, the proposed data-driven methods are introduced, and in Section 4, the proposed methods are tested on workers and on organizational surveys of happiness. In section 5, new insights into the results are obtained. Section 6 summarizes the conclusions and implications for scholars and decision makers. Finally, in Section 7, the limitations of the study and future works are expressed.
2. Background of the study
Traditionally, GDP (gross domestic product) has been the most popular index used to measure economic well-being (Decancq & Schokkaert, Citation2016; Dynan & Sheiner, Citation2018). Today, it seems more relevant to measure not only economic well-being but also people’s well-being while considering other dimensions such as health and happiness (Antolini & Grassini, Citation2020). For example, as noted by the World Health Organization, health is well-being, but it is not always coincident with a high level of GDP. Therefore, the use of GDP as a single measure has been extensively (J. C. Van den Bergh & Kallis, Citation2012; Victor, Citation2010). Most such critiques have pointed out that several factors that contribute to Human well-being cannot be described by GDP indicators. For example, GDP does not take into account the noneconomic factors that contribute to well-being (Almunia, Citation2007; D’acci, Citation2011). Similarly, Gurria states that its focus is purely monetary; thus, it offers only a limited view of the progress of society (Gurra, Citation2013). Indeed, it fails to encapsulate the satisfaction of basic needs within a community and neglects income distribution ((Bache, Citation2013; J. Van den Bergh & Antal, Citation2014). For example, GDP does not capture health, education, security or income inequality, nor does it consider contributions of unpaid household work, volunteering activities, leisure or social relations (Monaco, Citation2016).
These individuals, among others, have called for a more holistic and multidimensional way of measuring the socioeconomic welfare of a community or society. Several alternative indices have been proposed in recent decades, such as the Human Development Index (HDI) (Bagolin & Comim, Citation2008), the Genuine Progress Indicator (GPI) (Talberth et al., Citation2007), the Index of Sustainable Economic Welfare (ISEW) (Lawn, Citation2003), the Gross National Happiness (GNH) index (Ura et al., Citation2005), the Quality of Life Index (QLI) (Ferrans & Powers, Citation1985), the Well-being & Progress Index (WIP) d2011measuring and the Weighted Index of Social Indicators (WISP) (Estes, Citation1997).
The concept of GNH, which we use in this paper, was created in Bhutan in 1972 (Brooks, Citation2013). GNH exemplifies the Bhutanese government’s holistic approach to achieving a “balance between the spiritual and material aspects of life, between peljor gomphel (economic development) and gakid (happiness and peace)” (Secretariat, Citation1999), p. 19). The logic of GNH adopts a holistic approach to measuring people’s happiness and well-being. It consists of four pillars (good governance, sustainable socioeconomic development, the preservation and promotion of culture, and environmental conservation), which are divided into 9 domains and another 33 measurable indicators (Braun, Citation2009; Rinzin, Citation2006). The original GNH was used at the societal level (Ribeiro & Marinho, Citation2017; Ura et al., Citation2005), but a modified version was applied to some cases at the organizational level as well (Applasamy et al., Citation2014). An organizational-level GNH model (i.e., the “GNH of Business”) that retains the logic of the original GNH model has been developed in recent years (Zangmo et al., Citation2017).
The GNH of the business model is a reporting tool meant to function as a microlevel counterpart of the GNH index (Zangmo et al., Citation2017), and it uses the original pillars and areas of the GNH index. The GNH of the business model calculates the happiness indexes of organizations based on their qualifications in two areas; on the one hand, it is based on the value judgments of employees, and on the other hand, it is based on an evaluation of (managerial opinions on) the focal organization as a whole. This tool can be used voluntarily by businesses to integrate GNH values into their operations. A detailed description of the GNH of the business model can be found in Section 3.2. To the best of our knowledge, the present research is the first to apply the GNH of business models to HEIs.
HEIs are an integral part of our society. In addition to their many other functions, they play a significant role in transmitting values. Regarding the role and opportunity of higher education, Bullough (Citation2011) writes that the transmission of values and enhancement of students’ subjective well-being probably requires a change of attitude on the part of teachers and a stronger commitment of teachers to value transmission. In this context, measuring organizational satisfaction and happiness is greatly complicated by the fact that the organizational culture of HEIs has not been organized in a market-based way in recent decades (Bogdány et al., Citation2012); thus, organizational wellbeing issues have been on the agenda only in recent years. For this reason, in this sector, typically only the individual well-being factors of students have been analyzed rather than the state of HEI organizations as a whole; moreover, these types of studies mainly focus on primary and secondary education (Kun & Gadanecz, Citation2019). There is a gap in domestic happiness research in relation to teachers in university education.
From a methodological point of view, research papers adopting the GHN approach mainly use descriptive approaches to analyze their results (see, e.g., (Donnelly, Citation2004; Monaco, Citation2016; Tobgay et al., Citation2011). A limited number of studies have taken additional steps to use a model-driven approach, e.g., investigating relationships between variables with a structural equation model (Tshering et al., Citation2012). Nevertheless, these studies do not focus on how and when to improve happiness. They do not identify the examined group of respondents and the improvable dimensions simultaneously, which would provide an opportunity to specify special developments. In this case, analyses of response patterns are more suitable. However, instead of model-driven approaches, a data-driven approach is needed.
There are two ways to analyze research data. The first is the so-called model-driven approach, where after specifying research questions, a predefined research model is specified based on a literature review and the research questions. Based on the research model, research hypotheses are tested in qualitative or quantitative ways or through a combination of qualitative and qualitative methods (Ketchen & Bergh, Citation2006). This approach adopts a global perspective. On the one hand, it enables the identification of relationships between measured indicators or among a group of indicators, which are called dimensions or components. On the other hand, this approach tries to classify respondents by their answers. This approach is ideal if global relationships must be specified with a representative survey sample or a secondary database, but it usually reveals very little about individual choices.
In contrast to the model-driven approach, the data-driven approach has an individual focus. It deals with individual choices. Usually, this approach does not involve a preliminary research model or research hypotheses, and only research questions are developed. The patterns among answers reveal the relationships between indicators and respondents simultaneously. Due to its individual focus, this approach can provide new insights, even if the utilized database is nonrepresentative. Such new insights can function as the basis of a new research hypothesis, which can be proven by later model-driven research on a larger sample (Provost & Fawcett, Citation2013). The results of data-driven methods must also be compared with previous research results to determine which results are in line with previous knowledge and which represent new insights (Provost & Fawcett, Citation2013).
Despite the advantageous properties of data-driven approaches, little attention has been devoted to biclustering and seriation in economic and social sciences. Both the seriation and biclustering algorithms that have been applied are data-driven techniques, as they are so-called unsupervised, data-mining algorithms. This means, in such cases, that there are no preliminarily defined relationships between the focal dimensions that must be tested. There is no preliminary research model underlying the applied methods (Henriques et al., Citation2019; Lukes, Citation2004). Researchers seek patterns and groups of individual choices and try to understand them.
Both seriation (Hahsler, Citation2017) and biclustering (Xie et al., Citation2018) have been primarily applied in the fields of bioinformatics and biomedical data analysis, and to the best of our knowledge, until now, they have not been used to analyze survey data. Nevertheless, in the last decade, these methods have been used successfully in a range of contexts, from social, business and economic sciences (see, e.g., Liu et al. (Citation2009); Huang (Citation2011)) to university rankings (Kosztyán et al., Citation2019; Raponi et al., Citation2016).
Kosztyán et al. (Citation2019) proposed the use of the term leagues instead of biclusters. A league specifies the focal set of indicators and the focal set of observations simultaneously. In this study, a league simultaneously specifies the dimensions and the group of respondents corresponding to an individual happiness survey and the group of HEIs corresponding to an organizational happiness survey with respondents who are satisfied or dissatisfied. In other words, this method identifies who is satisfied/dissatisfied in what area. When identifying leagues, the proposed biclustering algorithms (Gestraud, Citation2008; Gusenleitner et al., Citation2012) must be balanced so that the leagues are as homogeneous as possible while covering as large a subset as possible.
Our contribution to the literature is twofold. First, to the best of our knowledge, this study is the first to address organizational happiness based on the GNH of the business model in the context of higher education. Second, to the best of our knowledge, this is the first paper that uses data-driven approaches, such as seriation and biclustering algorithms, to mine patterns and groups of individual choices from survey data.
3. Research methods
In this study, we provide two kinds of data-driven analyses on a validated GNH of Business questionaire. The first data-driven method is called seriation (Liiv, Citation2010), which reveals the pattern of happiness, and the second is biclustering, which provides us with the leagues of happiness. Before using data-driven methods for (aggregated) indicators, Cronbach’s alpha measure was calculated for every Likert scale and ordinal scaled answer to check the reliability of responses.
3.1. Data employed
In accordance with our research goals, the primary data collection tool was an online questionnaire survey. Two surveys were prepared and analyzed: one for university employees and another for university management members. To collect data corresponding to the 29 indicators examined, we surveyed the respondents with questions based on 114 variables related to their lives, such as age, location, and occupation variables, and certain self-reported questions, including those on how often they participated in social events and whether they planned to vote (Metz, Citation2014).
The respondents were employed in Hungarian universities. In terms of survey coverage, the sample included 239 respondents with fully completed questionnaires.
3.2. GNH of Business model employed
The GNH of the business model follows the structure of the original GNH framework. Both GNH and the GNH of business are based on 4 pillars and 9 domains. The individual survey contains 29 indicators based on 114 variables.
The first five dimensions (domains) are as follows: psychological well-being, health, time use, education and living standards. A list of the domains, the indicators and their weights is shown in Table .
Table 1. List of domains and indicators used to assess worker happiness
The last four dimensions (domains) are as follows: good governance, cultural diversity, community vitality and ecological diversity. A list of the domains, the indicators and their weights is shown in Table .
Table 2. Assessment components, domains, indicators and weights of organizational conditions for happiness
Two weights are used, namely, the domain weight and the indicator weight. The weight of each domain is derived from the distribution of the total possible score (100) according to employee happiness and organizational conditions. Each domain is used to evaluate employees’ weights 20 (100/5), where 5 is the number of domains involved. In assessments of organizational happiness, each of the four domains (categories) used to assess organizational conditions is given 25 weights (100/4), where 4 is the number of domains involved. The weight of each domain is divided by the number of indicators measured within it.
Sufficiency thresholds show the extent to which people enjoy sufficiency in relation to the indicators (Ura et al., Citation2005). The alignment thresholds of all the indicators are identified. We apply sufficiency thresholds (to identify who has enough) and weights to each indicator. For example, for employees, the value of the alignment threshold of each indicator should be examined: the value of this indicator is “1” if the focal employee enjoys sufficiency and “0” if he or she does not reach the adequacy threshold. We should identify the domains in which employees do not enjoy sufficiency and the percentage of domains in which they enjoy sufficiency. People who do not reach a given threshold are placed in the insufficient category (0). Sufficiency thresholds are used to evaluate workers’ sufficiency in relation to each of the indicators. Once a sufficiency threshold is applied, the value is 1 if a given worker has reached sufficiency and 0 if he or she has not reached sufficiency. We count the number of employees who have reached sufficiency.
Before the calculation process, for the questions, the reliability of responses was checked by Cronbach’s alpha measure.
Cronbach’s alpha is calculated by taking the score from each scale item and correlating them with the total score for each observation and then comparing that with the variance for all individual item scores. Cronbach’s alpha is best understood as a function of the number of questions or items in a measure, the between pairs of items average covariance, and the overall variance of the total measured score.
where is the number of items in the measure,
variance associated with each
variance associated with the total scores. It is important to note that Cronbach’s alpha can be measured only for nonbinary items; therefore, for aggregated indicators, stability tests are used and incorporated by biclustering methods.
The calculation process includes two procedures: identification and aggregation. The first procedure reveals whether each indicator has reached sufficiency in each of the nine domains, and it is performed by applying a sufficiency cutoff to each indicator. In the aggregation phase, population data are merged into a decomposable index. All the indicators are binary indicators to facilitate individual responses.
The domains and indicators of the GNH of the business model and their weights are shown in Tables . The calculation process consists of the following two parts.
The employee happiness index is as follows:
where is the happiness score of workers;
is the number of indicators;
is the
indicator;
is the weight of indicator
; and
is the value of indicator
.
According to the terms and definitions specified in the introduction, the response of the focal respondent corresponding to an indicator of the GNH of the business model can be categorized as satisfaction or dissatisfaction. A set of responses (i.e., satisfaction statuses) can represent well-being; however, only all the responses can indicate happiness.
Similar to the employee happiness indexThe organizational conditions of happiness are calculated as follows:
Based on the above formulae, the happiness index is calculated through simple aggregation.
3.3. Applied methods—seriation
Seriation is an exploratory combinatorial data analysis technique used to reorder data matrices (columns = indicators and rows = observations). Seriation facilitates pattern discovery at three information levels simultaneously: local fragments of relationships, sets of organized local fragments of relationships, and an overall structural pattern (Liiv, Citation2010). Through seriation, both rows and columns are reordered simultaneously to group similar cells as closely as possible. In this study, this method is used to develop the pattern of happiness. Similar cells (specified as an individual’s answer corresponding to an indicator) are grouped as closely as possible.
Figure shows an example of matrix seriation.
Figure 1. Example of seriation.
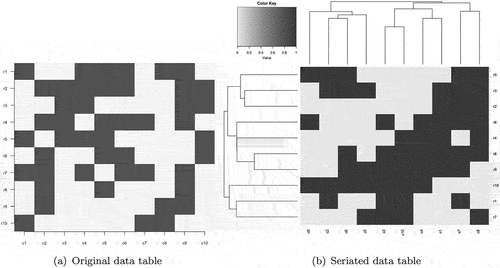
Seriation facilitates hierarchical clustering of rows and columns simultaneously; therefore, after seriation, columns with similar respondent answers are close to one another. In addition, conversely, there are respondents (i.e., rows in the data table) who gave similar answers to questions. A dendrogram of hierarchical clustering, which is a classification tree, can be used to indicate the degree of similarities among the rows/columns. In the branches, a smaller difference in height indicates greater similarity.
During reordering, seriation is used to classify rows and columns simultaneously to help identify the leagues.
3.4. Applied methods—biclustering
Following the simultaneous clustering of the rows and columns, a biclustering algorithm can be specified to recognize the set of leagues. A league (i.e., bicluster) is used to specify the set of indicators and the set of respondents simultaneously. In this way, a homogeneous submatrix (hereafter, league) is developed. A league of happines happiness specifies indicators and respondents simultaneously, identifying who is satisfied/dissatisfied regarding various indicators.
Kosztyán et al. (Citation2019) proposed three types of leagues. Type A leagues include indicators and respondents whose responses are significantly more positive than those of the remainder. In this case, league A is the league(s) of happiness. In contrast, league C includes indicators and respondents whose responses are significantly more negative than those of the remainder. In this case, league C specifies the league(s) of unhappiness.
Both type A leagues and type C leagues are sought with the iterative binary biclustering of gene sets (iBBiG) (Gusenleitner et al., Citation2012) algorithm. This algorithm assumes that the utilized dataset is a binary dataset; if this is not true, the first step is to binarize the dataset based on a given threshold () (see e.g. Kosztyán et al., Citation2019). However, our dataset is binary; therefore, the application of the iBBiG algorithm is even more justified.
This algorithm balances the homogeneity (in this case entropy) of the selected submatrix with the size of the league. Formally, the iBBiG algorithm maximizes the following target function if the original binary dataset is denoted as :
where is the score value of the submatrix (bicluster, league)
.
is the entropy of submatrix
;
is the median of bicluster
;
is the exponent; and
is the threshold. If
or
is increased, we obtain a smaller but more homogeneous submatrix (see Figure ). Previous studies (see e.g. Gusenleitner et al., Citation2012; Kosztyán et al., Citation2019) suggest that the balance exponent (
) must be set to 0.3, while the threshold (
) should be 0.5.
Figure 2. Leagues a and C with different exponents (,
).
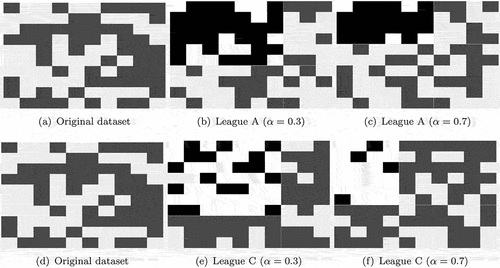
Figure shows the results if different balance exponents are used for the iBBiG algorithm. The selected leagues are provided in the top-left corner of Figs. ). An increase in the exponent increases the homogeneity but decreases the size of the league, which can have a negative effect on stability.
The shapes of the biclusters are very important. Wide leagues contain respondents who are satisfied/dissatisfied in relation to most indicators. Long leagues contain indicators with which most respondents are satisfied/dissatisfied. In other words, wide leagues indicate common answers, and long leagues indicate related dimensions.
To support the identification of patterns, another biclustering method is applied, namely, biclustering analysis and results exploration (BicARE) (Gestraud, Citation2008), which minimizes the variance within each bicluster (see Figure ). Kosztyán et al. (Citation2019) defines this kind of bicluster as a type B league. This algorithm works equally well on binary and nonbinary datasets.
Figure 3. Comparing type a and type B leagues.
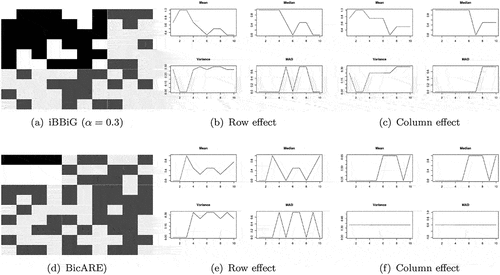
This method works equally well on binary or continuous datasets. Let us not forget that biclusters should be as large and as homogeneous as possible; therefore, identified (so-called dominant) patterns provide new insight into the structure of the examined data. In this case, newly recognized possibilities can lead to pattern identification.
Horizontal patterns (see, e.g., Figure ) involve respondents whose answers are similar (in this case, satisfied/dissatisfied), while vertical patterns involve indicators corresponding to similar respondent answers. They are similarly satisfied or dissatisfied. If a horizontal pattern is dominant, there are more respondents whose answers are similar independently from the focal question (positive or negative), while if a vertical pattern is dominant, there are more indicators corresponding to similar answers (positive or negative). In extreme cases, league type B does not exhibit any horizontal or vertical patterns. In this case, positive or negative answers (i.e., satisfaction or dissatisfaction) are dominant; however, apart from that case, satisfaction within league B is between league A (in this case, the league of happiness) and league C (the league of unhappiness).
3.4.1. Significance, stability and relevance
Statistical tests, such as t tests and F tests, can be employed to calculate both row and column effects (Xie et al., Citation2018). In this case, the cells (i.e., answers) within biclusters and in the remaining rows/columns can be compared. Since the number of cells is the product of the number of indicators and the number of respondents, the applicability of these tests, even in cases of small samples, is ensured. To calculate row and column effects while investigating leagues A and C, a t test is applied to determine whether the levels of satisfaction inside and outside the leagues are different. An F test is used to investigate league B to determine whether the variance in satisfaction inside and outside the leagues is different. We say that a bicluster is significant if both the row effect and the column effect are significant.
Identifying leagues through biclustering is a heuristic method. Therefore, in addition to conducting significance tests, we must calculate the stability of the biclusters. Usually, a bootstrapping algorithm is used to calculate the stability of biclusters. This method ignores rows and columns and evaluates the changes within biclusters Lee et al. (Citation2011). Stability can be calculated for both rows and columns. We say a bicluster is stable if it is stable for both rows and columns.
(Kosztyán et al., Citation2019) proposed a partial ranking coefficient to analyze the relevance of leagues. In this case, for a given bicluster, a partial correlation is calculated between selected indicators and all the indicators for selected respondents. If the absolute value of the partial rank correlation coefficient (hereafter, relevance coefficient) is high (), the selected indicators characterize the answers of the respondents well. In other words, if the respondents in a league are ranked based on both all the indicators and only the selected indicators, the partial ranks should be high. In this case, a high-relevance indicator shows that the selected indicators are the core indicators for the happiness of the selected respondents. Even if the remaining indicators are ignored, the order of satisfaction can be retrieved. In other words, a high relevance coefficient shows that the remaining indicators can be ignored when considering the selected respondents. In contrast, a low-relevance coefficient indicates that the selected indicators are insufficient for predicting the happiness of the respondents. In other words, in this case, the leagues identify just the area of satisfaction/dissatisfaction while failing to predict overall happiness. In this study, the significance, stability, and relevance of each league are calculated.
3.4.2. Multiple and dominant leagues
All the applied biclustering methods allow us to specify multiple leagues. These leagues can overlap and can be ranked based on their score values. The first bicluster within an ordered set of biclusters is called a dominant bicluster because it contains the most cells. Furthermore, a bicluster is said to be a reliable league if it is significant, stable, and relevant.
For all types of leagues, the dominant league is always specified, but additional leagues are specified only if they are significant.
3.4.3. Overlaps and uniqueness
The applied biclustering methods allow for overlapping. However, their real contribution is the ability to analyze the overlaps among leagues. Both the share indicators and the consideration of similar respondents help us better understand the responses. Table summarizes the interpretations of the overlaps.
Table 3. Interpretation of shared indicators and similar respondents in the case of overlapped leagues (Source: self-edited, based on (Kosztyán et al., Citation2019))
In addition to shared indicators and similar respondents, nonoverlapped indicators/respondents called unique indicators/respondents and nonselected indicators/respondents can provide further additional insights for the survey. For example, the unique indicators in league A, called league A+, are informative satisfaction indicators. While in the case of shared indicators, there are satisfied respondents alongside numerous dissatisfied ones, this is not true for unique indicators because they are not involved in other types of leagues. Similarly, the unique indicators in league C, called league C, are indicators with few satisfied respondents. Unique league B indicators (called league B0) are not very common because depending on their responses, in cases of low response variance, respondents are involved in either league A or league C.
Similar to the indicators, the unique rows in league A correspond to the most satisfied respondents because they are involved only in the league of happiness (league A) while being excluded from the less satisfied leagues. The unique respondents in league C are the most dissatisfied respondents. In this case, the unique respondents in league B are moderately satisfied; however, they are not necessarily satisfied in the same areas that the members of league A are and not necessarily dissatisfied in the same areas as those that the members of league C are. Table summarizes the interpretation of the unique indicators and unique respondents, which can form unique leagues.
Table 4. Interpretation of unique indicators and unique respondents in leagues (Source: self-edited, based on (Kosztyán et al., Citation2019))
The nonselected indicators and respondents do not exhibit any patterns. They are also moderately satisfied, but their answers are random.
3.4.4. Who are in leagues?
While the variables are predefined, the responses are anonymous. However, based on demographic characteristics, the profiles of the biclusters can be obtained through correspondence analysis (CA). Nevertheless, CA will only work if the respondents can be grouped, or in other words, if the biclusters do not contain most of the respondents. The demographic variables of the profiles are placed in OR relations because the relations between the demographic variables and the membership of biclusters are tested independently.
3.4.5. Ranking based on leagues or ranking leagues?
Both the indicators and the respondents can be ranked based on satisfaction or happiness. Kosztyán et al. (Citation2019) recommended that rankings should be calculated within leagues, as league members are surely comparable. However, our leagues can also be ranked based on satisfaction or happiness; in this way, we glean new insights regarding which areas are worth strengthening and whose satisfaction should be increased.
4. Results
4.1. Descriptive statistics
The lowest Cronbach’s alpha for original questions was 0.7918; therefore, aggregated indicators can be calculated. Table shows a summary of the workers’ surveys.
Table 5. Summary table of individual conditions for happiness
Weights can only be reported as subdomain values (i.e., the weighted values in Table ) if more than 60% = 144/239 of the respondents are satisfied in relation to that area.
The worker happiness score is very low (36.566 %), which indicates general dissatisfaction among faculty members. However, there are significant differences in the responses. There is general dissatisfaction with living standards (see D5 in Table ). In addition, a few satisfied respondents can be observed in most domains. The least satisfactory areas are health (D2), time use (D3), education (D4) and living standards (D5); the corresponding indicators are work stress (1/239 satisfied with D2.1), workplace common spaces (2/239, D2.3), rest and breaks at workplace (1/239, D3.5), skill development (1/239, D4.2), pay & allowances (8/239, D5.1), and fringe benefits (1/239, D5.5). However, there are several indicators with which the respondents are satisfied or have no reason for dissatisfaction, such as injury (215/239, D2.6), illness (209/239, D2.7), and working hours (214/239, D3.6). The results are already drawing attention to apparent contradictions, such as differing judgments regarding work stress vs. work schedule and regarding trust vs. safety.
Table shows a summary table of the organizational survey. In this case, the weighted values were calculated by multiplying the mean of the deans’ answers by the weight of each subdomain.
Table 6. Summary table of organizational conditions for happiness
The organizational assessment score is more than twice as high (52.678%) as the worker happiness score. The highest scores are in the good governance domain (D6), such as those of D6.1 local employment (4.17/4.17) and D6.6 salary gap (4.17/4.17). The score of local employment can be explained by the low level of internalization in Hungary. Evaluations of this domain are questionable in the context of higher education. Similarly, evaluations of salary gaps are questionable. While it is unfortunate if there are large salary gaps in an organization, the low level of satisfaction with pay & allowance (D5.1) observed indicates that low income is common among the economic and business faculty members of Hungarian HEIs.
The happiness index:
Both the worker happiness index and the organizational happiness index are below 60%.
4.2. Seriation—The pattern of happiness
In line with the summary table regarding worker happiness (see Table ), Figure indicates that the respondents are relatively dissatisfied. The vertical pattern of responses indicates that the respondents’ evaluations of happiness are very similar. This result is confirmed by the dendrogram depicting the hierarchical clustering of the rows and columns. While the hierarchical clustering of the rows does not indicate significant differences between the responses, the hierarchical clustering of the columns identifies two clusters. The first cluster involves 8 indicators, namely, D1.5 Workplace discrimination, D3.2 Work schedule, D3.6 Working hours, D3.1 Work-life balance, D2.6 Injury, D2.7 Illness, D2.5 Disability, and D1.2 Trust, with which the respondents are relatively satisfied.
Figure 4. Seriated individual indicators of happiness.
Figure 5. Seriated organizational indicators of happiness.
The seriation process not only identifies variables with which the respondents are satisfied but also aligns indicators that feature similar responses. For example, Figure shows that three of the abovementioned 8 variables, namely, D2.6 Injury (work-related injuries, e.g., falls, slips, repetitive motion injuries, and work-related vehicle accidents), D3.1 Work-life balance, and D3.6 Working hours are very similar to each other based on the respondents’ similar answers. The respondents are similarly highly satisfied with these areas.
Moreover, the seriation process shows that there is a smaller group of respondents (bottom one-third) who are satisfied in relation to additional areas, such as D1.3 Workplace environment, D1.4 Workplace engagement, D1.8 Negative workplace emotions, D4.3 Scholarships, D5.2 Satisfaction with pay, D4.1 Professional development, D1.1 Job satisfaction and D2.2 Nature of work.
In addition, Figure highlights the areas with which the respondents are dissatisfied. This cluster involves 8 variables, namely, D2.4 Safety, D5.3 Retirement benefits, D5.5 Fringe benefits, D4.2 Skill development, D2.1 Work stress, D3.5 Rest and breaks at workplace, D2.3 Workplace common spaces and D5.1 Pay & allowances. The dendrogram of hierarchical clustering shows that 5 of these variables are very similar. They are separated based on only a high threshold. These variables are D2.1, D2.3, D3.5, D4.2, and D5.5, which are areas with which the respondents are similarly highly dissatisfied, and these variables relate to four different domains: Health (D2), Time use (D3), Education (D4) and Living standards (D5).
Notably, the seriation process not only identifies the variables with which the respondents are satisfied but also (1) shows that these responses are common among specific groups of respondents, (2) groups and defines these respondents and (3) aligns variables with similar respondent patterns. For example, the respondents’ well-being is high in two domains, Health (D2) and Time use (D3), because 3 variables within each domain (D2.5, D2.6, D2.7 and D3.1, D3.2, D3.6) are closely aligned with each other.
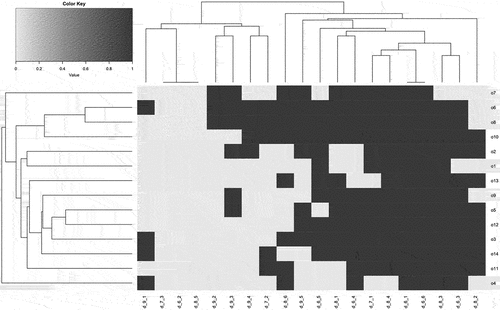
In contrast with the results regarding worker happiness, the organizational survey shows a relatively high level of happiness (Figure ). Nevertheless, the seriation shows that the pattern of the responses is similar to that in the seriation of the worker surveys. Similar to worker happiness, the hierarchical clustering of rows does not indicate significant differences between the responses; however, the hierarchical clustering of columns reveals two clusters. The smaller, so-called dissatisfied area includes 8 indicators, namely, D9.1 Emissions assessment, D7.3 Cultural promotion, D6.2 Workplace issues, D8.5 Raw material sourcing, D9.2 Solid waste assessment, D9.3 Environmental volunteerism, D9.4 Environmental donations, and D7.2 Cultural donations. The larger cluster contains 12 indicators, which indicates a higher level of satisfaction; these indicators are D8.6 Community feedback, D9.5 Eco-products and services, D6.5 Attrition, D8.1 Community volunteerism, D6.4 Audits, D7.1 Cultural volunteerism, D8.4 Effect on community health, D6.1 Local employment, D6.6 Salary gap, D8.3 Damage of infrastructure, D6.3 Compliance with law, and D8.2 Community donations. The seriation’s hierarchical clustering of the columns identifies variables that are close to one another. For example, D7.3, D6.2, and D8.5 are next to each other, and the organizational survey shows complete dissatisfaction in relation to these variables; however, D8.4, D6.1, D6.6 and D8.3 are close to each other and constitute the areas where satisfaction is high. In addition, the seriation shows that although no two responses are exactly alike, the respondents cannot be separated. This means that they have to be considered a single group.
The seriation process indicates patterns of happiness by reordering the respondents and variables, and the biclustering method identifies the leagues of satisfied and dissatisfied respondents and their variables.
4.3. Biclustering—Leagues of happiness
The applied iBBiG algorithm identifies two significant leagues per league type. Figure shows the shapes of the leagues of happiness (leagues and
) and unhappiness (leagues
and
).
Figure 6. Leagues of happiness and unhappiness for individual indicators.
The set of leagues covers most of the indicators. The only nonselected indicator is D1.6 Workplace harassment is not involved in any of the leagues. In line with the results of the seriation process, we obtained more vertical biclusters than horizontal biclusters. The first (dominant) leagues () contain the most respondents. This result confirms that the respondents’ well-being is homogeneous. Nevertheless, the applied biclustering algorithm identifies additional smaller leagues (
,
) that involve fewer respondents; however, the set of indicators identified is larger. Sixty-two of the respondents in league
are relatively satisfied, while 120 of the respondents in league
are more dissatisfied than others.
The locations of the dominant leagues of happiness and unhappiness () identify the indicators with which the respondents are generally satisfied or unsatisfied. Moreover, the locations of additional leagues identify separate groups of respondents who are more satisfied (
) or more dissatisfied (
). Since leagues
include only a small part of the respondents, the respondent profiles can be specified through CA. The league of “most satisfied workers” (
) contains mainly males and individuals in senior positions. They are mainly older (46-), and married people are overrepresented. In the league of “least satisfied workers”, females are overrepresented, as are young people, divorced people, and widows.
The dominant leagues () do not share indicators with each other, while the additional leagues (
) have common indicators, such as D1.3 Workplace environment, D1.4 Workplace engagement, D1.8 Workplace discrimination, D5.2 Satisfaction with pay and D4.1 Professional development. However, common respondents are not specified, which indicates that there is a large gap between those who are very satisfied and those who are very unsatisfied.
Table shows the results regarding the reliability of the leagues.
Table 7. Summary table of the reliability tests of the leagues of happiness () and leagues of unhappiness (
)
Table shows that both the dominant () and the additional leagues (
) of happiness are smaller than the leagues of unhappiness (
). Similarly, the leagues of unhappiness contain more respondents (207 vs. 232 and 62 vs. 120) and more indicators (8 vs. 9 and 12 vs. 21).
All the dominant leagues are reliable (significant, stable and relevant), and both of the additional leagues are significant () and relevant (
). The additional leagues are stable in relation to their indicators but not their respondents. This means that the additional leagues are sensitive to respondent swaps.
Figure shows the results regarding the leagues of happiness () and unhappiness (
) corresponding to the organizational survey.
Figure 7. Leagues of happiness and unhappiness for organizational indicators.
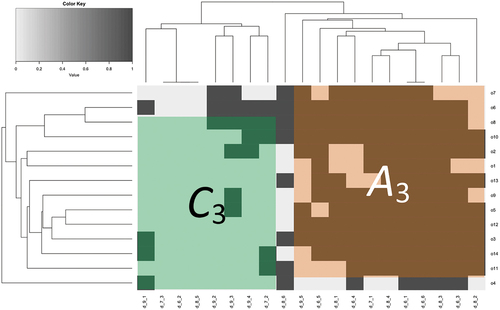
Although the dataset of the organizational survey contains more indicators than respondents, the specified leagues are vertical. They contain almost all the respondents (: 12/14,
: 13/14). This means that the responses are homogeneous. There are no overlapping indicators between the leagues, indicating that the strengths and weaknesses of the organizations are similar. Only one indicator, namely, D8.6 Community feedback is not selected, as it varies across the economic faculties of Hungarian HEIs.
Instead of rows and indicators, cells are compared in a significance test (see Table ).
Table 8. Summary table of the reliability tests of the leagues of happiness () and the leagues of unhappiness (
)
Only one bicluster for each league type (A and C) can be found. League , which contains the strengths of organizations, is larger than league
. In addition, while league
is reliable, league
is nonsignificant and unstable but relevant.
Figure shows the league type B biclusters corresponding to the employee () and organizational (
) surveys.
Both leagues contain vertical patterns, supporting the former results showing that the respondents are more homogeneous than the indicators. finds
respondents whose satisfaction patterns are the same in relation to 12 indicators, and while there are no similar answers on the organizational survey, 9/14 organizations provide the same response in relation to 10 indicators.
The organizational-level evaluations of satisfaction indicated by the patterns of happiness exhibited by the organizational survey are more favorable than those exhibited by the workers’ survey. contains only three (3/10) satisfactory indicators, namely, D2.6 Injury, D2.7 Illness and D3.1 Work-life balance,
contains seven (7/10), namely, D6.1 Local employment, D6.3 Compliance with law, D6.4 Audits, D6.6 Salary gap, D7.1 Cultural volunteerism, D8.3 Damage of infrastructure and D8.4 Effect on community health. On the one hand, these indicators contain the most satisfactory responses; on the other hand, the BicARE algorithm can identify the areas where satisfaction is associated with dissatisfaction. For example, the respondents who avoid illnesses (D2.7) are under work stress (D2.1). Furthermore, the respondents who escape injuries (D2.6) do not feel safe (D2.4). Interesting patterns are also observed on the organizational side. For example, where there is a strong effect on community health (D8.4), community feedback (D8.6) is nonexistent; where cultural volunteerism (D7.1) is high, cultural promotion (D7.3) is nonexistent; and where compliance with the law (D6.3) and audits (D6.4) are strong, there are extensive workplace issues (D6.2).
4.4. From overlaps of league rankings to development possibilities
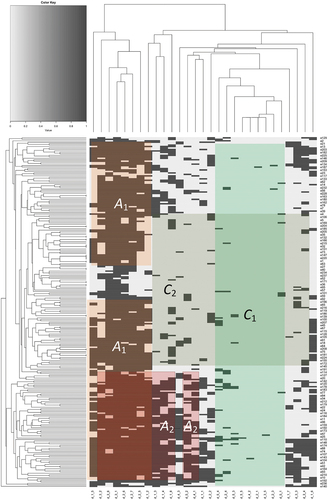
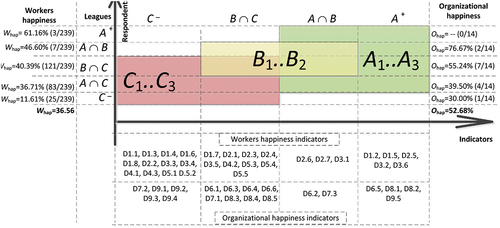
Figure summarizes the biclustering results. It shows the locations of the leagues for both the worker survey and the organizational survey. These results provide a map of happiness leagues. The horizontal axis shows the established indicators by league, and the vertical axis shows the worker (on the left side of Figure ) and organizational happiness (on the right side of Figure ) values of each league.
The league map covers all the respondents and almost all of the indicators. The only nonselected indicator is D8.6 Community feedback. The map of leagues indicates that most of the respondents are in the middle leagues . In addition, most of the indicators related to workers are in the leagues of unhappiness (type
leagues); this indicates areas that require improvement, such as the areas of Psychological well-being (D1: D1.1, D1.3-D1.8), Health (D2: D2.1-D2.4), Time use (D3: D3.3-D3.5), the entire Education dimension (D4: D4.1-D4.3) and the entire Living standards dimension (D5: D5.1-D5.5).
In contrast to worker happiness, most of the organizational happiness indicators are in league A. The map also indicates that most of the responses are in the middle leagues. The map highlights areas requiring improvement, such as those corresponding to one indicator in Good governance (D6: D6.2), two indicators in Cultural diversity (D7: D7.2, D7.3), one indicator in Community validity (D8: D8.6), and almost the entire dimension of Ecological diversity (D9: D9.1-D9.4).
5. Discussion
This study reveals that happiness in Hungarian universities is generally low. In addition, the paper reveals the indicators that can be addressed to improve happiness. All three utilized methods point in the same direction, highlighting that certain factors such as stress and skill development are disregarded in Hungarian HEIs. The descriptive statistics show, for example, that workers’ well-being is low in relation to work stress and skill development. However, their well-being is relatively high in relation to work hours (see Table ). A seriation is used to align the indicators vertically, revealing areas where the respondents are satisfied and dissatisfied (see Figures ). The biclustering method is used to specify leagues of happiness, and dominant leagues of happiness () and unhappiness (
) are identified (see Figure ). These leagues include all the respondents. Moreover, our study reveals an apparent contradiction related to stress and work-life balance. The respondents were dissatisfied with their stress; however, they were satisfied with their work-life balance. Thus, we find that workers think they can balance their lives while being stressed.
In addition, there is a significant difference between workers’ happiness and organizational happinessOrganizational happiness is higher than workers’ happiness. The descriptive statistics of this study show that the worker happiness score is much lower (33.233%) than the organizational happiness score (52.678%). This finding is also reinforced by seriation because the number of indicators exhibiting organizational satisfaction is higher than the number of indicators showing dissatisfaction (see Figure ). The biclustering results similarly confirm this finding. The league of happiness () contains more indicators than the league of unhappiness (
) (see Figure ). This result shows that leaders do not experience certain problems, such as salary gaps between senior academics and newcomers. In addition, they do not see the importance of sending workers to skill development trainings. We can call this professorial blindness; senior lecturers and academics in leadership positions take it for granted that everyone educates themselves. This result implies that leaders need to pay attention to their workers’ training and skill development.
Furthermore, the current study finds that females are more dissatisfied than males. As Figure shows, females are overrepresented in league and are not in a leading position. This has an important implication. According to earlier studies (Cooper, Citation2019; Moodly & Toni, Citation2015), females are underrepresented in leadership positions in higher education despite the steady increase in female enrollment and employment in academia. While the current study provides a snapshot of Hungarian higher education, it supports evidence from previous observations (e.g., (Cooper, Citation2019; Moodly & Toni, Citation2015)).
Moreover, the results indicate that there is a high risk of losing junior academics. As the study shows, young workers are more dissatisfied than senior academics. This is supported by the results of the biclustering method because the respondents in league , who are relatively dissatisfied, are mainly young newcomers under 46 years old, and they are junior lecturers or do administrative work. This result can be explained by the fact that they are not in leadership positions and may not have a good perspective of higher education. Figure shows the indicators with which all of the respondents were dissatisfied (see league
). The study reveals that indicators at the intersection of leagues
and
will not be improved later. We can assume that young workers who move to the right side of league
leave higher education. However, if the indicators related to columns
and
are improved, we can assume that young workers will remain in higher education. This finding has important implications for improving the satisfaction of young workers. HEIs should improve the areas (indicators) on the right side of Figure (four indicators) and those that correspond to league
. Therefore, it can be assumed that HEIs need to pay attention to their employees’ satisfaction if they do not want to lose them. In addition, extending previous findings, this paper precisely ascertains the indicators that should be addressed to increase satisfaction.
Figure 8. Patterns of happiness.
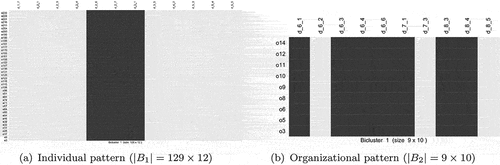
Figure summarizes possible ways to improve workers’ happiness scores. For example, workers’ satisfaction can be increased by improving the indicators D1.1, D1.3, D1.4, D1.6, D1.8, D2.2, D3.3, D3.4, D4.1, D4.3, D5.1, and D5.2. If these are improved, the corresponding workers will be moved from their leagues of unhappiness (type ) to type
or
leagues. Moreover, the organizational conditions for happiness can be further developed by improving indicators D6.2 and D7.3. In this case, one would be moved from league
to league
, which are leagues of happiness.
Figure 9. Map of happiness leagues.
Summary and Conclusion
In this paper, a data-driven approach is proposed to analyze the happiness of workers in the economics departments of Hungarian HEIs. The proposed set of methods specifies the patterns among respondents, indicating whether the respondents or the responses are more homogeneous. The applied biclustering method specifies a set of leagues, i.e., a set of responses and a set of indicators simultaneously, where respondents are satisfied or dissatisfied. The locations of and overlaps between the leagues identify the possible ways in which satisfaction can be improved; in this way, the level of worker happiness can be increased. Thus, the results show not only how unhappy Hungarian respondents are in general but also how this can be addressed.
6.1. Implications for scholars
The proposed data-driven approach has rarely been studied through survey analyses, but it has several benefits for scholars.
(1) This study shows that the methodology of the GNH of business models can be applied in nonprofit organizations.
(2) The proposed set of methods can provide new insight into the GNH of business models.
(3) Due to the data-driven nature of the approach, there is no need for preliminary hypotheses. New insights are provided as a result of the applied methods.
(4) Since cells rather than rows/columns are compared in the case of pairwise tests, the analysis of significance also works for small samples.
6.2. Implications for practitioners
The set of proposed methods offers additional benefits for practitioners who perform business GNH analyses in organizations.
(1) The pattern of the responses shows their homogeneity. Horizontal patterns highlight groups of homogeneous (i.e., satisfied, dissatisfied) respondents, while vertical patterns highlight groups of homogeneous indicators with which respondents are similarly satisfied/dissatisfied (see Figure ).
(2) The set of leagues of happiness simultaneously highlights the respondents who are satisfied/dissatisfied in relation to a specific area and the corresponding indicators. This analysis shows which respondents’ satisfaction should be improved in which area.
(3) The map of leagues, which is based on the locations of and overlaps among the leagues, shows how individual satisfaction can be improved to increase organizational happiness.
6.3. Implications for decision-makers
The findings of this study have a number of important implications for decision makers. First, the findings of this research provide insights regarding the underrepresentation of females in leadership positions in higher education. Based on this result, our study recommends empowering female academics to apply for leadership positions or senior positions. This could involve investing in extensive mentoring and career support programs for female academics to engage them in building confidence and recognizing talent early in their careers. Moreover, the findings of this study can be used to develop targeted interventions aimed at expanding strategic development activities. The strategies of HEIs should cover human capital concerns, more precisely focusing on issues such as salary structure, academic careers, workers’ training and skill development, which require more focused attention.
7. Limitations and future work
The generalizability of these results is subject to certain limitations. For instance, the paper proposes a set of methods using a Hungarian example; therefore, its comparability with other countries is limited. A comparison of happiness at the organizational level in other countries would be an interesting option for further research. In addition, this study focused on HEIs, which are different from profit-oriented companies. Future research on for-profit organizations must be carried out to further verify and reinforce the reliability of the proposed method.
Code and Data Availability
We used R Studio, where the R notebook file contains both scripts and anonymous data sources. The R notebook is available upon request.
Consent to participate
Yes.
Consent to Publication
Yes.
Acknowledgments
The research is supported by the Research Centre at the Faculty of Business and Economics (No PE-GTK-GSKK A095000000-4) of the University of Pannonia (Veszprém, Hungary).
Disclosure statement
No potential conflict of interest was reported by the authors.
Additional information
Funding
Notes on contributors

Zsolt Tibor Kosztyán
Zsolt T. Kosztyán, Ph.D. habil. His research interest is the development of methodologies to manage complex management problems and systems relating to mathematical models and algorithms of project management, production, maintenance, and network science..
Tibor Csizmadia
Tibor Csizmadia, Ph.D. habil. His area of research interest and expertise includes quality management in higher education. He has conducted research in academic and industrial settings.
Beáta Sz.G. Pató
Beáta Sz. G. Pató, Ph.D. habil. Her research and development projects are supported by US and European Union grants. Her research focus is job descriptions, competencies, SCM, logistics, and an expert in these fields as well.
Szilárd Berke
Szilárd Berke, Ph.D. habil. His research interests include leadership, organizational behavior, and strategic management.
Ildiko Neumanné-Virág
Ildikó Neumanné-Virág, Ph.D. Her research fields are European integration, international economics, and international trade and their statistical analysis and modeling, such as the gravity model, which has empirical success in explaining various types of flows, including migration, tourism, and international trade.
Andrea Bencsik
Andrea Bencsik, Ph.D. habil. Her research and teaching areas are knowledge-change and human resources management.
References
- Aldridge, S., & Rowley, J. (1998). Measuring customer satisfaction in higher education. Quality Assurance in Education, 6(4), 197–30. https://doi.org/10.1108/09684889810242182
- Almunia, J. (2007). Measuring progress, true wealth and well being. In speech delivered at Beyond GDP International Conference, Brussels: European Commission.
- Alves, H., & Raposo, M. (2007). Conceptual model of student satisfaction in higher education. Total Quality Management & Business Excellence, 18(5), 571–588. https://doi.org/10.1080/14783360601074315
- Antolini, F., & Grassini, L. (2020). Economic growth and mental well-being in Italian regions. Electronic Journal of Applied Statistical Analysis, 13(2), 498–518.
- Applasamy, V., Gamboa, R. A., Al-Atabi, M., & Namasivayam, S. (2014). Measuring happiness in academic environment: A case study of the school of engineering at taylor’s university (Malaysia). Procedia-Social and Behavioral Sciences, 123, 106–112. https://doi.org/10.1016/j.sbspro.2014.01.1403
- Bache, I. (2013). Measuring quality of life for public policy: An idea whose time has come? agenda-setting dynamics in the European union. Journal of European Public Policy, 20(1), 21–38. https://doi.org/10.1080/13501763.2012.699658
- Bagolin, I. P., & Comim, F. (2008). Human development index (hdi) and its family of indexes: An evolving critical review. revista de Economia, 34(2), 7–28. https://doi.org/10.5380/re.v34i2.12293
- Bassi, F. (2019). Students’ satisfaction in higher education: The role of practices, needs and beliefs of teachers. Quality Assurance in Education, 27(1), 56–69. https://doi.org/10.1108/QAE-05-2018-0061
- Bogdány, E., Balogh, Á., Csizmadia, T., & Polák-Weldon, R. (2012). Future employee preferences in the light of organizational culture. In Knowledge and Learning: Global Empowerment; Proceedings of the Management, Knowledge and Learning International Conference 2012, pages 363–371. International School for Social and Business Studies, Celje, Slovenia.
- Braun, A. A. (2009). Gross national happiness in Bhutan: A living example of an alternative approach to progress. Social Impact Research Experience Journal, 9(1) , 33–38.
- Brooks, J. S. (2013). Avoiding the limits to growth: Gross national happiness in Bhutan as a model for sustainable development. Sustainability, 5(9), 3640–3664. https://doi.org/10.3390/su5093640
- Bullough, R. V. (2011). Ethical and moral matters in teaching and teacher education. Teaching and Teacher Education, 27(1), 21–28. https://doi.org/10.1016/j.tate.2010.09.007
- Cooper, O. (2019). Where and what are the barriers to progression for female students and academics in UK higher education? Perspectives: Policy and Practice in Higher Education, 23(2–3), 93–100. https://doi.org/10.1080/13603108.2018.1544176
- Csikszentmihalyi, M. (2000). The contribution of flow to positive psychology. In J. E. Gillham (Ed.), Laws of life symposia series. The science of optimism and hope: Research essays in honor of Martin E. P. Seligman (pp. 387–395). Templeton Foundation Press.
- D’acci, L. (2011). Measuring well-being and progress. Social Indicators Research, 104(1), 47–65. https://doi.org/10.1007/s11205-010-9717-1
- Decancq, K., & Schokkaert, E. (2016). Beyond GDP: Using equivalent incomes to measure well-being in europe. Social Indicators Research, 126(1), 21–55. https://doi.org/10.1007/s11205-015-0885-x
- Donnelly, S. (2004). How Bhutan can measure and develop GNH. Centre for Bhutan Studies.
- Dynan, K., & Sheiner, L. (2018). GDP as a measure of economic well-being. Working Paper, 43. https://www.brookings.edu/research/gdp-as-ameasure-of-economic-well-being
- Estes, R. J. (1997). Social development trends in Europe, 1970–1994: Development prospects for the new europe. Social Indicators Research, 42(1), 1–19. https://doi.org/10.1023/A:1006839921618
- Ferrans, C. E., & Powers, M. J. (1985). Quality of life index: Development and psychometric properties. Advances in Nursing Science, 8(1), 15–24. https://doi.org/10.1097/00012272-198510000-00005
- Gestraud, P. (2008). BicARE: Biclustering Analysis and Results Exploration. R Package Version 1380.
- Graham, M. C., Priddy, L., & Graham, S. (2014). Facts of Life: ten issues of contentment. Outskirts Press.
- Gurria, A. (2013). Measuring well-being and progress. Please replace the name also in the text (Section 2). OECD Publishing.
- Gusenleitner, D., Howe, E. A., Bentink, S., Quackenbush, J., & Culhane, A. C. (2012). Ibbig: Iterative binary bi-clustering of gene sets. Bioinformatics, 28(19), 2484–2492. https://doi.org/10.1093/bioinformatics/bts438
- Hahsler, M. (2017). An experimental comparison of seriation methods for one-mode two-way data. European Journal of Operational Research, 257(1), 133–143. https://doi.org/10.1016/j.ejor.2016.08.066
- Henriques, R., Finamore, A. C., & Casanova, M. A. (2019). On the discovery of educational patterns using biclustering. In Proceedings of the Intelligent Tutoring Systems: 15th International Conference, ITS 2019, Kingston, Jamaica, June 3–7, 15 (pp. 133–144). Springer International Publishing.
- Hom, W. C. (2002). Applying customer satisfaction theory to community college planning of counseling services. IJournal, 9(2), 1–17.
- Huang, Q. -H. (2011). Discovery of time-inconsecutive co-movement patterns of foreign currencies using an evolutionary biclustering method. Applied Mathematics and Computation, 218(8), 4353–4364. https://doi.org/10.1016/j.amc.2011.10.011
- Irwin, T. (2019). Aristotele Aristotle Nicomachean Ethics. Hackett Publishing.
- Kara, A., & DeShields, O. (2004). Business student satisfaction, intentions and retention in higher education: An empirical investigation. Marketing Educator Quarterly, 3(1), 1–25.
- Ketchen, D. J., Jr., & Bergh, D. D. (2006). Research methodology in strategy and management. Emerald Group Publishing.
- Kopp, M., & Pikó, B. (2006). Az egészséggel kapcsolatos életminőség pszichológiai, szociológiai és kulturális dimenziói /Psychological, social and cultural dimensions of health related quality of life/. In M. Kopp & M. E. Kovács (Eds.), A magyar népesség életminősége az ezredfordulón (pp. 10–17). Budapest: Semmelweis Kiadó.
- Kosztyán, Z. T., Banász, Z., Csányi, V. V., & Telcs, A. (2019). Rankings or leagues or rankings on leagues? - ranking in fair reference groups. Tertiary Education and Management, 25(4), 289–310. https://doi.org/10.1007/s11233-019-09028-x
- Kun, A., & Gadanecz, P. (2019). Workplace happiness, well-being and their relationship with psychological capital: A study of Hungarian teachers. Current Psychology, 41(1), 1–15. https://doi.org/10.1007/s12144-019-00550-0
- Lawn, P. A. (2003). A theoretical foundation to support the index of sustainable economic welfare (isew), genuine progress indicator (gpi), and other related indexes. Ecological Economics, 44(1), 105–118. https://doi.org/10.1016/S0921-8009(02)00258-6
- Lee, Y., Lee, J., & Jun, C. -H. (2011). Stability-based validation of bicluster solutions. Pattern Recognition, 44(2), 252–264. https://doi.org/10.1016/j.patcog.2010.08.029
- Liiv, I. (2010). Seriation and matrix reordering methods: An historical overview. Statistical Analysis and Data Mining: The ASA Data Science Journal, 3(2), 70–91. https://doi.org/10.1002/sam.10071
- Limarev, P. V., Petrov, A., Zinovyeva, E. G., Limareva, J. A., & Chang, R. I. S. (2019). “Added economic value” calculation for the higher education providers’ services. IOP Conference Series: Earth and Environmental Science. Moscow. 272:032147.
- Liu, S., Chen, Y., Yang, M., & Ding, R. (2009). Bicluster algorithm and used in market analysis. In 2009 Second International Workshop on Knowledge Discovery and Data Mining, Lisboa. 504–507.
- Lukes, L. (2004). Analysis of Model-driven vs. Data-driven Approaches to Engaging Student Learning in Introductory Geoscience Laboratories. PhD thesis, Virginia Tech.
- Metz, T. (2014). Gross national happiness: A philosophical appraisal. Ethics and Social Welfare, 8(3), 218–232. https://doi.org/10.1080/17496535.2014.932420
- Monaco, E. (2016). Notes on bhutan’s gross national happiness and its measurement. Journal of Management and Development Studies, 27, 1–15. https://doi.org/10.3126/jmds.v27i0.24944
- Moodly, A. L., & Toni, N. (2015). Women’s access to higher education leadership: Where are the role models? Journal of Social Sciences, 45(1), 45–52. https://doi.org/10.1080/09718923.2015.11893486
- Nordenfelt, L. Y. (1995). On the nature of health: An action-theoretic approach. Springer Science & Business Media.
- Provost, F., & Fawcett, T. Data science and its relationship to big data and data-driven decision making. (2013). Big Data, 1(1), 51–59. PMID: 27447038. https://doi.org/10.1089/big.2013.1508
- Raponi, V., Martella, F., & Maruotti, A. (2016). A biclustering approach to university performances: An Italian case study. Journal of Applied Statistics, 43(1), 31–45. https://doi.org/10.1080/02664763.2015.1009005
- Ribeiro, L. L., & Marinho, E. L. L. (2017). Gross national happiness in brazil: An analysis of its determinants. EconomiA, 18(2), 156–167. https://doi.org/10.1016/j.econ.2016.07.002
- Rinzin, C. (2006). On the middle path, the social basis for sustainable development in Bhutan (Vol. 352). Utrecht University.
- Roohr, K. C., Olivera-Aguilar, M., & Liu, O. L. (2021). Value Added in Higher Education: Brief History, Measurement, Challenges, and Future Directions”. In C. Hughes & M. Tight (Eds.), Learning Gain in Higher Education (International Perspectives on Higher Education Research (Vol. 14, pp. 59–76). Bingley: Emerald Publishing Limited. https://doi.org/10.1108/S1479-362820210000014005
- Secretariat, P. C. (1999). Bhutan 2020: A vision for peace, prosperity and happiness Part I. Royal Government of Bhutan.
- Sen, S., Yildirim, I., & Karacabey, M. F. (2020). The implementation of the value-added assessment to determine school effectiveness. Education and Science, 45(202), 79–91. https://doi.org/10.15390/EB.2020.8023
- Sipayung, F., Rini, E. S., & Ginting, L. (2019). Design and measurement of student satisfaction based on fiu model in higher education. International Journal of Innovation, Creativity and Change, 5(2), 1735–1746.
- Talberth, J., Cobb, C., & Slattery, N. (2007). The genuine progress indicator 2006. Oakland, CA: Redefining Progress, 26.
- Teeroovengadum, V., Nunkoo, R., Gronroos, C., Kamalanabhan, T., & Seebaluck, A. K. (2019). Higher education service quality, student satisfaction and loyalty. Quality Assurance in Education, 27(4), 427–445. https://doi.org/10.1108/QAE-01-2019-0003
- Tobgay, T., Dorji, T., Pelzom, D., & Gibbons, R. V. (2011). Progress and delivery of health care in Bhutan, the land of the thunder dragon and gross national happiness. Tropical Medicine & International Health, 16(6), 731–736. https://doi.org/10.1111/j.1365-3156.2011.02760.x
- Tshering, S., Okazaki, T., & Endo, S. (2012). Testing theories about the composition of gnh domains and subsequently building causal models by means of structural equation modeling. International Journal of Advanced Research in Computer Science, 3(5), 83–91.
- Ura, K. (2005). Bhutan: Gross national happiness and the gnh index. Gross National Happiness, Sociological Bulletin, 54(3), 603–607. https://doi.org/10.1177/0038022920050318
- Van den Bergh, J., & Antal, M. (2014). Evaluating alternatives to GDP as measures of social welfare/progress. Technical report, WWW for Europe Working Paper.
- Van den Bergh, J. C., & Kallis, G. (2012). Growth, a-growth or degrowth to stay within planetary boundaries? Journal of Economic Issues, 46(4), 909–920. https://doi.org/10.2753/JEI0021-3624460404
- Victor, P. (2010). Questioning economic growth. Nature, 468(7322), 370–371. https://doi.org/10.1038/468370a
- Xie, J., Ma, A., Fennell, A., Ma, Q., & Zhao, J. (2018). It is time to apply biclustering: A comprehensive review of biclustering applications in biological and biomedical data. Briefings in Bioinformatics, 20(4), 1450–1465. https://doi.org/10.1093/bib/bby014
- Zangmo, T., Wangdi, K., & Phuntsho, J. (2017). Proposed GNH of business. Centre for Bhutan Studies & GNH.