
 ?Mathematical formulae have been encoded as MathML and are displayed in this HTML version using MathJax in order to improve their display. Uncheck the box to turn MathJax off. This feature requires Javascript. Click on a formula to zoom.
Abstract
Student Evaluations of Teaching (SETs) gather crucial feedback on student experiences of teaching and learning and have been used for decades to evaluate the quality of teaching and student experience of instruction. In this paper, we make the case for an important improvement to the analysis of SET data that can further refine its interpretation. An extensive literature explores the reliability and consistency of SETs, and factors hypothesized to affect student evaluation of instructors. Much less attention has been given to the statistics used by institutions of higher education to summarize and report SET data—historically, arithmetic means and standard deviations computed from Likert scale scores. Here, we argue that a combination of two different statistics—interpolated median (IM) and percent favourable (PF) rating—together with a measure of dispersion suitable for ordinal data offer a fairer and more meaningful set of metrics for summarizing and interrogating SET data collected using balanced Likert scale surveys. To illustrate the power of these proposed metrics, we present an analysis of SET data from two academic years at a major Canadian university, and we also highlight an interesting and previously unreported relationship that we identified between the interpolated median and percent favourable rating.
1. Introduction
Student evaluations of teaching (SET), while not uncontroversial (see, for example, Aleamoni (Citation1999); Feldman (Citation2007)), are instruments that have been employed in higher education since at least the 1920s. Originally introduced for the purpose of improving teaching practice, over time they have increasingly become tools of “performance management” (Galbraith et al., Citation2012). Marsh (Citation2007) explains, for example, that while SETs are commonly applied to offer diagnostic feedback to teachers, facilitate certain kinds of pedagogical research, develop measures of teaching effectiveness, and/or give students additional information that may guide future course selections, they are most frequently employed for purposes of “quality assurance”—including monitoring and management of the performance of instructional staff.
The widespread use of SET, the reliability and consistency of this approach for evaluation of teaching effectiveness, and the factors that may affect student rating of their instructors, have been the subject of numerous studies over decades (for an overview, see, for example, Blackmore, Citation2009; Clayson, Citation2009; Spooren et al., Citation2013). Few studies, however, have examined the statistics used to summarize and present SET data, or whether they are fit for purpose. In particular, little attention has been given to the appropriateness of the different descriptive statistics regularly computed in SET reports.
As long ago as Citation1987, and referencing the extensive body of work interrogating the validity and application of SETs, Marsh noted that SETs are probably “the most thoroughly studied of all forms of personnel evaluation” (p. 369) and instead urged that future SET research should focus on (among other things) methodology. Since then, numerous studies have proposed different approaches to analysing SET data, such as Item Response Theory (IRT) and/or multilevel modelling (Bacci & Caviezel, Citation2011; La Rocca et al., Citation2017; Rampichini et al., Citation2004). These model-based analyses allow for comparisons across course/instructor ratings, considering, among other things, variations in student characteristics and course attributes. However, in practice—and perhaps because of the perceived complexity of these latter approaches?—institutions of higher education in North America by and large use the mean and standard deviation to report individual instructor SET results (Stark & Freishtat, Citation2014). Parametric analyses of this kind can be appropriate for analysis of ordinal data, if certain distributional assumptions are met (Harris, Citation2001; Tabachnick & Fidell, Citation2021)—principally that the data are normally or near normally distributed. However, SET data is often negatively skewed and not normally distributed, because students tend to rate their experience of instruction favourably more often than not (Nulty, Citation2008; Zumrawi et al., Citation2014).
Kitto et al. (Citation2019) build on this observation and offer an excellent overview of the widespread problem of inappropriate analysis and the resulting ill-informed interpretation of SET data. Given that the statistics used in summarizing and reporting SET data, and their interpretation, can dramatically affect career progression of academic staff (hiring, (re)appointment, assignment of rewards and awards, promotion, tenure) this is a critical problem.
2. Background
Typical SET surveys in higher education offer students a set of statements about their learning experience (for example, “The instructor made it clear what I was expected to learn”) and invite them to indicate their level of agreement or disagreement with each statement on a 5- or 7-point Likert scale. Student responses to these survey items are then converted to numerical scores on scales of 1–5 or 1–7, depending on the scale used. Such scores are ordinal—that is to say, they represent a series of categories of response that exist in a particular order, but the distance between the categories (say, between a score of 3 and a score of 4) is not known. Nonetheless, it is common practice to treat such scores as if they are interval data and assume that such scores are distributed along a measurable scale and spaced equidistantly from each other. Because there is a desire to compute a single and simple representative composite score that somehow represents the “central tendency” of scores for each instructor, university analysts typically then calculate an “average (arithmetic mean) score” from the set of Likert scale scores an instructor receives. As Stark and Freishtat (Citation2014) note, “Averages of SET ratings have an air of objectivity simply by virtue of being numerical” (p. 1). These are often then simplistically compared with, say, the departmental average score. As noted earlier, the problem with this approach is that SET data does not meet the distributional assumptions required for parametric analysis.
More importantly, and as Kitto et al. (Citation2019) recently demonstrated through the use of hypothetical examples, very different distributions of student responses (scores) can result in identical average scores (for an illustration of this, see Figure , below). That is to say, SET surveys for two different educators may receive two very different sets of scores—representing significant differences in student sentiment or satisfaction—but their average scores may be identical. The use of an average can therefore mask great underlying variability in evaluation of teaching effectiveness and can lead to simplistic comparisons and conclusions regarding an individual educator’s performance. Stark and Freishtat (Citation2014) similarly highlight the challenges of meaningfully capturing, summarizing, and presenting SET data, and argue that distribution of scores—the % of scores in each category—gives more meaningful insight.
2.1. The interpolated median: a better approach to representing central tendency in SET
The preferred and more interpretatively valuable measure of central tendency for ordinal data such as Likert scale SET scores is the simple median (Manikandan, Citation2011). The simple median (referred to here as the customary median) is the value which divides the data into two halves. It is the middle data point, or the 50th percentile. However, while the customary median is preferred over the mean as a measure of central tendency for ordinal data, we propose that an even more appropriate measure is the “special variant” of median obtained by interpolating or adjusting the customary median upwards or downwards to better reflect the distribution of individual scores. This special variant of the median has been known as the interpolated median.
In their book Fundamental statistics in psychology and education, Guilford and Fruchter (Citation1978) described an interpolation method for calculating the median for grouped data (that is to say, data “binned” into frequencies per category, where individual data items are not available). They extended the method to calculate the median of discrete ungrouped data such as SET scores. Some commercially available systems that process and report on SET surveys (for example, Blue from ExploranceFootnote1) do now compute and report the IM.
The value and relevance of the IM for fuzzy data that represent ordinal sentiment/satisfaction responses on an SET survey can best be explained if we think of the set of discrete responses on a Likert scale as representing a distribution of perspectives held by the respondents that actually vary in degree much more finely than by the simple scale units offered. Each numerical score assigned to represent a value label is therefore understood as representing a “cluster” of responses that span a range. For example, the group of students who select 4 (“Agree”) in response to a SET question can be understood to encompass a range of perceptions, from those bordering on “Neutral” (a score of 3) to those leaning towards “Strongly Agree” (a score of 5). The numerical representation of 4 can therefore be better understood as the mid-point of an actual perspective interval ranging from 3.5 to 4.5. This is true for each “score” on a Likert scale.
How can we determine whether more students are at the 3.5 or the 4.5 end of that spectrum, when they selected a score of 4? This is where the IM can help. Consider an example in which the simple median of a set of SET responses on a 5-point Likert scale is 4 (“Agree”). Recall that for interval data of this kind, this simple median (midpoint) of 4 may actually represent student sentiment closer to 3.5 or closer to 4.5. Interpolation allows the simple median to be meaningfully adjusted upwards or downwards, depending on the overall distribution of scores in the set of responses, to better represent the overall distribution of student perspective. Where the overall proportion of scores above the value of the simple median score is higher, it is meaningful and valid to adjust the median score upwards; where the overall proportion of scores below the value of the simple median is higher, it is meaningful and valid to adjust the median score downwards. Such adjustments to the median therefore accommodate a measure of overall sentiment distribution into the IM as a measure of central tendency.
2.2. The need to represent ‘percent favourable rating’
A balanced Likert-type rating scale contains equal number of favourable and unfavourable response categories, often, but not necessarily, centred around a “neutral” category. Thus, the bounds of what constitutes favourable rating are well defined. For example, in a balanced 5-point rating scale, and within the context of interpolation (as shown above), the lower bound for a favourable rating is 3.5. On the other hand, an unbalanced rating scale, would have unequal number of favourable and unfavourable categories (Friedman et al., Citation1981). Furthermore, which end of an unbalanced scale has more response categories depends on the choices a researcher makes based on their knowledge of the target audience. For this reason, the bounds of what constitutes a favourable rating can vary depending on which end of the scale has more response categories. The use of percent favourable ratings in this paper therefore applies to balanced rating scales.
For a balanced Likert-type rating scale, percent favourable (PF) rating is the percentage of responses that are higher than “neutral”. PF is a simple yet meaningful statistic and is a good indicator of overall student satisfaction with their learning experience.
Students do in fact tend to rate their instructors favourably more often than not (Nulty, Citation2008). For example, in a 2014 study of 4 years of SET data from the University of British Columbia (UBC), Canada, Zumrawi et al. (Citation2014) found that, overall, greater than 78% of student responses were favourable (defined as responses of “Agree” (4) or “Strongly Agree” (5) on a 5-point Likert scale).
2.3. Dispersion index: an appropriate measure of score distribution
If we accept that the distribution of student response scores on Likert scale SET surveys is significant and meaningful, how can we best represent it numerically? While Stark and Freishtat (Citation2014) propose the use of bar charts, these clearly do not offer an efficient or reportable metric. Historically, standard deviation (a measure of score variability in relation to the mean) has been employed as a measure of data dispersion. But as with the mean itself, standard deviation is not an appropriate measure of distribution of ordinal data such as SET scores (Rampichini et al., Citation2004). Instead, we concur with these authors and make use of a measure of dispersion which is more appropriate for categorical data. This particular Dispersion Index (DI) ranges in value from 0 to 1.0. A value of 0 is obtained when all student respondents agree on the same rating. A value of 1.0, on the other hand, occurs when respondents split 50/50 between the two extreme responses, e.g., “Strongly Disagree” and “Strongly Agree” in the case of a 5-point Likert scale.
2.4. New metrics for meaningful representation of instructor SET scores
To overcome the statistical challenge described above, we therefore propose that SET scores for educators are more appropriately and meaningfully represented using the interpolated median (IM) as a measure of central tendency and the percent favourable (PF) rating. The use of these two statistics, along with a measure of dispersion suitable for ordinal data, provides much more appropriate metrics for reporting of SET data than the commonly used arithmetic mean and standard deviation. Through investigation of a sample set of SET data, we illustrate, below, the properties of the IM as a measure of central tendency for SET data collected using a balanced, 5- or 7-point, Likert scale survey instrument. Moreover, we demonstrate a previously unreported relationship between the IM and PF and show how these two statistics can be combined with an appropriate measure of dispersion to summarize and interrogate SET data in a more meaningful way that can reveal nuanced differences in student perspectives.
3. Methods
In this study, we used SET data collected at the University of British Columbia, Canada, during the 2018 and 2019 academic years, to illustrate the implementation of the proposed metrics. (The analysis examines anonymized data from standard annual university surveys and is exempted from Research Ethics Board review as institutional quality assurance research). Standard UBC evaluation of teaching surveys is released to students a few weeks before final exams. The survey items are modular in nature and include university module items (UMI), and academic unit-specific items. The UMI and most academic unit-specific items use a 5-point Likert scale; some academic unit-specific items use a 7-point scale. In the UMI items, students are invited to use the 5-point Likert scale to indicate their level of agreement with the item statements: 1 = “Strongly Disagree”, 2 = “Disagree”, 3 = “Neutral”, 4 = “Agree”, 5 = “Strongly Agree”.
For the purposes of this study, we focused on SET data from five UMIs, gathered by 16,982 SET surveys in the two academic years. While the vast majority of these surveys employed a 5-point Likert scale, a small subsample of surveys from one academic unit that made use of a 7-point scale, was used to illustrate the extension of the proposed methodology from a 5-point scale to a 7-point scale. For each course/instructor survey, we computed summary statistics, including the mean, median, IM, DI, and PF rating.
It is important to note that the relationships between the statistics in the proposed metrics are based on the properties of these statistics, within the context of a balanced rating scale. For this reason, these metrics are applicable to survey data from balanced Likert-type rating scales. UBC SET data is used for illustrative purposes.
3.1. Calculation of interpolated median, percent favourable rating and dispersion index
3.1.1. Percent favourable (PF) rating
PF rating represents the proportion of responses that are strictly greater than a “Neutral” response on a balanced Likert-type rating scale (see, for example, Nulty (Citation2008)). For example, in the case of a 5-point scale, PF rating is calculated by dividing the sum of “Agree” and “Strongly Agree” responses by the total number of responses, expressed as a percentage.
3.1.2. Interpolated median (IM)
We used the following form of the IM formula (Lorenz, Citation2018):
where:
M = the standard or customary median of responses
Ns = number of responses less than M
Ne = number of responses equal to M
Ng = number of responses greater than M
EquationEquation (1)(1)
(1) is employed in cases where at least one response is equal to the median. In this case, and depending on the distribution of scores, the median is adjusted upwards or downwards by the quantity [(Ng - Ns)/(2Ne)]. The range of this adjustment quantity is (−0.5, 0.5), i.e., IM is calculated by adjusting the median downwards by a (negative) value that is >−0.5 or upwards by a (positive) value of <0.5.
EquationEquation (2)(2)
(2) is employed in cases where no response is equal to the median and no interpolation is required, i.e., IM is equal to the customary median.
3.1.3. Dispersion index (DI)
The DI is calculated using the following formula, as described by Rampichini et al. (Citation2004):
Where:
D = Dispersion Index
K = 1, 2, …; K is the categories of possible responses for each item
Fk = the relative cumulative distribution of responses
DI ranges in value from 0 to 1.0. A value of 0 is obtained when all student respondents agree on the same rating. A value of 1.0, on the other hand, occurs when respondents split 50/50 between the two extreme responses, e.g., “Strongly Disagree” and “Strongly Agree” in the case of a 5-point Likert scale.
4. Results
4.1. The differentiating power of the interpolated median
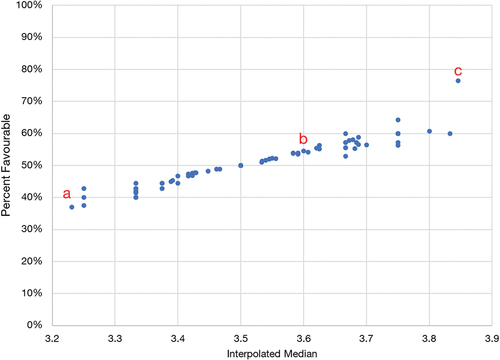
To demonstrate that the IM offers a simple measure of central tendency in a set of Likert scale scores that represents score distribution better than the arithmetic mean, Figure gives a scatter plot of 83 SET ratings from the 2019 academic year. All 83 of these individual instructor surveys yielded the same mean score (3.4) but are found to possess a wide range of IM and PF ratings: IM ranges from 3.2 to 3.8, and the associated PF rating ranges from 37% to 76%.
Figure 1. Percent favourable ratings and interpolated medians for sets of instructor SET scores with the same mean score.
To further demonstrate the differentiating power of the IM and PF rating, Figure shows raw score distribution for three exemplar sets of instructor SET scores with (a) the lowest, (b) intermediate, and (c) highest IM, selected from the set shown in Figure . While the set of raw scores for each individual yields a mean of 3.4, they display very different score distributions (reflected in the different IMs and PF ratings).
Figure 2. SET score distribution for the highest, middle, and lowest points (instructors) drawn from Figure 1 (mean of each = 3.4).
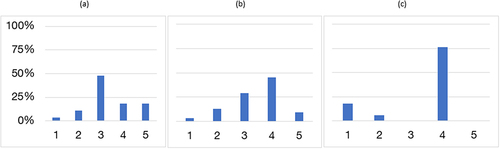
Given that students tend to rate their instructors favourably more often than not (Nulty, Citation2008) and since the mean SET score achieved by each of these educators was 3.4, all three ratings would have been deemed “below average” in terms of teaching performance. However, the IMs of the SET score distributions were 3.2, 3.6, and 3.8, respectively; the corresponding PF ratings were 37%, 55%, and 76%, respectively, making it clear that two of these three instructors achieved majority favourable scores from respondents, and in one case more than three out of four students rated their instructor favourably. This example illustrates the power of the IM as a measure of central tendency to more appropriately capture and represent the real distribution of respondent perspectives.
4.2. Relationship between the interpolated median and percent favourable rating
Recall that in Equationequation (1)(1)
(1) of the IM formula, IM is calculated by adjusting the median downwards or upwards by value that is <0.5. Thus, a median (50th percentile) of 3 or less, on a 5-point scale, would yield an IM of <3.5 and would necessarily be associated with a PF < 50%, whereas, on the favourable end of the scale, a median of 4 or more would yield an IM > 3.5 and would necessarily be associated with a PF > 50%.
Recall that Equationequation (2)(2)
(2) is used when there is an even number of data points or responses and no response is equal to the median. In this case, no interpolation is needed, and the median would be the midpoint between two observed scores. If the median falls in the favourable end of the scale (between scores of 4 and 5), PF will necessarily be >50%. On the other hand, if the median falls in the unfavourable end of the scale, PF will necessarily be <50%. If, however, the median is between favourable and unfavourable responses, e.g., between scores of 2 (disagree) and 4 (agree) …, etc., PF will be exactly 50%. Table shows all-possible outcomes, for a balanced 5-point scale, where the median is the midpoint between a favourable and unfavourable response. The expected range of DI (Equationequation 3
(3)
(3) ) is also shown. It could be seen in Table that for IM < 3.5, a PF of exactly 50% is only possible at IM of 2.5 or 3 and will be associated with high dispersion. For example, when the median, and hence IM, is the midpoint between a score of 1 (strongly disagree) and a score 5 (strongly agree), the data will be split evenly between the two extreme responses, resulting in maximum DI, indicative of polarized rating.
Table 1. All possible outcomes (for a 5-point scale) where the median is the midpoint between a favourable and unfavourable response (IM equation 2) resulting in a PF of exactly 50%
It follows then, that for a 5-point balanced scale, an IM of 3.5, with a PF of exactly 50%, is the pivot point in the IM/PF relationship, such that an IM < 3.5 is associated with PF not exceeding 50% and an IM > 3.5 is associated with a PF of at least 50%.
Similarly, for a 7-point balanced scale, and in the case of Equationequation (1)(1)
(1) , a median of 4 or less would yield an IM of <4.5 and would necessarily be associated with a percent favourable <50%, whereas, on the favourable end of the scale, a median of 5 or more would yield an IM > 4.5 and would necessarily be associated with a PF exceeding 50%. Furthermore, in the case of Equationequation 2
(2)
(2) , and for IM < 4.5, a PF of exactly 50% is only possible at IMs of 3, 3.5, or 4, with a maximum DI occurring at IM of 4, when it is the midpoint between the extreme scores (1 and 7).
It follows then, that for a balanced 7-point scale, an IM of 4.5, with a PF of exactly 50%, is the pivot point for the relationship between these two statistics.
This relationship underpins our submission that IM and PF rating, along with a suitable measure of dispersion (DI), provide a more meaningful approach to summarizing, interrogating, and presenting SET data from a balanced rating scale.
4.3. An illustration of the implementation of the proposed metrics
We used SET data from two academic years at UBC (16,982 surveys) to illustrate this interesting and previously unreported relationship between IM and PF rating.
A tabular representation of this relationship is shown in Table . This example shows SET data for the UMI that reads “The instructor helped inspire interest in learning the subject matter”. The table shows the distribution of surveys when clustered into five categories by IM and eight categories by DI (recall that DI represents a measure of “score variability per survey”; the higher the DI, the greater the level of “disagreement” between respondents). The number of surveys in each grouping is given per cell, and the average PF rating is given in parentheses.
Table 2. Relationship between the interpolated median and percent favourable rating
As would be expected, by and large the PF rating decreases as dispersion increases in the first three rows (IM of >3.5) but increases with dispersion in the lower two rows (IM < 3.5). Thus, surveys in the upper left cells of Table have high IM values with low variability in student scores, resulting in higher PF ratings. Cells in the lower left-hand area of Table , on the other hand, show low IM values with low variability in student scores, resulting in low PF ratings. Furthermore, surveys in the bottom two rows, corresponding to an IM < 3.5, have PF ratings not exceeding 50%.
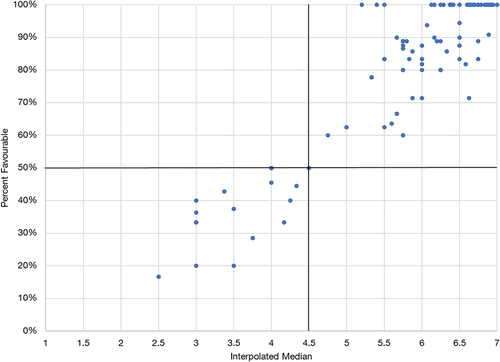
The relationship between these two statistics can be illustrated further by means of a simple scatter plot. Figure offers a graphical depiction of the IM and PF ratings from the 16,982 surveys presented in Table .
Figure 3. Relationship between the interpolated median and percent favourable rating on a 5-point Likert scale.
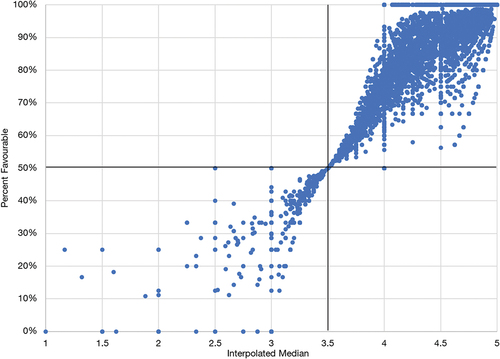
In Figure , data points in the upper right quadrant represent instructors whom at least half of the respondents rated favourably (PF rating ≥50%); data points in the lower left quadrant represent instructors whom at least half of SET survey respondents did not rate favourably (PF rating =<50%).
As shown above, for a 5-point balanced rating scale, no SET ratings with an IM below 3.5 would have a PF rating above 50% nor would ratings with an IM above 3.5 ever have PF ratings below 50%. Thus, no data points could possibly fall in the upper left or lower right quadrants of Figure . Recall that within the context of interpolation, a score of “Agree” (4), on a 5-point scale, is understood to hold a range of perceptions, from those bordering on “Neutral” (3) to those leaning towards “Strongly Agree” (5). In this context, the IM value at the pivot point (3.5) is the lower bound for an “Agree” response, thus it is the lower bound for favourable ratings. As an aside, this allows us to immediately understand that the instructors whose SET survey score distributions are shown in Figures ) had PF ratings of >50%, based on their IMs of 3.6 and 3.8.
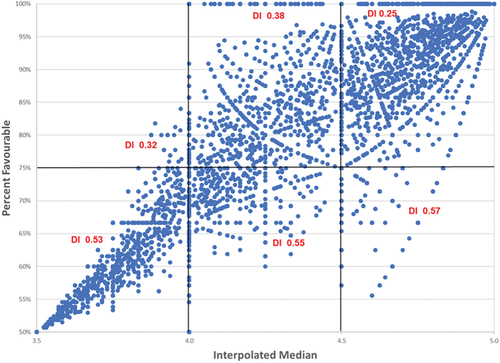
Another property of this relationship is that PF ratings approach 50%, with decreasing variance, as the IM approaches 3.5, from above or below.2. Furthermore, for IM > 3.5 (upper right quadrant of Figure ), and for a given IM, PF rating decreases as dispersion increases (Figure ). However, in the lower left quadrant (IM < 3.5), PF increases as dispersion increases.
Figure 4. Relationship between percent favourable rating and dispersion index for IM > 3.5, on a 5-point Likert scale.
As discussed above, this relationship extends to situations where SET surveys use a balanced 7-point scale, with the lower bound for an “Agree” response (and thus, the pivot point) being 4.5. An example from the UBC data is shown in Figure .
Figure 5. Relationship between the interpolated median and percent favourable rating on a 7-point Likert scale.
5. Discussion
Some decades ago, McIntosh (Citation1979) noted that the use of statistical information is one of the several barriers to the successful implementation of real insights from educational research in higher education, especially when implementation is in the hands of “non-numerate decision-makers” (p. 81). Educator and educational administrator data literacy continues to complicate effective use of educational data (Macfadyen et al., Citation2014).
We recognize that many educational leaders default to using means and standard deviations to analyse SET data, because these metrics are relatively simple and well understood. However, the use of parametric tests (based on the arithmetic mean and standard deviation) in student evaluations of teaching has been the subject of much criticism, because (as discussed above) students tend to rate their instruction experience favourably more often than not, resulting in the data being negatively skewed (not meeting distributional assumptions for parametric analysis). Given the centrality of SETs in contemporary academic management and quality assurance processes in higher education, we argue that it is now increasingly important to ensure the appropriateness and fairness of metrics used to summarize and report on instructor teaching evaluations.
By definition, the IM reflects the distribution of scores above and below the customary or standard median (50% percentile) and, as such, is a better measure of location for SET data than the mean.
Moreover, in this paper, we have demonstrated in theory, and illustrated through analysis of exemplar SET survey data from UBC, an interesting and previously unreported relationship between the interpolated median and percent favourable rating, defined as the proportion (percentage) of responses higher than neutral in the total set of SET survey responses received by an instructor, on a balanced rating scale.
As a general rule, for surveys employing a 5-point Likert scale, an IM of 3.5 corresponds to a PF rating of 50% and divides the evaluations into two distinct classes: above and below 50% favourable rating. In the neighbourhood of this pivot point (IM 3.5, PF 50%), the relationship is fairly linear. However, for higher or lower IM values (away from the pivot point), the DI provides a good insight into the variability of PF rating for a given range of IM (Figure ). For example, it is evident from Figure that an instructor survey with an IM as high as 4.7 (on a 5-point scale) could have favourable rating of only 60%, due to high dispersion. This confirms the insight gained by using IM, PF, and dispersion measure suitable for ordinal data.
6. Conclusion
Students have the capacity to offer critical feedback on their experiences of teaching and learning, helping to close the loop between educators and learners. We affirm that student evaluations can and should be implemented as part of an overall teaching evaluation system, which may also include regular peer review of teaching, educator self-assessment, and other forms of assessment and learner feedback. However, we and others (see, for example, Kitto et al., Citation2019) have made a clear case that parametric analysis of SET data is a poor choice and can result in inappropriate interpretations and judgments of teaching performance that may have lasting impact on educators’ professional lives. Parametric analyses, using the mean and standard deviation, can be appropriate for analysis of ordinal data, if certain distributional assumptions are met, but SET data do not meet such distributional assumptions. We acknowledge that implementing and explaining more complex statistical methods adds an additional burden to effective use of SET feedback. We assert, nonetheless, that by definition, and as we have demonstrated here, the interpolated median provides more and better information about the real distribution of student responses to evaluation questions, and as such is a better representation of the centre of the data.
We have also presented an interesting and previously unreported relationship between the interpolated median and percent favourable rating and elaborated on how data dispersion affects the relationship. Furthermore, we have demonstrated through the use of simple graphics how these three statistics can allow a more meaningful interrogation of SET data, offering better insight into student feedback. This simple approach is a significant improvement in process compared to the use of a single statistic (usually the mean).
Based on these findings, it is our recommendation that SET data be summarized, reported, and interpreted using the IM and PF rating, combined with a measure of dispersion suitable for ordinal data (such as DI).
Only through the use of appropriate metrics to represent the outcomes of student evaluation of teaching can we ensure that the real and nuanced distribution of student feedback on their different experiences of instruction is as complete and representative as possible, that interpretation of teaching evaluations is appropriate and fully informed, and that judgments made about the teaching effectiveness of academic staff are meaningful and fair.
Correction
This article has been corrected with minor changes. These changes do not impact the academic content of the article.
Disclosure statement
No potential conflict of interest was reported by the author(s).
Additional information
Notes on contributors
Abdel Azim Zumrawi
Abdel Azim Zumrawi is a statistician with the Planning and Institutional Research (PAIR) Office at the University of British Columbia. He has a diverse research background in applied statistics, including work on decision-support tools used in natural resources management. More recently, his work has focused exclusively on quantitative methods and measurements related to learning analytics and student evaluation of teaching.
Leah P. Macfadyen
Leah P. Macfadyen is an Assistant Professor of Teaching in the Faculty of Education at the University of British Columbia. Her work concerns teaching and learning in online learning environments, and she has contributed to the emerging field of learning analytics in the past decade, inspired by its potential of learning data to offer actionable insights into our teaching and learning contexts and practice.
Notes
References
- Aleamoni, L. M. (1999). Student rating myths versus research facts from 1924 to 1998. Journal of Personnel Evaluation in Education, 13(2), 153–13. https://doi.org/10.1023/A:1008168421283
- Bacci, S., & Caviezel, V. (2011). Multilevel IRT models for the university teaching evaluation. Journal of Applied Statistics, 38(12), 2775–2791. https://doi.org/10.1080/02664763.2011.570316
- Blackmore, J. (2009). Academic pedagogies, quality logics and performative universities: Evaluating teaching and what students want. Studies in Higher Education, 34(8), 857–872. https://doi.org/10.1080/03075070902898664
- Clayson, D. E. (2009). Student evaluations of teaching: Are they related to what students learn? A meta-analysis and review of the literature. Journal of Marketing Education, 31(1), 16–30. https://doi.org/10.1177/0273475308324086
- Feldman, K. A. (2007). Identifying exemplary teachers and teaching: Evidence from student ratings. In R. P. Perry & J. C. Smart (Eds.), The scholarship of teaching and learning in higher education: An evidence-based perspective (pp. 93–143). Springer Netherlands.
- Friedman, H., Friedman, L. W., & Wilamowsky, Y. (1981). A comparison of balanced and unbalanced rating scales. Mid-Atlantic Journal of Business, 19(2), 1–7.
- Galbraith, C. S., Merrill, G. B., & Kline, D. M. (2012). Are student evaluations of teaching effectiveness valid for measuring student learning outcomes in business related classes? A neural network and Bayesian analyses. Research in Higher Education, 53(3), 353–374. https://doi.org/10.1007/s11162-011-9229-0
- Guilford, J. P., & Fruchter, B. (1978). Fundamental statistics in psychology and education. McGraw-Hill.
- Harris, R. J. (2001). A primer of multivariate statistics (3 ed.). Psychology Press. https://doi.org/10.4324/9781410600455
- Kitto, K., Williams, C., & Alderman, L. (2019). Beyond average: Contemporary statistical techniques for analysing student evaluations of teaching. Assessment & Evaluation in Higher Education, 44(3), 338–360. https://doi.org/10.1080/02602938.2018.1506909
- La Rocca, M., Parrella, M. L., Primerano, I., Sulis, I., & Vitale, M. P. (2017). An integrated strategy for the analysis of student evaluation of teaching: From descriptive measures to explanatory models. Quality & Quantity, 51(2), 675–691. https://doi.org/10.1007/s11135-016-0432-0
- Lorenz, J. (2018). Ranking between the lines: A macro for interpolated medians. SAS Global Forum 2018. https://support.sas.com/resources/papers/proceedings18/2508-2018.pdf
- Macfadyen, L. P., Dawson, S., Pardo, A., & Gašević, D. (2014). Embracing big data in complex educational systems: The learning analytics imperative and the policy challenge. Research & Practice in Assessment, 9, 17–28. http://www.rpajournal.com/dev/wp-content/uploads/2014/10/A2.pdf
- Manikandan, S. (2011). Measures of central tendency: Median and mode. Journal of Pharmacology and Pharmacotherapeutics, 2(3), 214–215. https://doi.org/10.4103/0976-500x.83300
- Marsh, H. W. (1987). Students’ evaluations of university teaching: Research findings, methodological issues, and directions for future research. International Journal of Educational Research, 11(3), 253–388. https://doi.org/10.1016/0883-0355(87)90001-2
- Marsh, H. W. (2007). Students’ evaluations of university teaching: Dimensionality, reliability, validity, potential biases and usefulness. In R. P. Perry & J. C. Smart (Eds.), The scholarship of teaching and learning in higher education: An evidence-based perspective (pp. 319–383). Springer Netherlands.
- McIntosh, N. E. (1979). Barriers to implementing research in higher Education. Studies in Higher Education, 4(1), 77–86. https://doi.org/10.1080/03075077912331377121
- Nulty, D. D. (2008). The adequacy of response rates to online and paper surveys: What can be done? Assessment & Evaluation in Higher Education, 33(3), 301–314. https://doi.org/10.1080/02602930701293231
- Rampichini, C., Grilli, L., & Petrucci, A. (2004). Analysis of university course evaluations: From descriptive measures to multilevel models. Statistical Methods & Applications, 13(3), 357–373. https://doi.org/10.1007/s10260-004-0087-1
- Spooren, P., Brockx, B., & Mortelmans, D. (2013). On the validity of student evaluation of teaching: The state of the art. Review of Educational Research, 83(4), 598–642. https://doi.org/10.3102/0034654313496870
- Stark, P., & Freishtat, R. (2014). An evaluation of course evaluations. ScienceOpen Research, 0(0 1–7). https://doi.org/10.14293/s2199-1006.1.sor-edu.aofrqa.v1
- Tabachnick, B. G., & Fidell, L. S. (2021). Using multivariate statistics (7 ed.). Pearson.
- Zumrawi, A. A., Bates, S. P., & Schroeder, M. (2014). What response rates are needed to make reliable inferences from student evaluations of teaching? Educational Research & Evaluation, 20(7–8), 557–563. https://doi.org/10.1080/13803611.2014.997915