Abstract
Student satisfaction surveys are widely accepted for measuring the quality of students’ overall experience with the received teaching and informing the design of improvements in higher education. However, several studies have shown that these surveys have biases that may lead to discrimination or unfair decisions against female academics. Yet it is unclear how these undesirable factors are evolving with time or to what extent they are present in different contexts. In this study, we investigate survey results from a large University in Spain for two academic years, 2021–2022 and 2022–2023. Our analysis examines these gender biases by evaluating the influencing factors from the perspective of professors and students at the level of the entire university and individual centers. The results obtained using this approach provide multifaceted evidence of gender bias disadvantaging women, especially in some academic disciplines, and that is particularly noticeable in the extremes of student satisfaction distributions.
Reviewing Editor:
1. Introduction
Student satisfaction surveys are useful for measuring students’ overall perception of higher education. They have been used for many years, helping decision-making and providing professors and institutions with information to improve courses and teaching practices (Aleamoni, Citation1999; Guolla, Citation1999). In fact, measuring performance in academia using surveys is indeed relevant to focus on specific aspects of teaching practice (Kane & Staiger, Citation2012).
Although surveys may help improve excellence in higher education settings, they may also be subject to undesirable factors (e.g. gender bias) (Bedggood & Donovan, Citation2012) that act as confounders when trying to measure of the quality of education provided by professors. Recent studies have described various factors that affect the perception of student satisfaction, such as the gender of the professors (Heffernan, Citation2023; Mengel et al., Citation2018), the age of the professor (Flegl & Andrade Rosas, Citation2019), the level of the course (Boring, Citation2017), departments’ gender composition (Aragón et al., Citation2023), disciplines (Kanwar & Sanjeeva, Citation2022), teaching experience (Berbegal-Mirabent et al. 2018), among others (Heffernan, Citation2022).
Student’s satisfaction as measured by surveys can be biased. We remark that this term, ‘bias,’ can be used to signify different things. A statistical bias occurs when an object systematically deviates from the actual truth; for instance, a biased estimator that on expectation is higher or lower than the average of the quantity being estimated, could be considered biased. Then, one could also speak of a cognitive bias, preventing someone from being rational. Bias can also mean a prejudice, a judgment or evaluation that is done before knowing the facts based on a preconceived notion, or a conflict of interest, preventing someone from being impartial.
Throughout this paper, we focus on statistical biases. Determining whether there is any statistical bias in the student evaluations depends on how we conceive the relationship between the constructed space (whether someone is a ‘good’ professor) and the observed space (whether a professor obtains a high score in the student’s evaluation). In the algorithmic fairness literature, this relationship is often referred to as a worldview (Friedler et al., Citation2021).
The ‘what you see is what you get’ (WYSIWYG) worldview assumes that the observed space corresponds closely to the constructed space. The ‘we are all equal’ (WAE) worldview assumes that along certain dimensions, there are no differences between objects in the constructed space, and hence any difference in the observed space is a bias. In this study, we adopt the WAE worldview: we assume that gender has no effect on the quality of teaching, i.e. that men and women can be equally good professors, and measure statistical biases in different partitions of the student’s evaluations in particular, by gender of the professor and the student. Different from previous studies, we are clear about our assumptions using the literature on algorithmic fairness and measuring statistical biases, considering different dimensions in the analyses, such as the gender of the professor and the student, department, course level, and age of the professor.
Gender bias is an evolving phenomenon that needs to be continuously monitored, considering different contexts. To understand whether there are gender biases in the context of a higher education university in Spain, we aim to answer the following research questions:
RQ1 - Does the gender of the professor impact the level of student satisfaction with their teaching?
RQ2 - Does gender impact the level of student satisfaction with professors on either the basis of their own gender or the gender of the professor?
RQ3 - Does the gender of the professor impact the level of student satisfaction within different academic centers?
RQ4 - Does the gender of the professor impact the level of student satisfaction within different levels of academic courses?
RQ1 and RQ2 are based on Boring (Citation2017) which found gender differences in student satisfaction, with male students biased in favor of male professors. RQ3 is based on Aragón et al. (Citation2023) and Rosen (Citation2018) who investigated gender and the impact of teaching evaluations across various academic departments and disciplines. Lastly, RQ4 is based on Aragón et al. (Citation2023) which found gender differences related to academic level.
In light of that, we hypothesize that professors are evaluated differently based on gender (RQ1H1), and on the match of the gender of the professors and the students (RQ2H1). We also expect to find differences among the different academic centers, which in the university under study, often correspond to departments of diverse academic disciplines (RQ3H1), as well find differences related to the levels of the courses (RQ4H1).
We answer these research questions following a structure that allows us to evaluate gender bias in different dimensions by carrying out the analysis incrementally, adding one dimension at a time:
Analysis at the level of the entire University (Section 4.2)
Gender of the professor
Gender of the professor vs Age
Analysis per center (Section 4.3)
Gender of the professor vs Centers
Gender of the professor vs Gender of the student vs Center
Analysis per course level (Section 4.4)
Gender of the professor vs Level of the course
Gender of the professor vs Gender of the student vs Level of the course
The rest of this paper is organized as follows. Section 2 overviews previous work related to ours and the background. Section 3 present the context of our work and the dataset of answers to a student satisfaction survey that we analyze. Section 4 presents the analysis’ results. Section 5 discusses the results, and Section 6 presents our conclusions, limitations, and future work.
2. Literature review and background
2.1. Biases in student satisfaction surveys
Student satisfaction surveys have been used for many years in higher education. Most of the literature we surveyed finds gender-related differences in student surveys, but there are a few exceptions. Suarman (2014) analyzed aspects such as lecture motivations, instructional design, and lecture efficiency with a descriptive analysis using mean, standard deviations, and index matching to measure perceptions of student satisfaction based on gender. They found no significant difference in perceptions of the quality of teaching based on gender. Similarly, Arrona-Palacios et al. (Citation2020) report that considering specific criteria (i.e. methodology, evaluation system, learning guide), the gender of the professors does not seem to influence student evaluations. However, when the students are asked about an overall perception of teaching performance (‘Would you recommend this professor?’), they tend to favor male professors more than female professors, by a small amount.
In contrast, most previous work describes gender differences, and often those differences are disadvantageous to women.
While questionnaires aim to evaluate the performance of faculty and the quality of education, factors unrelated to quality have been observed to influence student satisfaction (Kanwar & Sanjeeva, Citation2022). Yet, the research considers student satisfaction an essential indicator of teacher evaluation, with reliability and validity for improving instruction, making decisions related to personnel, as well as learning about the student’s perceptions of their experience in the classroom (Berk, Citation2005; Kane & Staiger, Citation2012; Marsh, Citation2007).
Berbegal-Mirabent et al. (Citation2018) evaluated the influence of teaching experience, observing the mediation effect of research intensity in the relationship of these variables. The study found that teaching experience impacts positively student satisfaction, which also leads to increased levels of research intensity. In contrast, research intensity impacts negatively the rates of student satisfaction.
He and Freeman (Citation2021) studied the effects of low response rates in student satisfaction surveys, using Monte Carlo simulation with the aim of observing the criteria related to the survey (i.e. response rates, class sizes, and evaluation score) and their impact on accuracy. The authors found that reliable teaching evaluations are achieved when the response rate and/or teaching performance are high in the dataset. But also, moderate rates of response can achieve reliable accuracy.
Rosen (Citation2018) used data from RateMyProfessors.com to measure trends and correlations among various criteria, such as the impact of discipline (STEM vs. humanities and arts) and gender. Rated attractiveness and the nature of the discipline being taught were observed to lead to differences in scores for male and female professors. Boring (Citation2017) observed that across various dimensions, male and female students tend to give higher rates to male professors, especially in roles that reinforce male stereotypes. According to Aragón et al. (Citation2023), a department’s gender composition and the course level impact the student’s perceptions of satisfaction, creating biases that disadvantage women.
Radchenko (Citation2020) identified various biases in student satisfaction scores within a large dataset from an American research university; these biases were related to the professor, course, and class, among other factors. These authors describe key statistical problems, such as the non-deterministic and qualitative nature of satisfaction. The assumptions when using this measure are based on a deterministic parameter, and the variance of the mean is due to differences in student satisfaction.
Mengel et al. (Citation2018) found that female instructors receive lower evaluations, from both male and female students, with differences more pronounced when male students rate their instructors. The authors combined data from students’ course grades, the teaching evaluations, and the number of hours students spent studying a course as a measure of effort for the analyses.
That student satisfaction depends on the gender of professors was also demonstrated in Heffernan (Citation2023), which presents an analysis of a survey of 674 academics and 16,000 higher education institutions, including comments that students leave about their courses and the teaching they receive. The study revealed that 59% of academics faced abusive comments, with women and minority groups experiencing more personal and sexual comments from students.
Another study (Al-Issa & Sulieman, Citation2007) found potential biases in certain linguistic and cultural contexts, revealing their connection to students’ expected grades and teachers’ genders, ages, nationalities, and personalities.
Most previous work considered data in aggregate, which may obscure some nuances of discrimination.
2.2. Algorithmic fairness
We find it helpful to evaluate gender bias in a disaggregate manner, using statistical group discrimination (Lippert-Rasmussen, Citation2013) and algorithmic fairness concepts. In algorithmic fairness, the notion of fairness is sometimes interpreted as a transformation of the ‘construct space,’ which is a combination of the ‘observed’ space and the ‘decision’ space related to the decision-making process within a specific task (Friedler et al., Citation2016).
Based on that, fairness is defined as mapping the constructed space to the decision space, with desirable constraints such as ensuring that similar objects in the constructed space are also close to the decision space. The assumption ‘what you see is what you get’ (WYSIWYG) considers that the construct and observed spaces are the same. The assumption ‘we are all equal’ (WAE) assumes that in the constructed space, there are no differences; in our case, that gender plays no role in the quality of teaching delivered.
Following previous work, we use statistics such as mean and variance for comparing performance across subgroups. However, and in contrast with previous work, we are explicit about our assumptions regarding the relationship between the construct and observations.
According to the worldview ‘We are All Equal (WAE)’ as defined by Friedler et al. (Citation2016), any evaluation differences between two groups that are assumed to be equal are an indication of biases. We apply statistical measurement of differences between the evaluation of men and women professors as an indicator of gender biases under the WAE assumption.
Methodologically, we standardize student responses, evaluate extreme values, and consider different levels and relationships between the professor and students’ genders, departments/centers, and levels of the course.
2.3. Gender, organizations, and motivation
The gender differences found in the literature about student evaluations that are often disadvantageous to women align with the theory of gendered organization (Rodriguez & Guenther, Citation2022), which refers to gender dynamics and their impact on different dimensions of social, political, economic, and technological life.
Research also suggests that the mismatch between the expected women attributes and the concept of success in male-typed positions also facilitates discriminatory behavior against women, known as the lack of fit model (Heilman, Citation1983). The lack of fit model implies that an inconsistency between stereotypes leads to the perception that women are not suitable for male-typed positions, which produces negative expectations about women’s performance and, consequently, the belief of a lack of competence (Heilman & Caleo, Citation2018).
Further, the expectancy theory of motivation (Vroom 1964) explains that individuals are motivated to engage in behaviors when there is a belief that their efforts will lead to higher performance or accomplish determined goals. The theory mentions three aspects that help understand scenarios and work relationships. The expectancy is a perception of the effort with the expected outcome. The valence is the attributed value to an individual of a desired outcome, and instrumentality is the trust that performance will lead to promised outcomes. In fact, the theory emphasizes the importance of aligning the efforts with the desired outcomes, recognizing the value of consequences to motivate actions by perceiving a clear connection between effort, performance, and outcomes.
In our context, this theory further motivates the relevance of our research questions, as if a professor always receives lower student satisfaction scores due to factors that are beyond their control, such as the presence of biases, the expectancy of improving teaching to improve student satisfaction scores may be low, consequently decreasing their motivation. Conversely, if the professor perceives that improvement in the teaching quality will also positively impact student satisfaction and consequently be rewarded (i.e. promotions), their performance to achieve a reward will be high.
3. Context and dataset
Our study is based on retrospectively analyzing the results of a student satisfaction survey, corresponding to the 2021-2022 and 2022-2023 academic years for undergraduate courses at a University in Spain (see details Appendix A).
The survey includes six questions regarding the subject and the instructor. Students are asked about teaching plans, methodologies, workload, subjects, and overall satisfaction of the professor. They answer on a numerical scale from zero to ten, with zero meaning complete dissatisfaction and ten meaning complete satisfaction. Beyond the student’s anonymous responses, we have information about the course, term, level of the course, enrollment number, center, an anonymized identifier for the professor, and the gender of each anonymized professor and student.
In our study, we analyze the data related to the satisfaction with the teaching received (the final question of the survey: ‘I am satisfied with the teaching received.’), considering various levels of analysis and considering the gender of the professors and students. Compared to the remaining survey questions, this specific question relies on the aspect of the teaching received that is more related to the instructor. It is also highly correlated with other questions of the survey. It has more than 0.7 Pearson’s correlation with the questions about satisfaction with the methodology, subject, and teaching compliance, and more than 0.5 Pearson’s correlation with the questions related to workload and planning.
3.1. Pre-processing
We used the reliability assessment (RAS index) filter (Scheaffer et al., Citation2011) to discard classes where the evaluation is unreliable because the number of respondents is too small in comparison to the number of enrolled students, to avoid their impact on accuracy (He & Freeman, Citation2021). We kept only classes with a ‘good’ or ‘sufficient’ number of responses according to the RAS index (RAS <= 0.5).
In our analyses, we start with a complete dataset containing all surveys from the courses offered during the observation period. The filtered dataset contains 25,465 responses. The evaluations are given by 6,657 students (3,982 women and 2,675 men, 60%/40%); most of the students at this university are women. Note that students can evaluate more than one professor. The classes evaluated are taught by 450 professors (167 women and 283 men, 37%/63%); most of the professors at this university are men (see ).
4. Gender-based analysis of responses
In this section, we analyze the distributions of scores in the student satisfaction question (‘I am satisfied with the teaching received’).
We present an analysis of gender bias at the level of the entire university (Section 4.2), per center (Section 4.3), and per course level (Section 4.4).
4.1. Standardization
We describe our results both in terms of the absolute scores given and in terms of standardized scores (‘z-scores’). To standardize the student evaluations per student (respectively per professor), we measure by how many standard deviations the score given by a student deviates from the average score given by a single student (respectively, from the average score received by the professor). A z-score of zero indicates the score is equal to the average, a negative z-score indicates a score below the average, and a positive z-score indicates a score above the average. This allows us to mitigate the effect of the variability of what the students consider an ‘average’ score.
4.2. University level analysis
The University level analysis considers student satisfaction at an aggregate level (see details Appendix C).
RQ1 - Does the gender of the professor impact the level of student satisfaction?
4.2.1. Gender of the professor
The average scores of professors in our dataset are depicted in , where each dot represents a professor. In this figure, we see the slightly lower average obtained by women professors.
Figure 1. Student satisfaction scale for 450 professors. Each dot is the mean score for a professor considering all courses passing the filter by reliability.
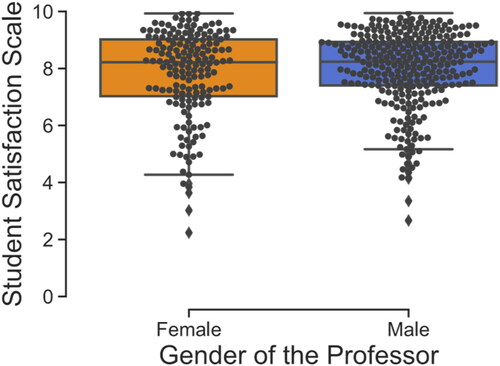
Next, we compute the percentage of extreme evaluations: those that are one or two standard deviations (SD) below the average for each student, to observe whether there are differences in the extremes. Results are in , where we can see that when the professor is a woman, students are more than twice as likely to give a score two SD below their own mean and overall have a larger chance of giving a score of one SD or less below their mean. We also show that a gap exists between men and women for evaluations that are above the mean for a student and one SD or more about the mean for a student (2 SD above the mean almost never happens).
Table 1. Evaluations by gender of the professor expressed in standard deviations across the entire university.
4.2.2. Gender of the professor vs age
We also consider the age of the professor, as in , we observe that female professors are more frequently penalized in different ranges of age. With higher variations and lower medians compared to male professors.
Figure 2. Student satisfaction scale by gender of the professor and age.
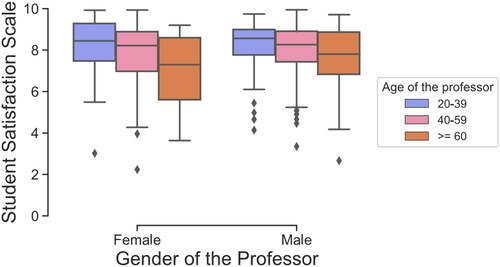
In we observe an effect of age in both, men and women professors. In general, the older the professor, the lower the evaluations. We observe this difference more pronounced in women professors.
Table 2. Evaluations by age and gender of the professor expressed in standard deviations.
RQ2 - Does gender impact the level of student satisfaction with professors on either the basis of their own gender or the gender of the professor?
When we consider the gender of the student in the analysis, we observe differences. As shown in , while female students give similar scores to male and female professors, male students tend to give lower scores to female professors on average.
Figure 3. (a) Student satisfaction scale for 450 professors with reliability assessment by gender of the student. The dots point represents the average score for each professor, based on the ratings given by male and female students averaged by the gender of the student. (b) De-biased student response with z-score transformation by gender of the student and gender of the professor.
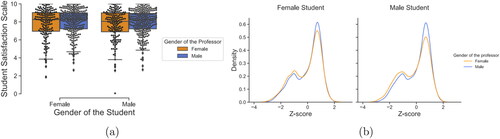
Specifically, the median is slightly lower, and the variance is higher for student evaluations written by a man for a woman professor, compared to other gender combinations. The density chart of z-scores in makes this more apparent. There are peaks at both positive and negative extremes favoring male professors over female professors.
We can see that the chance of giving an extremely negative score (-2 SD) is twice as large when the professor is a woman than when the professor is a man. Also, when we evaluate the z-scores above the mean (z-score > 0), we observe a consistent result: male professors are more likely to be given a positive evaluation or even a very positive evaluation (z-score > 1).
4.3. Per-center analysis
RQ3 - Does the gender of the professor impact the level of student satisfaction within different academic centers?
We focus on five specific centers. The two centers with the larger number of student evaluations (see details in C.2), Law (LAW) and Economics (ECO); the centers of Humanities (HUM) and Engineering (ENG) to represent two clearly different disciplines; and the center of Translation (TRA), which is the only center that has substantially more women professors than men (as per ).
4.3.1. Gender of the professor vs centers
We observe that in the centers of LAW (), the scores given to female professors and male professors are slightly different in terms of median and variance compared with the center of ECO (), ENG (), HUM (), and TRA (). However, ECO, LAW, and ENG have over 60% male professors in each center. In ECO, ENG, and TRA, women receive lower scores, in LAW and HUM, men and women receive the same scores on average. None of the studied centers shows women with better evaluations than men.
Figure 4. Student satisfaction scale by gender of the professor and centers.
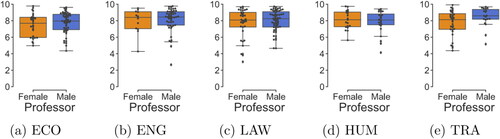
In the context of ENG, we can observe a higher variance for female professors. Yet, this result must be taken cautiously since the data (reliable evaluations) comes only from few female professors, as we can see from the dots in .
A detailed examination of shows that female professors are more likely to receive scores below the average. Particularly, LAW, TRA, and ENG show evidence of a higher percentage of negative scores with -2 SD for female professors, while HUM and ECO suggest less than 1% of difference between female and male professors.
Table 3. Evaluations by centers and gender of the professor expressed in standard deviations.
It is important to mention that at the center of HUM, there is a reduced level of gender disparity. In ENG, female professors have more extreme negative scores than male professors. When examining the scores above the average, we observe that the trend is reversed, with male professors being more likely to receive scores above the average. On the other hand, there is a slight difference in HUM, with female professors receiving 1% more evaluations with positive scores.
Aragón et al. (2023) demonstrated that gender disparity affects disproportionately women, receiving worse scores, especially in male-dominated departments. This can be explained by the lack of fit theory (Heilman & Caleo, Citation2018). However, the gender composition does not explain our results, as we see that even TRA, a departament that has a large proportion of woman professors, receives lower scores.
4.3.2. Gender of the professor vs gender of the student vs centers
When considering the gender of the students, we first observe that male students give male professors a higher median score than female professors in all centers except for LAW (), where they give a similar median score. For ECO (), TRA (), and LAW, we observe that female students give female professors worse scores compared with their rates for male professors. Male students also favor male professors in their ratings, except for LAW where the scores are better for female professors. In ECO, TRA, and HUM () we can see that female professors have higher variance independent of who is evaluating them, with a higher or lower median. At the same time, male professors, in this case, show lower variance but also higher median or similar ones. Specifically in TRA, we observe that male student gives lower median and also higher variance for female professors, although the majority of professors in this center are female professors.
Figure 5. Student satisfaction scale by gender of the professors and gender of the students and centers.
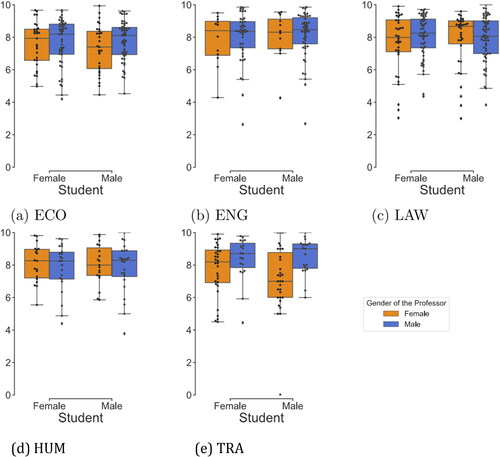
In ENG (), we observe that male and female students favor male professors while giving higher variance for female professors, although it is important to remark that there is data from few female professors in this group.
4.4. Per-level analysis
RQ4 - Does the gender of the professor impact the level of student satisfaction within different levels of academic courses?
In this section, we evaluate gender bias considering the level of the course, considering three different levels: introductory (first academic year), intermediate (second academic year), and advanced (third academic year and following years).
We observe two situations: female professors get lower satisfaction scores for the first and second years, with a lower median and higher variance than men. For the third year, female professors receive a higher variance, with a small difference in the median compared to male professors.
Considering the level of the course and evaluating the extremes in the distribution (), we can see that in the first academic year, female professors are more likely to receive negative scores and less likely to receive positive scores than male professors. The same phenomenon is observed for the second-year courses, but the difference is smaller than in the first academic year. Finally, in the third academic year or later, male professors are relatively more likely to receive negative evaluations and relatively less likely to receive positive evaluations than their female counterparts.
Table 4. Evaluations by levels and gender of the professor expressed in standard deviations.
shows that in the first year, and to some extent in the second year, both male and female students evaluate female professors with lower scores than male professors. However, while generally, scores in the third year are lower, female students give male professors higher grades than female professors in the third year and, to some extent, in the second year. The average and variance obtained by female professors follow the same pattern when male students rate in the three levels, while we see differences when female students evaluate them. For the first level, the measures are similar, rated by male students and female students.
Figure 6. Evaluations by course level, considering only the gender of the professor (left side), and the gender of the student by the gender of the professor.
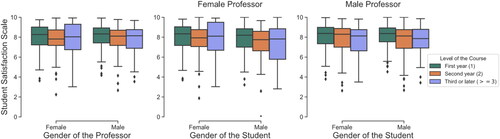
For the second and third levels, female students rate female professors better on average. In the case of the third level, we can also note a low variance compared to the rates of male students.
The percentages obtained in the distribution when we divide the groups of students and groups of professors demonstrate that female professors are, in general, evaluated worse than male professors in both ranges of z-scores, while male professors are more likely to receive positive scores than female professors.
5. Discussion
Our research questions cover different dimensions of possible gender biases in the responses to the survey of student satisfaction with the teaching received. Regarding the first research question RQ1 (‘Does the gender of the professor impact the level of student satisfaction with their teaching?’), we observed that aggregating at a university level the results are similar to those of Suarman (2014), Arrona-Palacios et al. (Citation2020) where the differences in mean and standard deviation of student satisfaction scores between women and men professors are small. However, when we standardize scores and look at the extreme values, students rate their male professors with higher scores more frequently than female professors, and conversely, female professors are more likely to receive extremely negative scores. When we control by age, we find similar patterns, with women being more likely to receive lower scores compared to men, independently of age, with a more pronounced disadvantage when the woman is older than 60. Overall, the results show that when the professor is a woman, students are more than twice as likely to give low scores to female professors. In our WAE (‘we are all equal’) worldview, this means that the observed space (survey results) is a gender-biased view of the construct space (teaching quality).
Considering RQ2 (‘Does gender impact the level of student satisfaction with professors on either the basis of their own gender or the gender of the professor?’), we can see that male students are more likely to give lower scores to professors when those professors are women, as observed in Boring (Citation2017). The findings in RQ1 and RQ2 are consistent, with female professors being rated with lower scores and male professors being rated with higher scores more frequently. Also, male students are more biased with respect to female and male professors than female students.
Our investigation into the impact of academic centers (RQ3) revealed that some centers had similar student satisfaction scores for both male and female professors, while others exhibited gender-based differences. These findings aligned with our previous queries. Notably, certain centers displayed a higher likelihood of negative scores for female professors. Overall, differences in evaluations were more pronounced when male students rated their professors, whereas female students’ ratings were more consistent across all centers.
Finally, we evaluated the gender bias considering the course level in RQ4, distributed in three categories (first year, second year, and third years or following), where the results are consistent with related research (Aragón et al., Citation2023): women professors were evaluated better in average in the first academic year than men, and men professors better in the third academic year than women professor. This might be due to female professors’ making a larger effort to compensate for bias and obtain better results in student evaluations (Boring, Citation2017).
However, in the extremes of the evaluations, in the first and second academic years, female professors are more likely to receive a lower score than male professors, while in the third academic year, male professors are more likely to receive lower scores and less likely to receive positive evaluations. Also, we observed that in the first and second years, independent of the gender of the student, female professors were negatively impacted in student satisfaction.
From this, in the extremes of the evaluations, we can make several high-level observations about the results. The analysis suggests that student satisfaction is affected by the gender of the professors. This can be noted in the results that men professors frequently obtain higher scores, are less likely to receive an extremely negative evaluation, and are more likely to receive a positive evaluation than women.
Overall, the difference in scores is mostly due to male students giving lower scores to female professors with less agreement (higher variance and low median) compared to the rates given to male professors. The measurement applied in this work consistently demonstrates the same trend across different levels of analysis (i.e. per center, per academic year) as well considering a combination of these groups.
The hypothesis drawn from this study was confirmed, showing the different effects by gender of the professor (RQ1H1), based on the match of the gender of the professors and the students (RQ2H1), but in this case, prevailing the match of male students and male professors, as well in the academic centers (RQ3H1) and levels of courses (RQ4H1). As we assume the WAE worldview in this paper, we considered and evaluated the different dimensions using this perspective. We observed bias in the observed space that discriminate against female professors more frequently and consistently along the dimensions studied.
As stated in Radchenko (Citation2020), student satisfaction is a measure that differs in different dimensions and is multifaceted due to the variation in the use of mean score, demonstrating effects related to class size, course, gender of the professor, and type of the class. Our study found that the effects studied impacted student satisfaction on the mean and average. Specifically, when we applied techniques for standardizing the evaluations to consider each student evaluation in the context of other evaluations by the same student, we confirmed that female professors are negatively impacted in different dimensions more than male professors, with results that are clear in the extremes of the distributions.
6. Conclusion
Student satisfaction surveys have been found to be insightful for stakeholders in higher education, and valuable for decision-making. When students provide scores based on their experiences with the teaching received, they may incorporate implicit attributes and dimensions of unrelated aspects of the measure, for instance, contextual biases and unconscious bias. However, the results of student satisfaction are widely considered in program quality assessment and academic promotion processes. By recognizing the significance of these underlined aspects and that biases evolve with time and may be context-dependent, this study extends previous research using statistical group discrimination and algorithmic fairness by contributing additional evidence and center-specific results.
Our research findings contribute to the awareness of stakeholders about the extent of gender bias that may affect the assessment in the dimensions studied from the perspectives of the professors and students at the university and center levels. By standardizing student scores, we showed that they are affected by the gender of the professors, particularly in the extremes of the rating scale, benefiting male professors more frequently with higher scores while negatively evaluating female professors.
We also showed that a comparison of averages across the entire university shows minor differences in the scores based on the gender of the professors. Analysis that considers the gender of the student provides a different picture. When evaluating the impact of the gender of the student related to the gender of the professors, we found that male students are biased towards female and male professors more than female students.
Considering the center levels effects, we observe the same pattern as most previous work (disadvantages to women professors) across all centers, even the one with a much higher proportion of women as professors, except the Faculty of Law, which presents similar behavior in the ratings (also in the extremes) for both genders in the study. Finally, from the perspective of course levels, we found that female professors are negatively impacted more frequently than male professors in the first and second academic years in the satisfaction ratings received, while male professors are more likely to receive lower scores in the third year. We also found statistically significant differences per center.
Measuring student satisfaction requires a deep reflection of the factors that influence measurements and an awareness of potential gender bias. Our methodology promotes the use of being clear about assumptions, as well as the importance of considering different co-founders in the analyses of student satisfaction surveys. As we found in this study, there might be consistent findings across different dimensions and levels of analysis that need to be constantly monitored in Higher Education. In fact, these results show the importance of identifying biases in student satisfaction as an instrument to guide decisions in higher education by highlighting the need for further investigations, creating policies to minimize the impact of biases in the decision process (i.e. hiring personnel, promotions). This way, the higher education system can promote an environment with more equitable and fair approaches, as well as design tools for continuous improvement.
A concern about these biases is related to the expectancy theory of motivation (Vroom 1964), which says that an individual’s motivation to perform is based on beliefs. The theory mentions that there is a belief that a positive impact between efforts and performance results in desirable rewards and the sense that the effort is worthwhile. If woman professors keeps receiving lower evaluations, they will be less motivated to improve teaching, affecting career progress and their motivation to working in academia.
6.1. Limitations
Our analysis considered only one university and two academic years, which may prevent generalizing these conclusions/findings to other contexts or universities. By applying this measurement consistently through different academic years, we could have observed longitudinal aspects and the effectiveness of actions that may be designed based on the analysis. Another significant limitation is that the gender in our dataset is not self-declared by anyone, preventing considering non-binary gender and the self-identity of students and professors during the study. This paper assumes that student evaluations are an appropriate method for measuring quality in a higher education setting. Indeed, previous research shows this is the case (Berk, Citation2005; Kane & Staiger, Citation2012; Marsh, Citation2007). However, there is a broader debate connecting quantitative evaluation tools with neoliberal shifts and the’ marketization’ of universities that we do not address in the current paper.
Finally, we expect that the findings in this study promote further reflections, motivating stakeholders to invest in inclusion and equal opportunities policies in higher education where we can foster a more diverse and inclusive community and mitigate disadvantages that biased student evaluations may pose to the career of female academics.
Figure_C1_a..jpeg
Download JPEG Image (17.7 KB)
TABLE_B1..xlsx
Download MS Excel (8.9 KB)Figure_A1_a..jpeg
Download JPEG Image (18.3 KB)
Figure_C3..jpeg
Download JPEG Image (18.9 KB)
Figure_C2..jpeg
Download JPEG Image (12.5 KB)
TABLE_A1..xlsx
Download MS Excel (8.7 KB)Figure_C1_b..jpeg
Download JPEG Image (14.2 KB)
Figure_A1_b..jpeg
Download JPEG Image (15.7 KB)
Acknowledgments
The work was done in collaboration with UPF services (Strategy, Data and Quality Service, and the Data Protection Officer) through the UPF Learning Lab initiative.
Disclosure statement
No potential conflict of interest was reported by the author(s)
Additional information
Funding
Notes on contributors

Francielle Marques
Francielle Marques (she/her) is a Ph.D. student at the Information and Communication Technologies Department of Universitat Pompeu Fabra (UPF). Master in Computer Science at the Institute of Informatics – UFRGS, Brazil. She has a BSc in Computer Science at the University Federal of Mato Grosso, Brazil, and a Computer Technician from the Institute Federal of Goiás, Brazil. Her main interest is in artificial intelligence, machine learning, deep learning, algorithmic fairness, and AI in education, working mainly on applications to solve real problems and AI for social good.

Davinia Hernández-Leo
Davinia Hernández-Leo (she/her) is Full Professor, Serra Húnter, and Icrea Academia fellow at the Department of Information and Communications Technologies Department (DTIC) at UPF and the head of the Interactive and Distributed Technologies for Education group (TIDE). Her research is focused on the interdisciplinary field of learning and collaboration Technologies, with emphasis in learning design technology, computer-supported collaborative learning (CSCL), community platforms, artificial intelligence in education, and learning analytics.

Carlos Castillo
Carlos Castillo (they/them) is an ICREA Research Professor at Universitat Pompeu Fabra in Barcelona, where they lead the Web Science and Social Computing research group. Their current research focus is algorithmic fairness, and they have been influential in the areas of crisis informatics, web content quality and credibility, and adversarial web search.
Notes
1 COM: Communication, ECO: Economics and Business, ENG: Engineering, HEA: Health and Life Sciences, HUM: Humanities, LAW: Faculty of Law, LEC: Law and Economics, POL: Political and Social Sciences, TRA: Translation and Language Sciences.
References
- Al-Issa, A., & Sulieman, H. (2007). Student evaluations of teaching: perceptions and biasing factors. Quality Assurance in Education, 15(3), 302–317. https://doi.org/10.1108/09684880710773183
- Aleamoni, L. M. (1999). Student rating myths versus research facts from 1924 to 1998. Journal of Personnel Evaluation in Education, 13(2), 153–166. https://doi.org/10.1023/A:1008168421283
- Aragón, O. R., Pietri, E. S., & Powell, B. A. (2023). Gender bias in teaching evaluations: the causal role of department gender composition. Proceedings of the National Academy of Sciences of the United States of America, 120(4), e2118466120. https://doi.org/10.1073/pnas.2118466120
- Arrona-Palacios, A., Okoye, K., Camacho-Zuñiga, C., Hammout, N., Luttmann-Nakamura, E., Hosseini, S., & Escamilla, J. (2020). Does professors’ gender impact how students evaluate their teaching and the recommendations for the best professor? Heliyon, 6(10), e05313. https://doi.org/10.1016/j.heliyon.2020.e05313
- Bedggood, R. E., & Donovan, J. D. (2012). University performance evaluations: what are we really measuring? Studies in Higher Education, 37(7), 825–842. https://doi.org/10.1080/03075079.2010.549221
- Berbegal-Mirabent, J., Mas-Machuca, M., & Marimon, F. (2018). Is research mediating the relationship between teaching experience and student satisfaction? Studies in Higher Education, 43(6), 973–988. https://doi.org/10.1080/03075079.2016.1201808
- Berk, R. A. (2005). Survey of 12 strategies to measure teaching effectiveness. International Journal of Teaching and Learning in Higher Education, 17(1), 48–62.
- Boring, A. (2017). Gender biases in student evaluations of teaching. Journal of Public Economics, 145, 27–41. https://doi.org/10.1016/j.jpubeco.2016.11.006
- Flegl, M., & Andrade Rosas, L. A. (2019). Do professor’s age and gender matter or do students give higher value to professors’ experience? Quality Assurance in Education, 27(4), 511–532. https://doi.org/10.1108/QAE-12-2018-0127
- Friedler, S. A., Scheidegger, C., & Venkatasubramanian, S. (2016). On the (im) possibility of fairness. arXiv Preprint arXiv:1609.07236,
- Friedler, S. A., Scheidegger, C., & Venkatasubramanian, S. (2021). The (im) possibility of fairness: Different value systems require different mechanisms for fair decision making. Communications of the ACM, 64(4), 136–143. https://doi.org/10.1145/3433949
- Guolla, M. (1999). Assessing the teaching quality to student satisfaction relationship: Applied customer satisfaction research in the classroom. Journal of Marketing Theory and Practice, 7(3), 87–97. https://doi.org/10.1080/10696679.1999.11501843
- He, J., & Freeman, L. A. (2021). Can we trust teaching evaluations when response rates are not high? implications from a monte carlo simulation. Studies in Higher Education, 46(9), 1934–1948. https://doi.org/10.1080/03075079.2019.1711046
- Heffernan, T. (2022). Sexism, racism, prejudice, and bias: A literature review and synthesis of research surrounding student evaluations of courses and teaching. Assessment & Evaluation in Higher Education, 47(1), 144–154. https://doi.org/10.1080/02602938.2021.1888075
- Heffernan, T. (2023). Abusive comments in student evaluations of courses and teaching: The attacks women and marginalised academics endure. Higher Education, 85(1), 225–239. https://doi.org/10.1007/s10734-022-00831-x
- Heilman, M. E. (1983). Sex bias in work settings: The lack of fit model. Research in Organizational Behavior, 5, 269–298.
- Heilman, M. E., & Caleo, S. (2018). Combatting gender discrimination: A lack of fit framework. Group Processes & Intergroup Relations, 21(5), 725–744. https://doi.org/10.1177/1368430218761587
- Kane, T. J., & Staiger, D. O. (2012). Gathering feedback for teaching: Combining high quality observations with student surveys and achievement gains. research paper. met project. Bill & Melinda Gates Foundation, 1–64.
- Kanwar, A., & Sanjeeva, M. (2022). Student satisfaction survey: A key for quality improvement in the higher education institution. Journal of Innovation and Entrepreneurship, 11(1), 1–10. https://doi.org/10.1186/s13731-022-00196-6
- Lippert-Rasmussen, K. (2013). Born free and equal?: A philosophical inquiry into the nature of discrimination. Oxford University Press.
- Marsh, H. W. (2007). Students’ evaluations of university teaching: Dimensionality, reliability, validity, potential biases and usefulness. The Scholarship of Teaching and Learning in Higher Education: An Evidence-Based Perspective, 319–383.
- Mengel, F., Sauermann, J., & Zölitz, U. (2018). Gender bias in teaching evaluations. Journal of the European Economic Association, 17(2), 535–566. https://doi.org/10.1093/jeea/jvx057
- Radchenko, N. (2020). Biases in student evaluations of teaching: An American case study. IZA Discussion Paper.
- Rodriguez, J. K., & Guenther, E. A. (2022). Gendered organization theory. in ‘Oxford Research Encyclopedia of Business and Management’.
- Rosen, A. S. (2018). Correlations, trends and potential biases among publicly accessible webbased student evaluations of teaching: A large-scale study of ratemyprofessors. com data. Assessment & Evaluation in Higher Education, 43(1), 31–44. https://doi.org/10.1080/02602938.2016.1276155
- Scheaffer, R. L., Mendenhall, W., III, Ott, R. L., & Gerow, K. G. (2011). Elementary survey sampling., Cengage Learning.
- Suarman. (2014). Gender differences on students satisfaction: The role of teaching quality in higher education. Middle-East Journal of Scientific Research, 21(9), 1434–1441.
- Vroom, V. H. (1964). Work and motivation.
Appendices
Appendix A. Context
Our study is based on retrospectively analyzing the results of a student satisfaction survey, corresponding to the 2021–2022 and 2022–2023 academic year for undergraduate courses at a University in Spain.
Students are asked to complete one survey per course at the end of every term. Beyond the student’s anonymous responses, we have information about the course, term, level of the course, enrollment number, center, an anonymized identifier for the professor, and the gender of each anonymized professor and student. The University provided the anonymized IDs and the genders of professors and students, which are based on nationally issued identity documents used for contracts (professors) and enrollment (students); these documents do not include other genders beyond male and female.
Appendix A.1.
Professors by gender, center, and year
describes the distribution of men and women professors per centerFootnote1 in the entire data collection. Overall, most of the professors are men in the university and in all but one center (TRA: Translation and Language Sciences). In three additional centers, the proportions of men and women are fairly similar: Humanities (HUM), Health and Life Sciences (HEA), and Communication (COM). In the remaining five centers, there are substantially more men than women among the professors.
Figure A1. Distribution of professors by gender: (a) per center; (b) per level of the course.
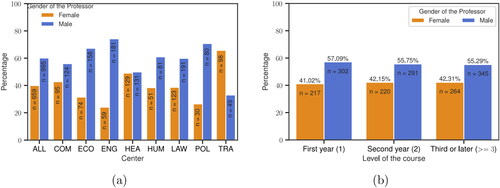
The distribution of professors by gender is shown in , where we normalized by the total number of professors per year. We aggregated the levels of the course into the first year (1), the second year (2), and the third year or later (> = 3). Arag’on et al. (2023) indicates that first-year courses are taught more often by women in some cases. Overall, in our data, we do not see this at the university level.
In , we present the number of evaluations per academic level. We discard the evaluations that have an undetermined or empty level for the remaining of our analysis.
Table A1. Number of evaluations per level.
Appendix B.
Dataset
The survey includes six questions regarding the subject and the instructor. Students are asked about teaching plans, methodologies, workload, subjects, and overall satisfaction of the professor. They answer on a numerical scale from zero to ten, with zero meaning complete dissatisfaction and ten meaning complete satisfaction. Our dataset covers two years (2021–2022 and 2022–2023) with 2,979 classes in 1,246 subjects – we note that some subjects have more than one class or group of students. These subjects are part of 25 undergraduate (bachelor) programs taught in 8 academic centers of the university and one joint center.
In our study, we analyze mainly the data related to the satisfaction with the teaching received (the final question of the survey:’ I am satisfied with the teaching received.’), considering various levels of analysis and considering the gender of the professors and students. This question has been in use in its current form for at least ten years.
Appendix B.1.
Filtering by reliability assessment
We used the reliability assessment (RAS index) filter (Scheaffer et al., Citation2011) to discard classes where the evaluation is unreliable because the number of respondents is too small in comparison to the number of enrolled students, to avoid their impact on accuracy (He & Freeman, Citation2021). To compute this, we considered the rate of participation throughout the dataset, grouping the data hierarchically by the center, course, class, trimester, group, and number of enrollments. We kept only classes with a ‘good’ or ‘sufficient’ number of responses according to the RAS index (RAS <= 0.5) The filtered dataset contains 25,465 responses, distributed as per . The evaluations are given by 6,657 students (3,982 women and 2,675 men, 60%/40%); most of the students at this university are women. The classes evaluated are taught by 450 professors (167 women and 283 men, 37%/63%); most of the professors at this university are men.
Table B1. Dataset filtered by RAS index.
Appendix C.
Gender based analysis of responses
Appendix C.1.
University-level analysis
shows the distribution of ratings across the university for them. We observe that higher scores (8, 9, 10 on a scale from 0 to 10) are more frequently given to professors who are men. Intermediate scores (5, 6, 7) are more frequently given to professors who are women. Lower scores (0, 1, 2, 3, 4) are relatively rare but are more frequently given to women.
Figure C1. Student satisfaction score distribution per gender depicted as: (a) a histogram, and (b) as a probability density function.
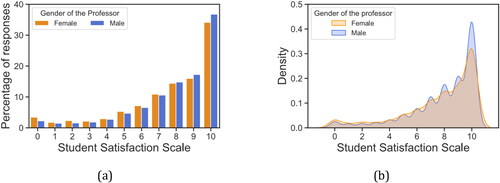
To measure the significance between the two distributions shown in , we perform a statistical test of the normality observing p-value < 0.01, indicating high significance. A continuous curve is drawn in to study the probability distribution, where we use a kernel density estimator for visualization. We can see that the curve peaks around 8–10 points and that scores of male professors are slightly more concentrated around these values.
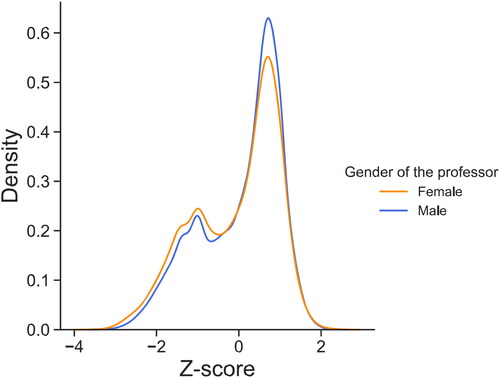
Standardizing the responses per student as described in Section 4.1, so that zero corresponds to the average given across evaluations by a student, we obtain . We can see that students favor slightly male professors, and sometimes give extremely low scores more often to female professors.
Figure C2. Probability density function of standardized student satisfaction scores (‘z-scores’).
Appendix C.2.
Per-center analysis
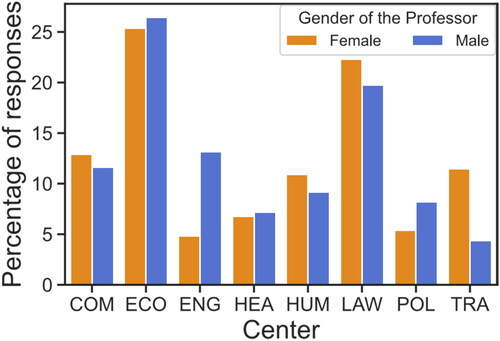
shows the percentages of evaluations across centers and the gender of the professors. At the University level, most evaluations are concentrated in the department of ECO and LAW, representing 30% and 25% of the evaluations (of the whole university) to female professors, respectively, and approximately 28% and 22% of the evaluations for male professors.
Figure C3. Percentage of student evaluations based on the gender of the professor and the center.