
 ?Mathematical formulae have been encoded as MathML and are displayed in this HTML version using MathJax in order to improve their display. Uncheck the box to turn MathJax off. This feature requires Javascript. Click on a formula to zoom.
Abstract
Signal detection in sports is fundamental to the organization and performance of both the individual athletes as well as the teams. Coaches and players often signal to each other to express plays or other relevant information. This research focuses on identifying the characteristics of successful signal implementation in a collegiate environment for American football and was conducted with inputs on play call design and signalling methods from an NCAA Division I football coaching staff. A comprehensive literature review approach was taken to extrapolate characteristics and factors that influence successful signal detection from a broad range of research. Key factors and characteristics were identified (i.e., physical and display characteristics, the environment, cueing, and signalling methods) through the review. Recommendations were made on factor implementation to enhance play call signal detection. Recommendations from the analysis to the football coaching staff include reduction of background noise, high contrast signals and signalling coach attire, cueing student-athletes to signal locations, and information for optimizing overall visual conspicuity of signals. Additional information is provided on encryption techniques and novel signalling methods. Results of this research will be used to ensure play call signals in the football environment are conspicuous and easily interpretable to the intended student-athletes.
PUBLIC INTEREST STATEMENT
This study specifically addresses play calling in American football but the concepts of signal detection apply to any communication where distance separates the people providing the information and the people who need the information to complete a task in a timely manner. The primary contribution of this study is the review of a cognitive engineering principle, signal detection, and its application to a critical component of sport performance; however, the literature reviewed for this study applies to all areas where signal detection is a necessary component of the job being performed. The up-tempo model of football play calling defined within this study is an often-duplicated process across, not only football organizations, but multiple sports and industrial organizations whose success is dependent upon understand human perception of signals. This study examines: (a) improvements for salience and visual conspicuity of signals and (b) encryption techniques and novel signalling methods.
1. Introduction
The purpose of this paper is to review the current literature on signalling and signal detection in American football in order to determine visual and aural factors that make signalling more effective. Searching for signals in sports is fundamental to the organization and effective performance of individuals and teams. Using signals provides a variety of information to players including positioning, expected plays, expected tendencies, and other related requirements from signal callers. Sports-related signals can come in the form of gestures, pictures, and audio (Shoemaker, Citation2008).
1.1. Fundamental signal detection
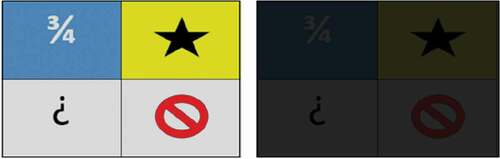
Signal-detection theory is concerned with decision-making in uncertain or ambiguous situations (Wickens, Citation2002). There are many tasks from simple (identify the most prominent letter on an eye chart) to complex (diagnosis of rare diseases) that incorporate characteristics of signal-detection theory. The detection and interpretation of a presented signal, or lack of signal, drives the decision-making process for an observer (Wickens, Citation2002). Observers make decisions based on the detection of signals among various states of audible and visual noise (i.e. background stimulus) (Wickens, Citation2002). In the case of football signalling, an offensive coach may present a large poster with figures in quadrants to convey information (e.g., snap count, line formation, or personnel positioning) about the play to the offensive players (Figure ). In this case, the players must identify the appropriate figure amongst other figures and background stimulus from distractors such as other side-line signals, crowd patterns behind the signal, and environmental or fatigue effects. All players must detect and understand the presented signals to facilitate a cohesive action.
Figure 1. Example play cards.

Fundamental elements make up two stages of the signal detection process. In the first stage, “features” are used to differentiate targets. These features can be made up of dimensions such as colour, orientation, motion, and spatial frequency (Verghese, Citation2001). If the first search stage of visual search does not isolate the target, then attention can be drawn by cueing the observer, or improving signal discriminability (Verghese, Citation2001). A variety of research has been conducted on signal conspicuity and detectability that can improve the likelihood of signal detection in a high audible and visual noise environment.
1.2. Signalling in collegiate American football
A trend has emerged in National Collegiate Athletic Association (NCAA) American football where information is signalled visually to student-athletes on the field through large poster boards with quadrants of pictures expressing information. This enables student-athletes to look to their side-line to extract encoded information, ensure dissemination of the information amongst teammates, and execute the requirements (Jones, Citation2016). The poster trend has seen successful implementation in fast-paced offenses, reducing the requirements for verbal commands or the need for traditional, play-sharing huddles. Additionally, hand gestures are used to augment information and provide separate instructions. This play calling environment is complex and requires pre-coordination with coaches and student-athletes to determine encoded signal meanings and recognition of significant gestures.
In NCAA Division I football stadiums, the environment plays a role in signal detection. Many stadiums accommodate 75,000+ fans creating a highly audible and visually noisy atmosphere. Student-athletes must recognize visual signals amongst changing backgrounds, and audible signals in an environment that can easily reach over 100 dB (Lenzi, Citation2015). In some cases, student-athletes must visually recognize signals from 50+ yards. This environment causes significant challenges related to signal expression and detection for coaches and student-athletes. To combat the potential for signal misinterpretation or visual degradation, mitigation strategies must ensure a clean signal transfer. Utilizing fundamentals of signal detection theory and optimized visual search strategies helps maintain a positive signal transfer in high-noise or long-distance visual environments. At the request of an NCAA Division I football program, a comprehensive literature review was conducted to answer research questions related to optimizing play call signal detection for football student-athletes. Additional research was conducted to identify additional play calling strategies using novel systems and addressing the potential for improved encryption for current systems. Information related to current and common signalling methodologies, field conditions, encryption requirements, and signal purpose was provided by the collegiate football coaching staff prior to the literature search conduction for this study. The football coaching staff inputs assisted in developing the scope of this research.
1.3. Research questions
In order to identify the fundamental requirements for successful signal detection, a comprehensive literature review method was used to summarize and evaluate research related to the following six research questions (RQs): (a) RQ1: What factors influence successful signal detection at a fundamental level? (b) RQ2: What signals are easily recognizable? (c) RQ3: What factors contribute to successful signal detection in a high noise environment? (d) RQ4: What factors influence signal detection at a distance and in peripheral vision? (e) RQ5: Are new methods required for signal transfer? (f) RQ6: What encryption strategies are feasible? RQ1 needs to be addressed initially in order to aid in the establishment of the more detailed findings covered in the responses to RQ2 through RQ6. Additionally, both RQ1 and RQ2 aim to analyse signal detection at a broader level. RQ3 and RQ4 address specific contextual factors related to college football (i.e. the high audible and visual noise environment and viewing positions from the field). Addressing RQ5 and RQ6 provides novel advice relative to signal detection and American football and will be addressed in the discussion section because the answers come in the form of novel advice formed from the results sections, made up of RQ1 through RQ4. Research results were used to assist in optimizing play calling for the requesting program’s coaching staff.
2. Methods
2.1. Procedure
2.1.1. Inclusion and exclusion criteria
To be included, studies had to meet the following criteria: (a) present empirical research or a review of design characteristics that affect signal detection; (b) present best practices or recommendations of researched signal presentation; (c) provide signal design information applicable to an outdoor football-related environment. Four members of the research team reviewed articles related to each individual research question. Inclusion was considered broadly to identify any novel methods or unique presentations that could be applied to the playing field or a competitive environment. The collegiate football coaching staff aided the research team in understanding appropriate inclusion and exclusion criteria consideration based on context specific to the sport of football. The staff inputs assisted in developing the keyword list for database searches.
2.1.2. Literature search
A literature search was conducted using a Preferred Reporting Items for Systematic Reviews and Meta-Analyses (PRISMA) checklist. Searches were conducted and included critical keywords that were identified to specifically address RQ1 through RQ4 (such as visual signal detection theory, signage, conspicuity, contract sensitivity, visual and verbal coding, visual salience, colors, symbols, graphics, etc.). All research articles reviewed were used to address RQ5 and RQ6 given the more extensive nature of these questions. An extensive list of all search terms is restated and further categorized into their respective RQs in Table . Search engines included: Academic Search Premier, University Discovery Service, and On-Line Catalog, EBSCOhost, and Google Scholar.
Table 1. Keyword search terms used to address RQ1 through RQ4
2.2. Data preparation
2.2.1. Data extraction
Using the previously stated search terms and databases, the research team identified studies matching the scope of this research. Data extraction was conducted by identifying factors and/or characteristics in each research study that contributed to successful signal detection. If the research was deemed to be within the scope of RQ1 through RQ6, the research article was added to a comprehensive list of articles along with a summary of the relative information contained within the article. All researchers reviewed every article and either confirmed, added to, or altered the relevant information that was to be extracted from each article. Research biases were not considered to influence this analysis due to the intentional inclusion of a wide variety of methods and signal detection experiments.
2.2.2. Data grouping
Following the data extraction from the articles meeting the inclusion criteria, the research team disseminated the pertinent information into results and core themes for each of the RQs. These themes provided natural groupings and descriptive categories representative of context. For example, all articles that had relevant data involving signal detection in high audible or visual noise environments were grouped and labelled as “signal detection in high noise environments,” and all articles that had relevant data involving physical features of signals were grouped and labelled as “physical characteristics contributing to successful signal detection.” Labels were provided for each category and the entire group was designated as conspicuity categories and factors that affect successful signal detection.
2.3. Statistical analysis
2.3.1. Comprehensive literature review procedure
Microsoft Excel was used to group factors based on the identified conspicuity categories, followed by a frequency analysis of factor occurrence in the literature to determine the most common and frequently researched successful signal detection influencers. Seeing that there could be a variety of different methods of successfully influencing signalling, the research team identified the most commonly used methods to provide further insight based on the initial request of the college football staff. Research sample sizes and methodology were not considered due to the lack of standardization in experimental research methods in the identified literature. Advanced statistical analysis was not applicable as the intent was to identify any factors that contribute to successful signal detection in a variety of experimental scenarios.
3. Results
3.1. Literature sample
3.1.1. Sample
The literature review began with 441,043,489 results, many of which were considered non-applicable due to being presented based on partial key word hits. After conducting an initial abstract and title screening related to each research question, 569 articles were excluded based on irrelevant information. Fifty-one (51) articles were reviewed for more in-depth information. After a full manuscript review, forty-three (43) articles were used in the review to answer the research questions and identify factors that affect the conspicuity of signals. The article review process was documented using the PRISMA flow diagram method (Figure ).
Figure 2. Combined PRISMA flowchart.
3.1.2. Research summary
Table displays a summary of the articles that were examined to determine signal factors that influence conspicuity. These articles will be discussed in further detail in the corresponding results subheadings. Articles not included in the table were used as additional research information for factor implementation.
Table 2. Summary of studies examining conspicuity factors
Size, color, brightness, shape, luminance, and spatial orientation (information arrangement) were all talked about in some capacity in a majority of the articles pertaining to signal detection. They are all physical characteristics that are separable dimensions that are part of the first step of object, or signal, recognition (Porathe & Strand, Citation2011). Most of these basic characteristics have larger interaction effects that have also shown up in research, including contrast, composition, grouping, likeness, and organization. Contrast refers to striking differences such as in color or luminance (Moshner, Almojuela, Sherwood, Rawe, & Wessels, Citation2012). Black letters on a white background or vice versa is a good example of contrast, or salience which is discussed further in RQ3. Grouping and likeness are factors that refer to physical characteristics as well as previous knowledge and symbol meaning (Hsu & Chang Lin, Citation2011).
The basic physical characteristics and the larger interaction effects are also affected by context within the signal environment. Masking, environmental clutter, viewing distance, viewing angle, reinforcement, cueing, and motion are all factors that refer to the context surrounding how, where, and when the signal was provided. Masking, and environmental clutter are both signal environment factors that can both aid and be detrimental to successful signal detection. The visual background’s affect on the signal is dependant upon the contrast of the sign to its surroundings (Eckstein, Ahumada, & Watson, Citation1997). This is another instance of salience and will be discussed further in RQ3. While making a signal harder to read for one’s own team is disadvantageous, masking the signal from the opposing team is needed when specifically referring to collegiate football. Strategies that will allow successful signal detection by the correct team and signal masking from the opposing team will be discussed further in RQ6. Cueing and reinforcements are both factors that involve time outside of the immediate signal detection. Humans greatly improve signal detection ability if they are trained in what position and signal they are looking for ahead of time (Burgess & Ghandeharian, Citation1984; Smith, Citation2000; Verghese, Citation2001). Cueing and reinforcement involve training, practice, and chronically consistent signals. For example, yield traffic signs are consistently the same shape, color, and height. They also have the same meaning in every instance they are used. This reduces the time that it takes humans to detect and comprehend the signal. Motion, viewing distance, and viewing angle are all factors involving the human and the signal’s relational positioning and are discussed further in RQ1.
3.2. Statistical analysis
3.2.1. Analysis of factors
A frequency analysis was conducted to identify the most commonly occurring characteristics examined during experimental research and other reports. Physical characteristics (information arrangement, orientation, size, shape, and location) and display characteristics (brightness, color, and contract) accounted for 56% of the researched factors followed by environmental (audible and visual noise, background, viewing distance, and occlusion; 21%), cueing (known location, a priori, experience, and attention draw; 13%), and methods (motion, flashing, signal overlap, and reinforced, signal; 11%). These conspicuity factor categories can be found in Table . While percentage of contribution does not necessarily indicate importance, it does provide evidence that researchers have conducted significant work on understanding physical and display characteristics that influence signal detection. While all categories are considered important, their effectiveness may be dependent upon application. Appropriate physical and display characteristics are considered the foundational requirements for effective signal transfer and detection. Identified factors were grouped according to five overall categories, based on similar attributes. While Table displays all the identified factors, Table displays how these factors were grouped.
Table 3. Conspicuity Factors
3.3. Research question results
3.3.1. RQ1: What factors influence successful signal detection at a fundamental level?
The purpose of RQ1 was to understand what constitutes successful signal detection. Fundamental-level signal detection was shown to be influenced by a variety of factors as displayed (Table ). The literature reviews found that physical (Boersema & Zwaga, Citation2000; Duane, Citation1916; Ho, Scialfa, Caird, & Graw, Citation2006; Kimball, Citation2013; Porathe & Strand, Citation2011; Toet, Kooi, Bijl, & Valeton, Citation1998) and display characteristics (Boersema & Zwaga, Citation2000; Duane, Citation1916; Eccles & Hummer, Citation2000; Ho et al., Citation2006; Kimball, Citation2013; Olson, Citation1988; Schieber, Willan, & Schlorholtz, Citation2012; Toet et al., Citation1998; Wertheim, Citation2010), environment (Boersema & Zwaga, Citation2000; Ho et al., Citation2006; Toet et al., Citation1998; Verghese, Citation2001; Wertheim, Citation2010), cueing (Burgess & Ghandeharian, Citation1984; Smith, Citation2000; Verghese, Citation2001), and signalling methods (Boersema & Zwaga, Citation2000; Davis & Schmit, Citation1973; Duane, Citation1916; Verghese, Citation2001) all influenced basic signal detection.
Table 4. Commonly misread letters and numbers
Identifying the most effective combination of these factors is the subject of further research. Using a conspicuity index measurement to determine signal detection is one practical method that could be implemented to ensure players on the field can detect the signal. The conspicuity index is determined by measuring the angle between the gaze point and the target object and using the angle where the object no longer can be detected (Kimball, Citation2013; Toet et al., Citation1998). As such, determining the conspicuity index can be easily performed on a football field.
A signal (e.g., sign board, hand signals) should be produced at the location expected for detection. A player or representative, wearing a football helmet, should stand on the field in a location where the signal is visible at the maximum expected distance (e.g., 50 yards). The player should focus on the signal and then turn their head and gaze points left and then right and mark the points where the signal is no longer able to be interpreted. The larger the angle, the more effective the signal. Various signals can be used to identify the most effective signalling methods. For example, a signalling coach should stand on the side-line at the 35-yard line and hold up a signal poster. A player could stand on the 50-yard line near the opposite side-line and look directly at the signal. The player should then move their head and gaze to the right until the signal is no longer interpretable, and then to the left until the signal is no longer interpretable. The point where the signal is not recognized should be noted on the right and left sides. A new signal should be produced by the signalling coach and the same procedure performed. The signal with the widest angle of visual interpretation has a higher conspicuity index and would be more easily recognizable under the proposed conditions.
3.3.2. RQ2: What symbols are most recognizable?
Certain symbols are more recognizable than others. A symbol or a picture may be a familiar object in daily life, yet it possesses specific connotations in addition to its conventional and obvious meanings. A symbol is “symbolic” when it implies something more than its obvious and immediate meaning. Symbols have been a part of human communication since ancient times. Ancient cultures and religions have used recognizable symbols including crosses, circles, and natural elements such as the sun for centuries (Jung, Franz, Henderson, Jaffé, & Jacobi, n.d.). Symbols represent or call to mind a larger entity and all communication makes use of symbols (Dillistone, Citation1986). A study of young children and object recognition showed that all written letters are recognized initially by their shape (Augustine, Jones, Smith, & Longfield, Citation2015). A symbol, in and of itself, is recognizable; however, the success of a symbol hinges on how recognizable it is to its intended recipient.
According to several research efforts, pictures have proven to be more recognizable than text (Apperly, Williams, & Williams, Citation2004). Pictures allow for individuals with low literary, dyslexia, and vision problems to comprehend messages faster and more accurately than letters or numbers (Nwobodo, Citation2018). To improve upon symbol recognition a picture plus a direction, or additional supporting text, resulted in the most accurate and quickest identification along with large fonts and color adding clarity to a symbol (Hsu & Chang Lin, Citation2011; Nicol & Tuomi, Citation2013). Some pictures are more recognizable than others. Colors and faces were proven to be more recognizable than other body parts or objects (Lafer-Sousa & Conway, Citation2013). Also, perceived beauty was a factor in recognition and the human brain focused on curved objects more so than angular objects and classified them as more visually appealing (Navarrete et al., Citation2013). Symmetrical images were also preferred and symmetrical figures were identified faster than asymmetrical figures (Deregowski, Citation1980).
Several factors influenced symbol recognition negatively. Symbols that lacked an awareness of a “neighbour in shape” cause confusion and at times misreading of the symbol. A “neighbour in shape” is a shape that is a close match to another shape and could cause misidentification. For example, from a distance an octagon and a circle look very similar and could be misidentified. Avoiding shapes and symbols that have close neighbours add clarity and decreases the chance of misreading the symbol (Edelman, Citation1999). Objects and pictures can be drawn to give the appearance of depth or three-dimensions. A simple example of this is a drawing of a cube on a piece of paper. The drawing itself is two-dimensional, but the image appears to be three-dimensional because the human brain comprehends that it has depth. When selecting symbols, the addition of depth has been shown to only add complexity to the image and was not recommended for use in symbol selection (Deregowski, Citation1980). Several letters and numbers can also cause confusion when not displayed correctly (such as an uppercase “I” versus a lowercase “l” or an uppercase “B” versus the number “8”), or are displayed without supporting context to help with their recognition. Table lists the most common letters that can cause clarity issues.
Additional research has concluded that certain fonts have the highest clarity for letter shape and design. Font types (a) Avance, (b) Info Display, (c) Lola, (d) Rockwell, (e) Unit, and (f) Zine Slab (demonstrated in Table ) have the highest clarity for letter shape and design and are appropriate choices for use in symbols to increase symbol and text clarity (Bohm, Citation2015).
Table 5. Recommended fonts
3.3.3. RQ3: What factors contribute to successful signal detection in a high-noise environment?
Regarding successful signal detection in high-noise environments, types of environmental noise must first be defined. There are two types of noise that were identified as relevant to the football environment, auditory and visual. Auditory noise can be credited to the stadiums of spectators that create large amounts of audible noise as an attempt to distract the players. Visual noise includes other people walking around the side-lines or close to the signallers as well as any false movements or gesticulation on the part of the signallers.
Auditory noise, assuming the noise is “white noise,” was shown to have no effect in one study and was shown to adhere to the bow effect in two other studies (Manjarrez, Mendez, Martinez, Flores, & Mirasso, Citation2007; Taylor, Melloy, Dharwada, Gramopadhye, & Toler, Citation2004). The bow effect explains a phenomenon that states that performance is enhanced by added cognitive load until a certain cognitive load limit is reached, at which point the performance begins to decrease (Wickens, Hollands, Banbury, & Parasuraman, Citation2016). In application, this information would suggest that as long as the player’s cognitive load is not full, the stadium’s audible noise effect will be null. Techniques for lowering cognitive load in signal detection can be found throughout this research.
Therefore, the key to successful signal detection in a collegiate football type environment is eliminating visual noise. Increased salience in signal detection can vastly increase performance (Helton & Warm, Citation2008; Yin & Davis, Citation2013). Keeping a constant, uniform background increases salience, and is proven to improve signal detection (Eckstein et al., Citation1997). In football signalling, there is a live background that can include players and coaches coming in and out of the visual field. Using a moveable backdrop of a constant, uniform colour could help improve signal detection performance. Other methods used to add salience that are currently being used by college football teams include: having the play callers wear brightly coloured hats, or having the signallers wear shirts that are a different color than everyone else on the side-lines. Lights, as a method of added salience, were shown to only be effective at night (Moshner et al., Citation2012). Added salience improves signal detection, and any method that will provide a contrast between the provided signal and anything that is not a signal in the field of view should be considered.
3.3.4. RQ4: What factors influence signal detection at a distance and in peripheral vision?
Signal detection at a distance and signal detection within peripheral view are just as, if not more important, than standard line-of-sight detection. In football, players receive signals from coaches on the side-line which can be up to 53.33 yards away if the player is on the far side of the field. In addition to the distance, players are limited by their peripheral vision. These factors introduce new problems that must be accounted for in order to ensure signals are transmitted and received accurately. There have been several studies on these effects on signal detection theory which may offer new solutions for signal calling in football.
One problem associated with signal detection at a distance is that audible and visual signals can overlap and bleed into each other, which becomes distorted in such a way that the receiver’s brain interprets them both as one new melded signal. One study focused on the phenomena which is known as the McGurk Effect over a distance and found that it is more pronounced when the signal is located 20 meters (or 21.87 yards) or greater away (Jordan & Sergeant, Citation2000). One study shows that signal reception and interpretation can be improved by changing the sound of a signal to avoid ambiguity. For example, the audible and visual signal of another person making the sounds “dah” and “tah” are easily mixed by receivers, but languages that use words with less cross-over potential show lower occurrences of this type of distortion (Sekiyama & Tohkura, Citation1991). When naming football plays or callouts, it would be beneficial to avoid words or syllables that can be easily mixed up or perhaps use a second language for distinct signals.
Another problem is the location of the signal in relation to the player’s field of view. It is beneficial for the receiver to know the location beforehand instead of searching for the cue (Pack, Carney, & Klein, Citation2013). In football, it might help to always offset using a predetermined angle to reduce head movement while searching for a signal cue. Balancing the trade-off between distance and line of sight angle is critical. For situations where a head turn might be unavoidable, knowing the rough angle and diagonal distance to the signal caller used might be helpful for data collection while different signals, methods, and personnel positions are being tested and timed. For example, if the signal callers position themselves 7 yards up field from the line of scrimmage then they will be roughly 75.29 degrees to the right or left of the quarterback or other players who are looking straight ahead at the goal posts and standing near the centre of the field (assuming centre point from side-line is 53.33 yd/2 = 26.67 yd). This can be calculated using trigonometry where x is the player’s horizontal distance from the side-line and y is the signal caller’s yardage upfield from the line of scrimmage:
The distance between the quarterback and signal caller can be found using Pythagorean’s theorem:
For those signal receivers who must rely on their peripheral vision, the literature suggests there are still some techniques that may be used to improve signal detection performance. One study compared signal forms where shape and colors were altered to send a new signal. This was compared against a sign that was shaken around instead. Of the two options, movement was found to be a better peripheral cue (Vater, Kredel, & Hossner, Citation2017). Another study found that humans are capable of learning to read letters from their peripheral vision with practice (Chung, Levi, & Tjan, Citation2005). While football players will likely turn their head instead of reading from their peripheral, this study indicates that with practice a peripheral signal’s reception can be improved to perform a complex task.
Another problem associated with signal calling at a distance and, in the periphery, is associated with the signal’s interpretation. After the signal is received, the receiver still needs to decrypt and understand how to respond. One way to improve the signal receiver’s interpretation ability is to practice. Once a habit is formed, then recognition of a signal will automatically cue the decision-making process in a known as Recognition Primed Decision making (RPD). RPD is an important concept for understanding how humans gain proficiency in these types of complex tasks. One of the primary features of RPD is that over time, humans can learn to recognize patterns between similar events and can develop a certain intuition about situations. One paper on this subject studied football players in order to find improvements in learning play calls (Huang, Churches, & Reilly, Citation2015). This study found that novice players mostly learned their play calls from a third person perspective using top view drawings of positions and routes. An assessment was performed before the study on their understanding of the plays and found a 30% improvement on scores after simulating the plays in a virtual reality headset over 3 days. By learning the plays and play calls from a first-person perspective, signal reception might be improved. Recognizing these up-close signals from the opposing defence or offense could reinforce signals received from the side-lines. One other advantage that the authors noted was that the student-athletes could practice reading signals from a first-person perspective without increasing the year’s NCAA practice count.
4. Discussion
4.1. RQ5: Are new methods required for signal transfer?
Based upon the interviews with the coaching staff, the basic methods of signalling within the context of American football at the NCAA Division 1 level appear to follow guidelines found in the literature. Although the success of signal detection depends upon the signal itself and if it can be recognized and understood. Therefore, an analysis of all the conspicuity factors should be conducted to identify the characteristics of successful signals in the chosen environment. Strong consideration should be given to environmental conditions and interference effects. Identifying the conspicuity index using appropriate distances and angles of direction is important to ensure signal perception in the intended environment. When selecting a symbol, an easily recognizable picture along with text, arrows or supporting symbols should be used together when possible for optimal recognition. The use of bright and/or contrasting colours, along with curved shapes should also be considered. When using text, be aware of easily confused letters and numbers, also use fonts that give a higher design clarity to reduce confusion. Following these guidelines when selecting signals in the future will ensure the continued success of signalling in college football.
4.2. RQ6: What encryption strategies are feasible?
Encryption of the signals should follow best practices (e.g., changing signals regularly, decoys, non-intuitive signals). Further analysis is being conducted on the use of a 3M™ microlouver Advanced Light Control Film (ALCF) to limit the effective viewing angle of the play call boards to 60° on-axis viewing with 95% occlusion in off-axis viewing. Applying the microlouver film to the signal boards could limit the ability for opposing teams to clearly see signal boards from the opposing box seats or side-lines. Utilizing restricted viewing angles, along with best practices for masking signals, can help to reduce the likelihood of decryption by opposing teams. Most microlouver films are designed to be used over a computer or television screen that has a back light to shine through the film so that at the appropriate viewing angle the screen can be seen. Using this tactic on a poster board may result in visibility issues because of the lack of light passing through the film from behind. The use of a television screen with the microlouver film to display signals on the side-line may be a better solution. Figure provides a conceptual image of the microlouver application and its effects.
Figure 3. On-angle to Off-angle microlouver view.
5. Conclusions
When considering the football environment, several key factors have been identified that deserve strong consideration when developing play call signals. Signals should be presented with minimal visual noise. When using a signal board, consider using a larger sheet behind the board to block out side-line and crowd distractions. Signallers should strive to maintain a clear line of sight to the intended student-athlete recipients. Cueing should always be provided to the student-athletes. Student-athletes should always know the general or expected location of the signal. High contrast signals and play callers should be used (e.g., fluorescent colors). Signallers should wear bright colors and stand out from the other side-line personnel. Signal boards should use high contrast and legible symbols or text with easily interpretable pictures, shapes, or fonts. Effort should be made to reduce signal similarities. Signals should be tested using the conspicuity index, prior to use. Pre-testing will ensure that signals are appropriate for use during live situations.
Hand signalling should be concise and easily identifiable with gross movements. If specific fingers must be recognized, consider high contrast gloves or finger tape to offset the hand signals from the background. Avoid signal similarities and maintain line of sight.
Encryption methods should be explored further. Additional research is required to identify the effectiveness of microlouver films in the football environment. The use of additional technologies (e.g., electronic screens, light boards) should be considered for feasibility of implementation, depending on required signal mobility and current rules.
By considering the identified factors, design principles, and best practices described in this report, play call signals can be effectively displayed to student-athletes on the field. Signal developers should adapt these findings to their environmental situations and unique signalling requirements.
Practice Points
This study specifically addresses play calling in American football but the concepts of signal detection apply to any sport where distance separates the coaches who are sending play calls and the athletes receiving them.
The primary contribution of this study is the review of a cognitive engineering principle, signal detection, and its application to a critical component of sport performance.
The up-tempo model is an often-duplicated process across football organizations whose success is dependent upon understand human perception of signals. This study examines:
Improvements for salience and visual conspicuity of signals.
Encryption techniques and novel signalling methods.
Practice Points: The communication format of American college football has undergone a significant change in the past decade. Before, play calling was communicated from coaches on the side-line to individual players who would then run onto the field and share the information with the rest of players within the team huddle. Now, the play is communicated to all players at once via hand signals, gestures, signage, and other visual means such that the huddle is no longer required for communication. This new, up-tempo model of football is an often-duplicated process across collegiate organizations whose success is dependent upon understand human perception of signals. This study examines a cognitive engineering principle, signal detection, and its application to a critical component of sport performance. The purpose of this study is to specifically address football, but the concepts apply to any sport where distance separates the play caller and the athletes receiving the signals.
Additional information
Notes on contributors
Reuben Burch
The researchers for this article consisted of graduate students taking part in a research study for the Mississippi State University (MSU) Football program as part of the Cognitive Engineering course in Industrial and Systems Engineering (ISE). These researchers consisted of students both on- and off-campus who collaborated with the coaching staff in order to understand more about the dynamics of signal calling as it occurs in an NCAA Division 1 program. The results from this article were used by the coaching staff during the following football season. MSU ISE is home to the university’s Athlete Engineering Program where athletics and academics collaborate through both funded and volunteer research projects in order to enable our student-athletes and our engineers aspiring to work in an athletic field.
Related Research Data
References
- Apperly, I. A., Williams, E., & Williams, J. (2004). Three- to four-year-olds’ recognition that symbols have a stable meaning: Pictures are understood before written words. Child Development, 75(5), 1510–15. doi:10.1111/j.1467-8624.2004.00754.x
- Augustine, E., Jones, S. S., Smith, L. B., & Longfield, E. (2015). Relations among early object recognition skills: Objects and letters. Journal of Cognition and Development, 16(2), 221–235. doi:10.1080/15248372.2013.815620.Relations
- Boersema, T., & Zwaga, H. J. G. (2000). Visual conspicuity in complex scenes. Human vision and electronic imaging (pp. 548–558). doi:10.1117/12.387189
- Bohm, T. (2015). Letter and symbol misrecognition in highly legible typefaces for general, children, dyslexic, visually impaired and ageing readers. Information Design Journal, 21(1), 34–50. doi:10.1075/idj.21.1.05boh
- Burgess, A. E., & Ghandeharian, H. (1984). Visual signal detection II Signal-location identification. Journal of the Optical Society of America A, 1(8), 906. doi:10.1364/josaa.1.000906
- Chung, S. T. L., Levi, D. M., & Tjan, B. S. (2005). Learning letter identification in peripheral vision. Vision Research, 45(11), 1399–1412. doi:10.1016/j.visres.2004.11.021
- Davis, R., & Schmit, V. (1973). Visual and verbal coding in the interhemispheric transfer of information. Acta Psychologica, 37(4), 229–240. doi:10.1016/0001-6918(73)90016-4
- Deregowski, J. B. (1980). Illusions patterns and pictures (1sted.) E. Carterette & M. Friedman, Eds. London, UK: Academic Press.
- Dillistone, F. W. (1986). The power of symbols in religion and culture (1st ed.). New York City: The Crossroad Publishing Company.
- Duane, A. (1916). Sight and signalling in the navy. Proceedings of the American Philosophical Society, 55(5), 400–414.
- Eccles, K. A., & Hummer, J. E. (2000). Safety effects of fluorescent yellow warning signs at hazardous sites in daylight. TRB Paper (pp. 1–2236).
- Eccles, K. A., & Hummer, J. E. (2001). Safety effects of fluorescent yellow warning signs at hazardous sites. Paper presented at the 80th Annual Meeting of the Transportation Research Board, Washington, DC.
- Eckstein, M. P., Ahumada, A. J., & Watson, A. B. (1997). Visual signal detection in structured backgrounds. II. Effects of contrast gain control, background variations, and white noise. Journal of the Optical Society of America. A, Optics, Image Science, and Vision, 14(9), 2406–2419. doi:10.1364/JOSAA.14.002406
- Edelman, S. (1999). Representation and recognition in vision (1st ed.). Cambridge, MA: The MIT Press.
- Helton, W. S., & Warm, J. S. (2008). Signal salience and the mindlessness theory of vigilance. Acta Psychologica, 129(1), 18–25. doi:10.1016/J.ACTPSY.2008.04.002
- Ho, G., Scialfa, C. T., Caird, J. K., & Graw, T. (2006). Visual search for traffic signs: The effects of clutter, luminance, and aging. Human Factors, 43(2), 194–207. doi:10.1518/001872001775900922
- Hsu, T. F., & Chang Lin, P. (2011). Graphical symbols: The effects of proximate context and educational background on recognition performance. Information Design Journal, 19(1), 18–27. doi:10.1075/idj.19.1.03hsu
- Huang, Y., Churches, L., & Reilly, B. (2015). A case study on virtual reality American football training. In 2015 Virtual Reality International Conference (p. 6). ACM. doi:10.1145/2806173.2806178
- Jones, K. (2016). Examining the many communication methods of a no-huddle offense. Retrieved from https://www.elevenwarriors.com/ohio-state-football/film-study/2016/03/69003/film-study-examining-the-many-communication-methods-of-a-no-huddle-offense
- Jordan, T. R., & Sergeant, P. C. (2000). Effects of facial image size on visual and audio-visual speech recognition. Language and Speech, 43(1), 107–124. doi:10.1177/00238309000430010401
- Kimball, M. A. (2013). Visual design principles: An empirical study of design lore. Journal of Technical Writing and Communication, 43(1), 3–41. doi:10.2190/tw.43.1.b
- Kress, B. (2019). AR/VR/MR: Meeting the optical design challenges. Retrieved from https://outline.com/zLxLWh.
- Lafer-Sousa, R., & Conway, B. R. (2013). Parallel, multi-stage processing of colors, faces and shapes in macaque inferior temporal cortex. Nature Neuroscience, 16(12), 1870–1878. doi:10.1038/nn.3555
- Lenzi, R. (2015). Michigan football: Noise a factor at Penn State. Retrieved from http://search.ebscohost.com/login.aspx?direct=true&db=s3h&AN=111087959&login.asp?custid=magn1307&site=eds-live&scope=site
- Manjarrez, E., Mendez, I., Martinez, L., Flores, A., & Mirasso, C. R. (2007). Effects of auditory noise on the psychophysical detection of visual signals: Cross-modal stochastic resonance. Neuroscience Letters, 415(3), 231–236. doi:10.1016/J.NEULET.2007.01.030
- Moshner, M., Almojuela, D., Sherwood, C., Rawe, R., & Wessels, R. (2012). Reconstruction of Runway 16L-34R at Seattle–Tacoma International Airport. In Airfield safety and capacity improvements (pp. 24–36). Reston, VA: American Society of Civil Engineers. doi:10.1061/9780784412565.ch02
- Navarrete, G., Vartanian, O., Nadal, M., Chatterjee, A., Skov, M., Fich, L. B., … Leder, H. (2013). Impact of contour on aesthetic judgments and approach-avoidance decisions in architecture. Proceedings of the National Academy of Sciences, 110(Supplement 2), 10446–10453. doi:10.1073/pnas.1301227110
- Nicol, A., & Tuomi, S. (2013). Hazard sign comprehension among illiterate adults. Stellenbosch Papers in Linguistics, 37(1), 67–88. doi:10.5774/37-0-18
- Nwobodo, C. E. (2018). Symbol recognition and interpretation of HIV/AIDS pictorial messages among rural women in Abia State Nigeria. Journal of Agricultural Extension, 21(1), 67–78. doi:10.4314/jae.v22i1.7
- Olson, P. L. (1988). Minimum requirements for adequate nighttime conspicuity of highway signs. Ann Arbor, MI. Retrieved from http://deepblue.lib.umich.edu/bitstream/handle/2027.42/764/76610.0001.001.pdf?sequence=2
- Pack, W., Carney, T., & Klein, S. A. (2013). Involuntary attention enhances identification accuracy for unmasked low contrast letters using non-predictive peripheral cues. Vision Research, 89, 79–89. doi:10.1016/j.visres.2013.06.010
- Porathe, T., & Strand, L. (2011). Which sign is more visible? Measuring the visibility of traffic signs through the conspicuity index method. European Transport Research Review, 3(1), 35–45. doi:10.1007/s12544-011-0050-9
- Schieber, F., Willan, N., & Schlorholtz, B. (2006). Fluorescent colored stimuli automatically attract visual attention: An eye movement study. In Proceedings of the Human Factors and Ergonomics Society Annual Meeting (Vol. 50, No. 16, pp. 163–1637). Los Angeles, CA: SAGE Publications. doi:10.1177/154193120605001625
- Schieber, F., Willan, N., & Schlorholtz, B. (2012). Fluorescent colored stimuli automatically attract visual attention: An eye movement study. Proceedings of the Human Factors and Ergonomics Society Annual Meeting, 50(16), 1634–1637. doi:10.1177/154193120605001625
- Sekiyama, K., & Tohkura, Y. I. (1991). McGurk effect in non-English listeners: Few visual effects for Japanese subjects hearing Japanese syllables of high auditory intelligibility. The Journal of the Acoustical Society of America, 90(4), 1797–1805. doi:10.1121/1.401660
- Shoemaker, I. (2008). No huddle offensive procedures and communication. Baldwin Wallace College - Yellow Jacket Coaching Clinic. Retrieved from https://www.docslides.com/cheryl-pisano/no-huddle-offensive-procedures-amp-communications
- Smith, P. L. (2000). Attention and luminance detection: Effects of cues, masks, and pedestals. Journal of Experimental Psychology: Human Perception and Performance, 26(4), 1401–1420. doi:10.1037/0096-1523.26.4.1401
- Taylor, W., Melloy, B., Dharwada, P., Gramopadhye, A., & Toler, J. (2004). The effects of static multiple sources of noise on the visual search component of human inspection. International Journal of Industrial Ergonomics, 34(3), 195–207. doi:10.1016/J.ERGON.2004.04.002
- Toet, A., Kooi, F. L., Bijl, P., & Valeton, J. M. (1998). Visual conspicuity determines human target acquisition performance. Optical Engineering, 37(7), 1969–1975. doi:10.1117/1.601903
- Vater, C., Kredel, R., & Hossner, E. J. (2017). Detecting target changes in multiple object tracking with peripheral vision: More pronounced eccentricity effects for changes in form than in motion. Journal of Experimental Psychology: Human Perception and Performance, 43(5), 903–913. doi:10.1037/xhp0000376
- Verghese, P. (2001). Visual search and attention: A signal detection theory approach. Neuron, 31(4), 523–535. doi:10.1016/S0896-6273(01)00392-0
- Wertheim, A. H. (2010). Visual conspicuity: A new simple standard, its reliability, validity and applicability. Ergonomics, 53(3), 421–442. doi:10.1080/00140130903483705
- Wickens, C. D., Hollands, J. G., Banbury, S., & Parasuraman, R. (2016). Engineering psychology and human performance. Milton Park, Abingdon: Routledge.
- Wickens, T. D. (2002). Elementary Signal Detection Theory. New York, NY: Oxford University Press.
- Yin, Y., & Davis, R. (2013). Gesture spotting and recognition using salience detection and concatenated hidden markov models. In Proceedings of the 15th ACM on International conference on multimodal interaction - ICMI ’13 (pp. 489–494). New York, New York, USA: ACM Press. doi:10.1145/2522848.2532588