Abstract
A well-designed strategy for effective solid waste management is a compelling necessity of the modern world. Today, solid waste management is gaining so much of an importance because lack of planning could affect the quality of social, economic and environmental sustainability. Most of the studies have illustrated production of solid waste is due to human needs and desires and the best strategy of solid waste management is to tackle at the point of origin. However, to measure such pro-environmental behaviours among residents, an appropriate and a replicable scale is important. Hence, the purpose of this paper is to explain the processes undertaken to develop a valid instrument to measure the antecedents of solid waste management behaviour. The constructs were assessed using Ajzen’s theory of planned behaviour and data was collected from a survey of 233 students belonging to three different colleges of Udupi district, India. The specific validation processes used were: mixed methods approach of content validity, face validity, construct validity, reliability, internal consistency, Cronbach’s alpha correlation coefficient, discriminant validity and convergent validity. Measurement invariance for urban and rural groups was established and the measured model adopted confirmatory factor analysis and structural equation modelling technique for assessing the psychometric properties of constructs. A final and fifth version of questionnaire was designed with 57 items from the initial indicators of 132 items. The findings of this research indicate that psychometrics used in this study are reliable and valid, and can be extended to other research contexts for its higher purpose in environmental protection.
PUBLIC INTEREST STATEMENT
Research has illustrated that a sustainable solid waste management system is best strategized when wastes are tackled at the point of origin. To explore such pro-environmental behaviours, a valid and replicable scale is pre-requisite. Therefore this research utilized Ajzen’s theory of planned behaviour and mixed methods procedure of content validity for scale development. The reliability and validity findings revealed that mixed methods procedure of content validity is an effective method that draws strengths of both quantitative and qualitative methods. The results obtained from relevant tests showed that the developed scale is reliable, replicable and trustworthy. The specified scale is useful to environmental practitioners, academicians and students since the systematic methods of scale development adopted in this research can be employed at different waste contexts such as E-waste, food waste and plastic waste. Thus this study can be of higher use in environmental protection.
1. Introduction
Since the era of globalisation came into existence, world is facing constant environmental ramifications due to urbanisation and over-consumerism patterns. Of many environmental problems, irrational disposal of Solid Waste (SW) is considered to be the major problem, since it could affect the stability of environmental and social life of a society (Baud et al., Citation2001; Jekria & Daud, Citation2016; Zurbrügg et al., Citation2012). From the early phase (Hopper & Nielsen, Citation1991) till recent time (Ma et al., Citation2018), numerous studies have been conducted in the domain of SW. There is a valid reason for these studies in acknowledging the complex nature of waste disposal patterns which are produced in an ever increasing order. This environmental problem profoundly relates to Indian scenario where heaps of wastes are seen in almost every public place, causing serious damage to natural resources, public health and safety of citizens. It is expected that the country would generate 300 million tonnes of SW by the year 2047 from the current generation of 48 million tonnes per year (Pappu et al., Citation2007). It is also anticipated that the land required to dispose wastes would be 169.6 km2 as against 20.2 km2, i.e. eight times more than was needed during 1999 (Central Pollution Control Board, India, Citation2019). Owing to these alarming statistics, statutory bodies in the nation have launched waste management programs such as clean India mission and plastic-free campaigns. However, a common understanding among public is; pro-environmental programs are comprised of top approaches where municipal corporations have the sole and higher responsibility in transporting garbage, cleaning streets, clearing plastics and recyclables from public spots. Although, very few individuals indulge in Solid Waste Management (SWM) methods, some often fail to choose those behaviours which lessen their impact on environment. This wide disparity in attitudes, beliefs and actions among citizens opens up a scope for scrutiny within the domain of environmental psychology to explore the antecedents of behavioural aspects and causal relationships between psychological variables. Obviously, landfills are the hazardous ways of waste disposal method due to its potency to produce methane gas and damage our ecosystem (Themelis & Ulloa, Citation2007). Also, continuation of landfills as a waste treatment option is not only a pressing threat to the nation but it possesses environmental risk at global level. In that view, investigation of waste behaviours among residents is an essential strategic step in environmental planning and management science. This root-cause analysis approach to understand the dynamics of variables that overplays or underplays SWM Behaviours (SWMB) amongst citizens is need of the hour, since it paves a path for national development in terms of environmental, social and economic sustainability.
In order to capture the psychological characteristics of individuals in applied psychology and behavioural science, self-administered questionnaires come as handy, practical and a preferable tool (Cook & Wolf, Citation1999; Curkovic, Citation2003; Parsian & Dunning, Citation2009). The importance of scale development and validation of self-administered questionnaires have been reported in medical, business management, engineering and public health domains (Dagger et al., Citation2007; Kendall & Bloomfield, Citation2005; Scandura & Williams, Citation2000). However, such validated studies are found to be extremely scarce in environmental psychology research. Also, to our knowledge that not many researchers have devoted attention and time to address the importance of scale development and validation process of self-administered questionnaires; particularly in examining the antecedents and inter-relationships of SWMB, both in international and national context. Such studies are important in environmental psychology since they significantly influence and contribute to the quality content of research work in at least six ways as follows.
First, most of the behavioural science problems deals with the utilization of theories to develop conceptual frameworks. This is because an established theory enables a researcher to avoid implicit assumptions and provides a basis for explicit causal pathway explanations of a research problem (Davis et al., Citation2015; Michie & Abraham, Citation2004; Michie et al., Citation2015). In that process of meeting research objectives, a logical structure and reasoning arguments are obtained for those studies in which questionnaires undergo validation process in a scientific manner by eliminating confusions about research constructs, and measures those items that need to be measured. Thus, those questionnaires which undergo validation process have a better ability to capture information as compared to those which do not follow the validation process (Breen, Citation2019; Morgesan & Humphrey Citation2006; McKenzie, Citation2011). Second, such validation methods of questionnaires are not only useful in mitigating environmental problems that the world is facing today, but it also enhances the quality of environmental solutions that researchers provide to save environment by creating a forum to exchange innovative thoughts about different techniques that are related to specific subject aiding in improvement of research work (Bruce & Fries, Citation2003; Evers et al., Citation2016). Third, when questionnaires are scrutinized through the formal methods of expert opinions of academia and senior consultants of reputed bodies, items undergo purification process in which scales are either eliminated or rectified. The validation of developed items in the form of rating, suggestions and guidance of experts due to their expertise in respective fields enhances the item development, thus directly influencing the research output (Cade et al., Citation2002; Sasaki et al., Citation1998; Spector, Citation1992). Fourth, environmental psychology relies upon both experiences and systematic theorizing of concepts to eliminate errors, and hence when questionnaires are subjected to evidence-based techniques, irrelevant information and similar concepts are omitted, resulting in quality survey questionnaire (Chatterji, Citation2002; Pluye et al., Citation2014). Fifth, it aids a researcher by indicating whether the defined constructs framed for a particular study are functional or deficient; thus saving time and avoiding a stage of drawing invalid conclusions that later have to be rejected due to false and misleading data (Churchill Jr & Peter, Citation1984). Sixth, as science progresses, novel research questions and ideas demand new scale development and such studies help future researchers, teachers and students to acquire technical knowledge in scale development and empirical validation process; allowing them to conduct more studies in methodical and scientific ways by setting organised set of activities. Considering these grounds, we present this study to explain the procedures undertaken in developing and validating SWMB Questionnaire (SWMBQ) for its higher use in environmental protection. This paper is not a review paper, but it is purely a research article that deals with the process of designing and validating an instrument for the purpose of primary data collection of our ongoing study. Also, since this research mainly emphasises on instrument development and validation procedures of SWMBQ, an elaborate literature review of the factors that form SWMB and related hypothesis development is not presented in detail. However, a brief explanation of the conceptual development is presented in the following sections.
2. Operationalization of TPB
The exercise of systematic literature review to understand the status of existing literature revealed that the Theory of Planned Behaviour (TPB) by Ajzen (Citation1991) has been extensively used as an effective theoretical framework to explore the behavioural aspects of waste management, as compared to other contemporary theories (Raghu & Rodrigues, Citation2020). TPB, an extension of theory of reasoned action (Ajzen, Citation1985) is postulated on the assumption that most human behaviour is based on the result of individual’s belief, attitude, Subjective Norms (SN), Perceived Behavioural Control (PBC) and intention to undertake a particular behaviour and the ability of an individual to take conscious decision about it (Ham et al., Citation2015). SN relates to an individual’s perception of social pressure from others who are close to them such as family, friends, and colleagues, who can influence them to behave in an eco-friendly manner or not (e.g., “most people who are important to me think I should recycle wastes”) and PBC refers to the perceived facility or difficulty in performing the behaviour and perceived power of these factors to take up a task (e.g., “waste separation is easy for me”). While SN influence a person’s intention to perform a behavior, behavioral belief forms the attitude of an individual (Ajzen, Citation1991). According to Ajzen (Citation1991), it is hypothesised that intention is the key and immediate antecedent of behaviour and PBC is the second determinant that produces mediating effects on behaviour. The combination of attitude, SN and PBC leads to the formation of intention-behaviour phase. As a general understanding, the more favourable attitude and SN with high level of PBC, the stronger is the relationship between intention-behaviour. Belief is considered to be the value orientations that an individual possesses towards the consequences of an issue (Ajzen, Citation1991, Stern, Citation2000). Although, TPB has been widely applied, tested and accepted across the different parts of the world, interesting fact is that no two studies have been reported to be similar. Furthermore, it is acknowledged that scientists share similar views on environmental degradation, but have reported varied results by incorporating different research frameworks, tools and techniques to explore the parameters of SWMB. Considering the effectivity, popularity and suitability of the current research scenario, this research utilizes TPB to design and validate an instrument to investigate the belief-behaviour link of SWMB.
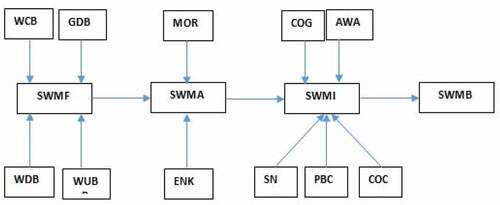
The concept of SWMB is involved with a set of actions taken by individuals, communities and societies who themselves are considered as actors in minimizing wastes (reduce), use of goods that can still be used (reuse), utilize wastes to usable form (recycle) and waste disposal in a logical manner (Hänsch et al., (Citation1995); Pongrácz & Pohjola (Citation2004); Pohjola and Pongrácz, Citation2002). Literature highlights that waste is produced due to human needs and desires (Stern, Citation2000) and several extrinsic and intrinsic factors play a pivotal role in exhibiting aSWMB. Since socio-psychological models allow addition of more variables to the primary model while evaluating a complex problem such as SWM, previous studies have added several factors to this intention-based framework. Some of the added variables are knowledge, self-identity, compassion towards environment, availability of recycling bins, kerbside recycling options, environmental instruments and municipal encouragement (Daneshvary et al., Citation1998; Izagirre, Citation2015; Mahmud & Osman, Citation2010; Pakpour et al., Citation2014; Zhang et al., Citation2015). Although some studies have agreed to a set of proposed hypotheses, some have disagreed in the context of evaluating the TPB. Hence, in the view of progressive research a conceptual model based on TPB with 15 constructs was developed to explore the waste belief—waste behaviour link, and to comprehend how and why wastes are produced. Since waste hierarchy beliefs are the key factors to be scrutinized in our ongoing research, we framed: Solid Waste Management Belief (SWMF) with Waste Reduction Belief (WDB), Waste Reuse Belief (WUB), Waste Recycling Belief (WCB) and General Disposal Belief (GDB); Solid Waste Management Attitude (SWMA) with Environmental Knowledge (ENK) and Moral Obligation (MOR); Solid Waste Management Intention (SWMI) with Subjective Norms (SN), Perceived Behavioural Control (PBC), Community Concern (COC), Community group (COG) and Awareness (AWA) and SWMB as shown in . Research constructs, operational definitions and research hypotheses pertaining to SWMBQ were clearly defined and research methodology for the primary empirical research was also formulated. These procedures were crucial since our research is about exploring the antecedents of SWMB through scientific techniques of sequential explanatory design of mixed methods approach.
Figure 1. Conceptual model for the development and validation of SWMBQ using TPB
3. Research aim and research question
The aim of this research is to develop an instrument that can be used to study the antecedents of SWMB for the purpose of demonstrating the empirical inter-relationships of waste behavioural patterns among youths using TPB. The research question is: can a scale be developed, tested and validated that determines the SWMB amongst youths.
4. Methods
Following procedures were conducted to develop and validate the SWMB instrument.
4.1. Phase 1: scale development
4.1.1. Stage 1: item collection
Step 1: While developing the SWMBQ, deductive method of scale development was adopted to collect a pool of items for each construct. This method is chosen because an existing scale with theoretical underpinnings has abilities to exhibit empirical results. Since this method will be based on the accumulation of the existing items’ knowledge (Idaszak & Drasgow, Citation1987), items were chosen from Scopus indexed and ISI web of Science journals to meet the quality content of this research. Items were collected from waste behaviour studies that best suited our model, and which included from behavioral studies such as food separation, waste management, waste minimization, textile, composting and garden, garden engagement, waste sustainability, community-based activities, reduce, reuse and recycling and green practices.
Step 2: In the second stage, extracted studies were scrutinized for quality assessment. While there are no standard methods available for choosing a particular article for item selection, researchers opine that items chosen should be context-based with appropriate research design, and items should be able to measure the research constructs that is intended to be measured (Nunnally & Bernstein, Citation1994). Hence, to gather the best possible indicators (from Scopus indexed and ISI web of science articles), we selected items from those studies which had clear description of research objectives, research aim, research methods and research findings relevant to the current study. Some articles had specified the methods of item reduction such as pilot study (for primary data collection) and this was helpful in item selection that best suited our SWMB constructs.
Step 3: While conducting the previous step, we came across few studies from the top-quartile journals with high citation numbers. However, questionnaires were unavailable either in journal articles or in other databases. Hence, formal emails were sent to those authors seeking for questionnaires that were previously used in their studies. Of seven emails that we sent, questionnaires were received from three experts, which added to the pool of items that had been collected before.
Step 4: Once questionnaires were received from experts, each item was reviewed back and forth several times to select the best reflected item that suited the research construct definition. In the process of compilation, we initially collected 132 items, of which few constructs had more than 12 items and few had less than 6 items. Minute detailing of each item was taken into consideration to avoid similar concepts, overlapping structures, wrong phrases and negatively worded sentences. This stage is considered to be vital since it has potential to avoid factor structure problems that may occur in later stages (Kortte et al., Citation2007). From a total of 132 items, 16 items were eliminated based on overlapping and similar concept, which led to an elaborated compilation of 116 items.
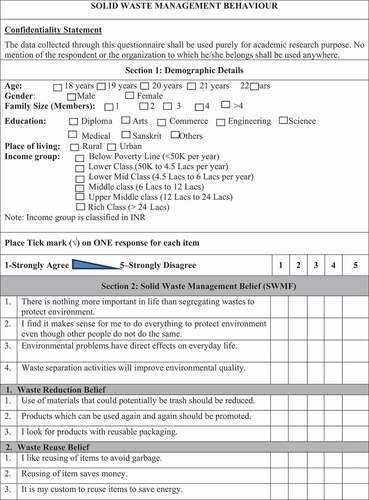
Step 5: After item compilation, a preliminary questionnaire was prepared in Microsoft Word document apart from a brief SWM introduction sheet. A total of 116 items including 6 demographic items were incorporated into this preliminary questionnaire. To examine all the independent and dependent variables that affect SWMB, the developed preliminary questionnaire was divided into five main sections, i.e., demographic details, SWMF, SWMA, SWMI and SWMB. Each construct was designed to have a minimum of five to maximum of eleven questions and all items used 5-point Likert scale from positive to negative, i.e., 1 = strongly disagree to 5 = strongly agree. A Microsoft Word page was created and this formed the first version of our SWMBQ.
4.1.2. Stage 2: content validity of SWMBQ
Content validity, referred as theoretical analysis (Boateng et al., Citation2018) and logical validity (Newman et al., Citation2013), is the fundamental step of scale validity. It is conducted to assess the domain of interest by using the measures of relevance, and to which the items in survey instrument reflect the construct and content for a purpose (Boateng et al., Citation2018; Haynes et al., Citation1995; Penny et al., Citation2009). It therefore ensures to measure the consistency of the theoretical realm of constructs and captures the elements of those constructs by eliminating irrelevant and non-cohesive items. Although several methods have been developed to measure content validity, a general opinion amongst researchers’ fraternity is that the more type of validity tests of an instrument, the greater is the trustworthiness of the instrument (Anderson & Gerbing, Citation1991; Haynes et al., Citation1995; Nunnally & Bernstein, Citation1994). In this context, in the progress of assessing the alignment of SWMB items, we adopted mixed method content validity approach suggested by Newman et al. (Citation2013). The chief advantage of using this method is that it utilises the strengths of both quantitative and qualitative techniques of content validity. A pragmatic and dynamic in nature, this method aims for item purification through robustness of triangulation process. It enhances the research outcome by its versatility in gathering materials for the purpose of assessing the intended item alignment and item refinement (Neumann et al., Citation2007; Tashakkori & Teddlie, Citation2009). Further, to our knowledge, this method has not been used in previous environmental psychology and environmental management studies. Hence, we undertook following two stages to accomplish mixed method content validity procedure.
Step 1: Quantitative Procedure
In this stage, an attachment about a brief introduction of the project, purpose of the study, aim of the research, concepts of items, and rating options were developed in the view of availing experts’ quantitative feedbacks. Further, as suggested by Newman et al. (Citation2013), operational definitions of study variables and a table of specification detailing the concepts, items and content areas were added to the first version of SWMBQ. A feedback column was incorporated and experts were asked to rate the alignment of each item in four ways of relevance, representativeness, clarity and specificity. (1) For relevance, experts were asked whether the item was appropriate to measure the outcome of the concept SWMB (e.g., experts were asked whether “I intend to separate wastes at home on a regular basis” was appropriate to capture SWMI activities). To rate this, response options 1 = not at all relevant (low), 2 = somewhat relevant (medium), and 3 = clearly relevant (high) were provided. (2) For representativeness, experts were asked whether the items were representing all of the parameters to be measured within that construct and thus affecting the corresponding levels of research outcomes (e.g., experts were asked if proposed items were representing all dimensions of the level of SWMA). For this, three rating options were given such as 1 = not at all representative (low), 2 = somewhat representative (medium) and 3 = clearly representative (high) were included. (3) For clarity, experts were asked whether the items were clear with no ambiguity and no double-barrelled items so that the respondent finds it easy in answering. For this, three rating options were provided 1 = not at all clear (low), 2 = somewhat clear (medium), 3 = very clear were (high) were used. (4) For specificity, experts were asked whether the items were specific to measure the levels of each item. For this again three rating options of 1 = not at all specific (low), 2 = somewhat specific (medium), and 3 = very specific (high) were included in SWMBQ. This became our second version of SWMBQ. The evaluation form along with the attachments (mentioned above) were sent to 18 experts from academia and industries who possessed relevant experience in SWM field. Responses were received from five experts, three peers working in international universities and two consultants working in national industries. The scores received from these experts were added and the average agreement of experts’ judgement was converted into average agreement percentage. Following this, items which had rating below 90% were assessed individually and were deleted. Some items were recommended for modifications and those were included as per experts’ comments. On the whole, out of 116 items, 55 items were retained, 35 items were modified and 26 items were deleted making a total of 90 items (), which formed the third version of SWMBQ.
Table 1. Summary of quantitative content validity results
Step 2: Qualitative Procedure
In order to collect the qualitative feedbacks, third version of SWMBQ was sent to 10 experts, and reply was received from 5 peers, all working as academicians at international universities. Once experts’ suggestions were received, for the sake of eliminating confusion we divided all responses into qualitative general opinions () and qualitative specific comments (). After considering the feedbacks, no items were deleted, but changes were incorporated by rephrasing few sentences. Hence, the fourth version of SWMBQ was developed with 90 items, of which 6 items had demographic details and 84 items were used for hypothetical research model.
Table 2. Collective qualitative general comments by experts
Table 3. Collective qualitative specific comments by experts
Step 3: Face validity
Face validity is conducted to understand the appropriateness and content relevance of developed items as they appear in terms of feasibility, easiness and readability for respondents (Holden, Citation2010; Wheeler et al., Citation1999). It evaluates the appearance of a questionnaire superficially in terms of design and usability rather reliability. Although some researchers express that face validity is the easiest but weakest form of validation process and its functionality is questionable (Nevo, Citation1985), this type of validity is considered to be an important step in behavioural science studies since an assessment of acceptability of a scale is crucial for its utility to serve higher purpose. It also eliminates the biased estimates and systematic errors of an instrument (Fowler Jr, Citation1992). Hence, we undertook this procedure as an extension of previous steps to gather the actual experience of easiness/difficulty of respondents in answering the fourth version of SWMBQ. For this purpose, an evaluation form was developed to assess the (1) clarity of sentences (2) layout and formatting style (3) degree of understanding (4) content of the questionnaire and (4) acceptance of text. A feedback column was also added to this evaluation form so that the respondents can provide their comments. A complete kit of questionnaire, an information sheet about SWM and face validity evaluation form was handed over to 38 students belonging to Nursing, Arts and Science streams. These respondents were randomly chosen during our visits to their respective colleges. The options for scaling used Likert scale of 1–4, with 1 = strongly agree, 2 = agree, 3 = disagree and 4 = strongly disagree. Responses were collected after one week and it was found that none of the respondents faced any problems in understanding the content. Thus, a total of 90 questions were carried out for the next phase, i.e., data collection.
4.2. Phase 2: data collection
This research used convenience sampling method to collect samples from students of age group 18–22 years. The sampling unit chosen was Udupi district, Karnataka state, India. Since students are future faces of any country and their responses to SWM issues at their formative stage of professional studies would reflect the attitudes and behaviours that they had inculcated throughout their childhood, we approached six different professional colleges belonging to different streams. We utilised both means of survey administration, i.e., pen/pencil questionnaire form and web-based questionnaire form. The former method was used to collect data from three rural colleges where a complete kit of self-administered SWMBQ and a brief description sheet of SWM was handed over in person. The latter method was used to collect data from three urban colleges where students were asked to fill up the web-based data collection page. The web page was developed in such a way that the respondents had an option of getting back to the page that was left of and complete the survey, if they were unable to fill the questionnaire at one time. Three week time was given to both type of survey respondents and collection of both methods of survey administration yielded us a total response of 515, of which 233 responses were of usable form.
4.3. Phase 3: data analysis
4.3.1. Stage 1: descriptive analysis
The first analysis that was undertaken after data pooling procedure was the examination of sample characteristics. This stage is often regarded as primary and fundamental step in data analysis since the survey examination can explain and summarize the characteristics of respondents in a meaningful way. Since the raw data cannot convey the features of the study data, descriptive analysis is an effective method of describing the data and analyses whether the collected data is representative of the larger target population (Holden, Citation2010). Moreover, sampling frame should be comprised of composite profile with fair distribution of sample characteristics to avoid possible bias. Hence, demographic details of respondents were analysed using mean type of statistical measures. Mean is the most widely applied method for describing a central tendency to represent the central gravity of distribution. Since mean can compare different groups and aid in computing further statistics, we used SPSS IBM version 19 to calculate the arithmetic average of each component of respondents' demographic details.
4.3.2. Stage 2: confirmatory factor analysis
For assessing the psychometric properties of SWMBQ, this research adopted Confirmatory Factor Analysis (CFA). The reason for choosing CFA as compared to Exploratory Factor Analysis (EFA) is that this study is theory driven and intends to assess and validate the measurement properties of a construct in terms of its consistencies with our understanding of the nature of constructs. Since the study uses previous empirical research to determine the relationships between observed variables and their latent constructs, CFA is better suited as against EFA where underlying factor structure needs identification without preconceived structure of a construct and its results (Gerbing & Hamilton, Citation1996; Harrington, Citation2009; Suhr, Citation2006). Another attractiveness of CFA is that it avoids difficulty factors and poor item distributions during development of scales either by item reduction or item modification (Bollen & Ting, Citation1993; Byrne, Citation1988; Hurley et al., Citation1997; Schreiber et al., Citation2006). In addition, CFA approach is suitable to current study which focuses on estimating the relationships between latent constructs by retaining only functional and internally consistent items on the basis of systematic assessment procedures.
4.3.3. Stage 3: structural equation modelling—PLS 3.0
Finally, for inferential statistics analysis, Structural Equation Modelling (SEM) Smart-PLS version 3.0 that utilizes CFA to measure the components was employed. The logical reasons for choosing SEM-Smart PLS as compared to other software programs are: (i) its ability to analyse multivariate data by explaining both direct and indirect effects of interrelated variables through elaborated statistical analysis (Hoyle, Citation2000) (ii) it can specify, estimate, assess and present models in an intuitive path diagram to indicate hypothesized interrelationships among variables (Chou et al., Citation1996) (iii) Its statistical efficiency and usefulness of model fit output during hypothesis testing, which otherwise is not possible in factor analysis/principal component approach (Curkovic, Citation2003; Mosconi et al., Citation2008) (iv) It can derive the best indicator of latent constructs through the process of factor loadings, unique variances and modification indices, and validates an instrument in measurement model which is a fundamental analysis to structural model (v) its statistical power in terms of structural and measurement model with the sample size of 200 (Hair Jr et al., Citation2014; Ifinedo, Citation2018).
4.3.3.1. Step 1: measurement invariance of composite models
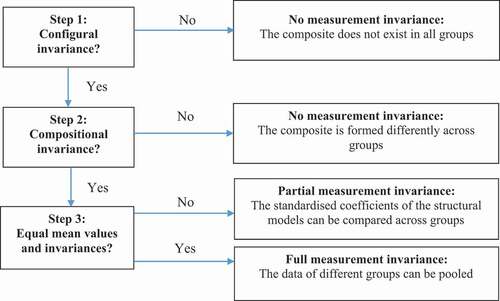
Before pooling the samples from traditional and web-based surveys, it is important to explore the structural variance of multivariate data. This is because, a lack of Measurement Invariance (MI) may lead to improper validity results and conclusions since the meanings of constructs that respondents perceive may vary across groups. Ensuring the measured latent construct that has the same purpose of measuring intended content across different groups, and establishment of MI is one of the prerequisites of data pooling. Therefore, this became our first stage of data analysis. We conducted MI using multi-group CFA. Multigroup CFA is an expansion of typical CFA that evaluates single model fitting to a data set by dividing the data set into groups (Chen et al., Citation2005: Cheung, Citation2008: Vandenberg & Lance, Citation2000). Its advantages to determine the model fit for each group separately, and then comparing multi-groups between each group has allowed researchers to examine whether respondents from different groups interpret the same measure in a conceptually similar way. Since SEM-PLS version 3.0 has robust output features as compared to regular common factor technique, we adopted Measurement Invariance of Composite Models (MICOM) procedure to establish invariance of composite models and pool the data. MICOM is a new feature and is gaining popularity in management discipline for its powerful efficiency of analyzing multi groups’ data pertaining to various countries, societies and culture. It tests if the predefined groups have statistically significant differences in group-specific estimations such as outer loadings, outer weights and path coefficients through permutation method. The three steps of MICOM are: (1) configural invariance (2) compositional invariance, and (3) the equal means of values and variances. Since it is a precondition to establish each step, it becomes necessary to assess the quality of composite mean values as recommended by Henseler et al. (Citation2016). The three-step hierarchical levels that are interrelated are shown in .
Figure 2. Steps of MICOM procedure (Henseler et al., Citation2016; Sinkovicset al., Citation2016)
4.3.3.2. Step 2: assessment of measurement model
From an operational perspective of SWMB model, construct validity, convergent validity, discriminant validity, criterion validity and reliability were considered to be important for assessing the measurement properties of all constructs. Accordingly, once data were pooled, a measurement model was formulated and each variable was subjected to validity and reliability measures through iterative process. The primary purpose of this step was to attain unidimensionality of multiple item constructs by eliminating inappropriate and unreliable items.
5. Results
5.1. Stage 1: measurement invariance of composite models
In Step 1, three aspects of configurational invariance assessment, i.e., setting up of measurement models, data treatment for model estimation using full data set and algorithm settings for all model estimations were achieved. Since SEM-PLS version 3.0 has built-in algorithm settings, we conclude this step is established.
In Step 2, permutation test was conducted to assess the compositional invariance which requires that correlation c should be equal to 1 (J. Hair et al., Citation2017). In addition, p value of permutations should not be significant which means that p value should be >0.5. Since MICOM allows to conduct the computations of Step 2 and Step 3 simultaneously with more number of permutations, we opted for 5000 permutations. shows PBC of 0.998 which is very close to 1 has the lowest c value as compared to all composites of SWMB model. Therefore, we conclude that compositional invariance has been established for all the elements of SWMB composites model.
Table 4. MICOM results of compositional invariance
In step 3, we assessed the composites equality across groups by mean values and variances that were set up for the measurement of SWMB model. The results of 5000 permutations shown in and revealed that the mean value and the variance of composites of Group 1 did not significantly differ from Group 2. Since the mean original difference and variance original difference falls between 2.5% and 97.5% boundaries, we conclude that full invariance has been established for the two groups of survey data. This means all composite models of SWMB construct carried almost similar meanings that are supposed to be measured in relation to the measurement of constructs. Since the composites in both groups are almost identical, the samples from both surveys were pooled in the view of generalizing the concept of SWMB, which would be possible by increasing the statistical power of larger sample size.
Table 5. MICOM results of composites’ mean values
Table 6. MICOM results of composites’ variances values
5.2. Stage 2. sample characteristics
The findings of sample profile are shown in . The highest response was obtained from the age group of 19 years (26.6%) followed by 18 years (20.6%), 20 years (18.8%), 22 years (17.2%) and 21 years (16.8%). In terms of gender, responses from male students (57.9%) were higher than female students (42.1%). Education-wise, the majority of students were from engineering (42.1%) followed by medical (18%), nursing (14.2%), arts (8.2%), commerce (6.4%), science (6.8%) and Sanskrit (4.3%). In terms of place of living, urban residents (53.6%) were of majority as compared to rural residents (46.4%). Maximum respondents from middle-class group were higher (42.1%), followed by lower class group (26.2%), upper middle-class group (15.9%), rich class (10.3%), below poverty group (3.4%) and lower middle-class group (2.1%). As it can be observed, the demographic characteristics denote a fair representation of sample from selected population.
Table 7. Sample characteristics
5.3. Stage 3: reliability and validity tests
Measurement model of SEM was initially developed to validate 84 items (excluding 06 demographics items) and results are presented in the following sections.
5.3.1. Model fit
Assessing whether the specified model “fits” the data is one of the primary steps before validating an instrument. The model fit for SEM-PLS is assessed by using standardised Root Mean Square Residual (SRMR), Normed Fit Index (NFI) and Root Mean Squared residual covariance matrix of outer model residuals (RMS_theta).
SRMR is the difference between observed correlation and the model implied correlation matrix, and it provides the average discrepancies between observed and expected correlations as an absolute measure of model fit (J. Hair et al., Citation2017). If the standard value of SRMR is less than 0.1, it can be considered as a good model fit and in the present case, the value of SRMR is found to be 0.079 and hence it demonstrates a good model fit.
NFI assesses the model correlation of measured variables with statistic range from 0 to 1. The closer the value to 1, better is the model fit (Smith & McMillan, Citation2001). In this case, NFI obtained is 0.932 which shows that there is a good model fit.
Another way of assessing model fit is using RMS_ Theta. This value assesses the degree to which the outer model residuals correlate. A value closer to 0 indicates a good model fit and Henseler et al. (Citation2014) suggests that RMS_theta value of less than 0.12 indicates a well-fitting model. In the present case, it is observed that the RMS_theta value is 0.114 which indicates the outer model residuals are very small and demonstrates a good model fit.
Based on the above results it can be concluded that the proposed SEM model for this research has a good model fit. shows model fit results.
Table 8. Results of model fit for measurement model
5.3.2. Internal consistency
The first evaluation that was carried out was internal consistency (reliability) which applies to how well a group of items measure the same characteristics of a concept in different contexts of test-retest procedures (Bannigan & Watson, Citation2009). Internal consistency is a widely used instrument testing method for its efficiency in identifying the errors due to sampling of instrument contents. Thus, the theory is “the higher the internal consistency, reliability of the instrument will be higher’ (McDowell & Newell, Citation1996, p. 40). The most commonly used criterion for internal consistency is Cronbach’s alpha. Nunally (1995) highlights that Cronbach alpha is the best estimate of reliability as the major errors of instrument is due to the sampling of its contents and it reflects the internal correlations of the observed variables. An alpha value of 0.7 is considered to be an acceptable threshold value for reliability. In the present case, Cronbach alpha values of all factors ranged from 0.7 to 0.9 except for SWMB2 which had 0.680. However, SWMB2 was retained considering the earlier studies which states that if the item is relevant and nearer to 0.7, it can be retained (Chan & Idris, Citation2017). Additionally, in SEM-PLS, the limitation of Cronbach’s alpha is that it is sensitive to the number of items and generally it provides a more conservative measure of internal consistency (J. Hair et al., Citation2017). Hence, an alternate approach is used in SEM-PLS which is referred as composite reliability, where the values of 0.6 to 0.9 are acceptable in exploratory research and 0.7 to 0.9 are acceptable in advanced research (Taber, Citation2018). Another measure of composite reliability usually considered in SEM analysis is Rho-A, the values of which are above 0.6 and can be considered acceptable (Rigdon et al., Citation2010). On the whole, Cronbach values ranging from 0.6 to 0.9 indicate a moderate to high level of acceptance, composite reliability values of 0.6 to 0.9 confirm satisfactory levels of acceptance and Rho-A value of above 0.6 indicates that the measures of internal consistency are satisfactory as shown in .
Table 9. Factor loadings and reliability measures after factor reduction
5.3.3. Convergent validity
Correlational evidences of an item association with other items of same latent variables are considered to be a vital factor while developing an effective questionnaire. This is because, indicators of a construct are expected to either converge or have a same proportion of variance. Hence, convergent validity, which is the degree to which the measurement model under progress correlates with measurement scale is regarded as one of the prerequisites in testing a hypothesis development. Convergent validity, an assessment of sensitivity of a measurement scale is assessed by outer loading factors and average variance extracted (AVE). The general understanding is that, greater the outer loading value, items of the measurement deals with the same concept of latent construct. Hair Jr et al. (Citation2014) recommend to consider the outer loading values of greater than 0.7 for convergent validity and 0.5 for AVE. In the present case, each item was assessed for construct validity and items shown in were retained and remaining indicators were eliminated due to low factor loadings. It is seen from that all constructs have AVE values of greater than 0.5. Hence, based on AVE and factor loading values, we conclude that the convergent validity of the SWMB model is established.
Table 10. Factor loadings and reliability measures after factor reduction
5.3.4. Discriminant validity
The extent to which one latent variable is different from other latent variable of a construct is an important criterion in validating a questionnaire. This is because, if they are not mutually exclusive, the items of measurement may measure same variable again and again, which is not productive. Schreiber et al. (Citation2006) stressed that each factor is expected to measure same concept but in a unique way because their effect is associated with observed variable collectively. Thus, establishing the uniqueness of each construct is a prerequisite in assessing the measurement scale and to meet this criterion, the usual method that is adopted is that the square roots of AVE of all the dimensions have to be greater than their respective correlation between the remaining constructs (J. Hair et al., Citation2017). In the present case as it is observed in , all factor loadings of indicators associated are greater than the cross loadings of the same indicators with other constructs and hence the discriminant validity of model is established.
Table 11. Discriminant validity
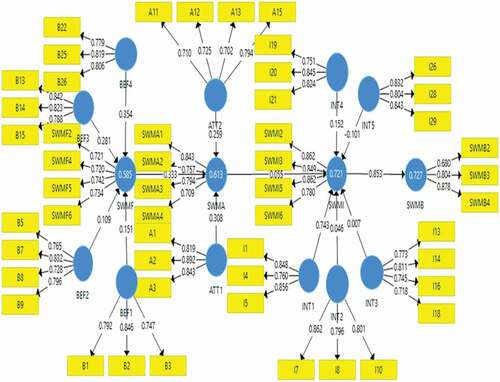
5.3.5. SWMB measurement model after item reduction
Simplification of a model by selecting only parsimonious items that are best suited to a construct is an important aspect of an instrument development. As shown in , it can be viewed that the model is simpler and less complex. It provides an overview of the assessment of factors by item reduction analysis. In total, 33 items were eliminated (SWMF—1, WDB −2, WUB—1, WCB—7, GDB—2; SWMA −1, ENK—5, MOR—1; SWMI—1, SN—3, PBC—2, COC—3, COG-1, AWA—2; SWMB—1) and these empirical results point towards a parsimonious model that depicts the relationships between various constructs and measures of SWMBQ.
Figure 3. Measurement model of SWMB after item reduction
5.4. Stage 4: item elimination
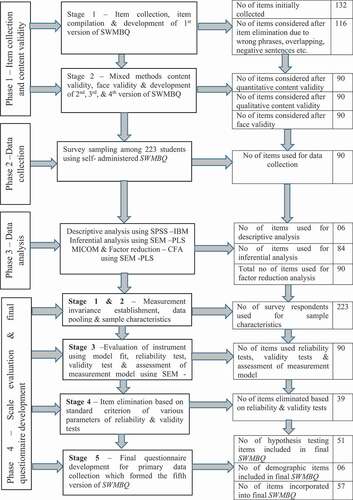
The primary focus of this study was to design an instrument that can measure the antecedents of SWMB among youths. In that progression, 15 constructs were developed using TPB. This phase led to an initial pool of 132 items , which was later reduced to 116 items and 90 items, after considering wrong phrases, overlapping structures and mixed methods content analysis. Of 90 items, 84 items were again subjected to item reduction analysis. While identifying those items which are parsimonious, functional, and internally consistent, this study conducted internal consistency, composite reliability, convergent validity and discriminant validity tests by employing SEM-PLS technique. Finally, total number of items included were: 17 items for SWMF (WRB—3; WUB—4; WCB—3; GDB—3 and SWMF—4), 11 to SWMA (ENK—3, MOR—4 and SWMA—4), 20 to SWMI (SN—3, PBC—3, COC—4, COG—3, AWA- 3 and SWMI—4) and 3 items for SWMB. After elimination of 33 items due to validation procedure, the final version of SWMBQ was designed with 57 items that included 6 demographic items. shows total number of items that were carried over for the final form of SWMBQ development.
Table 12. Summary of number of items carried over for primary data collection
5.4.1. Stage 5: Final questionnaire development
A total of 57 indicators (including 6 demographic factors) were compiled and a questionnaire for primary data collection was thus developed, which formed the final version of SWMBQ. The fifth and final version of developed SWMBQ is provided in Appendix I.
6. Discussion
Our literature review revealed the need for a well-developed, reliable and valid method of measuring a questionnaire in the SWMB context. Such a structure of measurement is considered to be a necessity for theory building research, where the accuracy of measures depends on the integrity of a study while exploring a complex phenomenon such as SWMB. The procedures adopted were appropriate and rigorous, and it comprised systematic methods of item collection, content validity using mixed methods procedure, pre-testing questions, survey administration, establishing MI and pooling the data, item reduction analysis, scale evaluation using CFA, data merging using MICOM, tests of reliability and validity using SEM-PLS and finally developing a questionnaire that is ready to be used for primary data collection. In scale development phase, item reduction was undertaken to ensure that only parsimonious, operative and internally consistent items are included to ultimately elevate the efficiency of items that can best capture behavioural aspects of SWM of an individual. The obtained results of validity and reliability tests using non-parametric procedure of variance-based SEM indicates that the preliminary ground work pertaining to item generation and item collection is crucial and item reduction during the initial stages of scale development is a prerequisite in attaining the recommended values of parameters estimation.
In quantitative environmental psychology, one of the most critical scrutiny while designing an instrument that is to be served for primary data collection is: whether a set of items assess one concept in common. In other words, the retained items in scale measurement must all be the indicators of common underlying construct and its respective items should share common variance (Falissard, Citation1999; Gardner, Citation1995; Gerbing & Anderson, Citation1988; Pingault et al., Citation2012). In order to achieve this criterion, this study employed CFA to test whether the item scores are measuring the same concept that is supposed to be measured. The obtained validity and reliability test scores illustrate that our findings have substantial loadings providing the strongest evidence to support the claim that our developed scale is unidimensional. Cronbach alpha statistics which is most widely used estimating factor for internal consistency is satisfactory indicating that every item in our scale shares common variance with at least some other item in the scale. In addition, our Rho-A values and composite reliability values are excellent which illustrates the cohesiveness of the scale. Further, the sophisticated relationship findings in terms of attaining the technical prerequisite between observed and latent variables allow us to assert that this SWMB scale is unidimensional in nature.
Further, the goal of this study was not only to identify irrelevant or least related items of the domain of interest, but the research basically looked for statistical tests to understand whether the collected data fits SWMB measurement model and provide a robust validation output for the developed questionnaire. Researchers from several fields suggest that the validation of a scale is well depicted with improved results when CFA and SEM are applied together (Bryant & Yarnold, Citation1995; Kyriazos, Citation2018; Sarstedt & Cheah, Citation2019; Schreiber et al., Citation2006). CFA assesses all psychometric properties through statistical tests and SEM provides straight-forward multiple relationship results through statistical efficiency. Drawing the advantages of using them together, scientists have utilized this prominent approach to estimate the models in the fields of business research, knowledge management, agriculture, pharmacy and psychology (Abbasi & Zamani-Miandashti, Citation2013; Hadrich & Olson, Citation2011; Huang & Lai, Citation2012; Prabhu et al., Citation2011; Rabaa’i, Citation2016; Wang & Ahmed, Citation2004). It was hence the scope of this paper to utilize the applications of CFA and SEM in the domain of environmental management as well to estimate the values of indicators, assess the parameters of SWMB constructs and to technically reduce the difference between estimated and observed matrices. We hope that this adoption of CFA and SEM combination brings a transition of developing more systematic method of questionnaire validation in environmental management field too, which is regarded as a holistic way of developing a questionnaire. An overview of systematic and methodical stages of item reduction and scale development that we adopted in this study is depicted in .
Figure 4. Summary of scale evaluation and validation procedure of SWMBQ
7. Conclusion
Studies pertaining to scale measurement within SWMB domain are scarce and hence we attempted this research to contribute to the content of international literature. Although this study is unique in many ways, this study is novel in two ways. First, this research on development and validation of SWMB instrument utilized mixed methods approach of content validity, which is kind of first in environmental psychology. This approach is apt since TPB is basically a theory-driven framework and estimation of content validity using primary concepts of the theory (qualitative) and then empirically (quantitative) testing the items measure the core concepts of the theory. Since the theoretical frameworks are qualitative and the evaluation of item alignment to the core concepts are quantitative (Newman et al., Citation2013), we have attempted to design the questionnaire using mixed methods procedure of content validity. This approach aided in item purification process as it underwent the strengths of both techniques. Second, this research employed MICOM procedure of SEM-PLS version 3.0 to merge the samples collected from rural and urban groups of pen/pencil and web-based survey administration. MICOM, the new method of merging data was useful in establishing MI among different groups and cultures and this new feature was found to be less complex as compared to other techniques. We hope this study would benefit other researchers to conduct more such research in environmental management discipline and utilize this method of content validity and data pooling techniques which have the potency to enhance the quality of items as explained in this article.
This scale is basically designed to capture the behavioural antecedents of SWMB among youths. However, the systematic and extensive methods utilized in this research hold appropriate to all sampling units. Hence the procedures presented in this paper can be extended to other target population such as retirees, housewives, general population, school children, etc. The MICOM procedure to merge two types of survey data and the measurement scale techniques which underwent strict and robust tests provided replicable and trustworthy results showing that the final indicators adopted in this study are suitable for repeatability in different settings and contexts as well. Thus the scope of this paper is accomplished by contributing to the content of international and progressive research, and its higher purpose of environmental protection. Further, to strengthen the rigour of the instrument, for future research we recommend undertaking mixed methods content validity using covariance-based methods (SEM-Analysis moment of structure) to compare the efficiency of statistical techniques.
Competing interests
The authors declare no competing interest
Acknowledgements
We are grateful to Dr Ajay Bailey, Associate Professor, Department of Human Geography and Spatial Planning, Faculty of Geosciences, Utrecht University, Netherlands; Dr Arminda do Paço, Professor, Universidade da Beira Interior, Department of Business and Economics, Research Unit NECE, University of Beira Interior, Portugal; Dr Jitti Mongolchiarunya, Dean, Puey Ungphakorn School of Development Studies, Thammasat University, Pathumthani, Thailand; Dr James Gaskin, Associate Professor of Information Systems, Brigham Young University, USA; Dr Jessica Chandras, Assistant Professor, Department of Anthropology Kenyon College, USA and Web Editor of Critical Asian Studies, USA; Siti Fadzilah binti Ayob, Faculty of Management, Universiti Teknologi Malaysia, Malaysia; Siti Nur Diyana Mahmud, Faculty of Education, Universiti Kebangsaan Malaysia, Malaysia and Dr Nooraida Yakob, Senior lecturer, School of Educational studies, Universiti Sains Malaysia, Malaysia, for their time, patience, co-operation and valuable inputs during item collection, content validity and factor reduction stages of designing an instrument to explore the antecedents of SWMB.
Additional information
Funding
Notes on contributors

Lewlyn L. R. Rodrigues
Sumana Jagadeshi Raghu is a second year research scholar in Humanities & Management at MIT, Manipal, India and she has pursued Bachelors in Civil Engineering and Masters in Environmental Science.
Lewlyn L.R. Rodrigues is Professor in Humanities & Management at MIT, Manipal, India and has guided 11 PhDs and is currently guiding 9 PhDs in engineering, water conservation behaviour, solid waste management and management science. He has authored two books and has over 200 publications.
References
- Abbasi, E., & Zamani-Miandashti, N. (2013). The role of transformational leadership, organizational culture and organizational learning in improving the performance of Iranian agricultural faculties. Higher Education, 66(4), 505–32. https://doi.org/10.1007/s10734-013-9618-8
- Ajzen, I. (1985). From intentions to actions: A theory of planned behavior. In Action control (pp. 11–39). Springer.
- Ajzen, I. (1991). “The theory of planned behavior.”. Organizational Behavior and Human Decision Processes, 50(no. 2), 179–211. https://doi.org/10.1016/0749-5978(91)90020-T
- Ajzen, I., & Madden, T. J. (1986). Prediction of goal-directed behavior: Attitudes, intentions, and perceived behavioral control. Journal of experimental social psychology, 22(5), 453–474
- Allport, G. W. (1935). Attitude. handbook of social psychology. Oxford University press.
- Anderson, J. C., & Gerbing, D. W. (1991). Predicting the performance of measures in a confirmatory factor analysis with a pretest assessment of their substantive validities. Journal of Applied Psychology, 76(5), 732. https://doi.org/10.1037/0021-9010.76.5.732
- Bannigan, K., & Watson, R. (2009). Reliability and validity in a nutshell. Journal of Clinical Nursing, 18(23), 3237–3243. https://doi.org/10.1111/j.1365-2702.2009.02939.x
- Barr, S. (2004). “Are we all environmentalists now? Rhetoric and reality in environmental action.”. Geoforum, 35(no. 2), 231–249. https://doi.org/10.1016/j.geoforum.2003.08.009
- Baud, I. S. A., Grafakos, S., Hordijk, M., & Post, J. (2001). Quality of life and alliances in solid waste management: Contributions to urban sustainable development. Cities, 18(1), 3–12. https://doi.org/10.1016/S0264-2751(00)00049-4
- Bialosiewicz, S., Murphy, K., & Berry, T. (2013). Do our measures measure up? The critical role of measurement invariance. Resource Packet for Participants, Claremont. 1-37.
- Boateng, G. O., Neilands, T. B., Frongillo, E. A., Melgar-Quiñonez, H. R., & Young, S. L. (2018). Best practices for developing and validating scales for health, social, and behavioral research: A primer. Frontiers in Public Health, 6, 149. https://doi.org/10.3389/fpubh.2018.00149
- Bollen, K. A., & Ting, K. F. (1993). Confirmatory tetrad analysis. Sociological Methodology, 23(1993), 147–175. https://doi.org/10.2307/271009
- Breen, J. S. (2019). Developing the co-worker acceptance of disabled employees (CADE) scale. The Australian Journal of Rehabilitation Counselling, 25(1), 1–14. https://doi.org/10.1017/jrc.2019.6
- Bruce, B., & Fries, J. F. (2003). The Stanford health assessment questionnaire: Dimensions and practical applications. Health and Quality of Life Outcomes, 1(1), 20. https://doi.org/10.1186/1477-7525-1-20
- Bryant, F. B., & Yarnold, P. R. (1995). Principal-components analysis and exploratory and confirmatory factor analysis. In GrimmL. G. & YarnoldP. R. (Eds.), Reading and understanding multivariate statistics (p. 99–136). American Psychological Association.
- Byrne, B. M. (1988). The self description questionnaire III: testing for equivalent factorial validity across ability. Educational and Psychological Measurement, 48(2), 397–406. https://doi.org/10.1177/0013164488482012
- Cade, J., Thompson, R., Burley, V., & Warm, D. (2002). Development, validation and utilisation of food-frequency questionnaires–a review. Public Health Nutrition, 5(4), 567–587. https://doi.org/10.1079/PHN2001318
- Central Pollution Control Board, India, 2019. https://www.cpcb.nic.in/(accessed on Mar, 2020).
- Chan, L. L., & Idris, N. (2017). Validity and reliability of the instrument using exploratory factor analysis and Cronbach’s alpha. International Journal of Academic Research in Business and Social Sciences, 7(10), 400–410. https://doi.org/10.6007/IJARBSS/v7-i10/3387
- Chatterji, M. (2002). Measuring leader perceptions of school readiness for reforms: Use of an iterative model combining classical and Rasch methods. Journal of Applied Measurement, 3(4), 455–485.
- Chen, F. F., Sousa, K. H., & West, S. G. (2005). Teacher’s corner: Testing measurement invariance of second-order factor models. Structural Equation Modeling, 12(3), 471–492. https://doi.org/10.1207/s15328007sem1203_7
- Cheung, G. W. (2008). Testing equivalence in the structure, means, and variances of higher-order constructs with structural equation modeling. Organizational Research Methods, 11(3), 593–613. https://doi.org/10.1177/1094428106298973
- Chou, C. P., Hser, Y. I., & Anglin, M. D. (1996). Pattern reliability of narcotics addicts’ self-reported data: A confirmatory assessment of construct validity and consistency. Substance Use & Misuse, 31(9), 1189–1216. https://doi.org/10.3109/10826089609063972
- Churchill Jr, G. A., & Peter, J. P. (1984). Research design effects on the reliability of rating scales: A meta-analysis. Journal of Marketing Research, 21(4), 360–375. https://doi.org/10.1177/002224378402100402
- Cook, J. E., & Wolf, A. L. (1999). Software process validation: Quantitatively measuring the correspondence of a process to a model. ACM Transactions on Software Engineering and Methodology (TOSEM), 8(2), 147–176. https://doi.org/10.1145/304399.304401
- Curkovic, S. (2003). Environmentally responsible manufacturing: The development and validation of a measurement model. European Journal of Operational Research, 146(1), 130–155. https://doi.org/10.1016/S0377-2217(02)00182-0
- Dagger, T. S., Sweeney, J. C., & Johnson, L. W. (2007). A hierarchical model of health service quality: Scale development and investigation of an integrated model. Journal of Service Research, 10(2), 123–142. https://doi.org/10.1177/1094670507309594
- Daneshvary, N., Daneshvary, R., & Schwer, R. K. (1998). Solid-waste recycling behavior and support for curbside textile recycling. Environment and Behavior, 30(2), 144–161.
- Davis, R., Campbell, R., Hildon, Z., Hobbs, L., & Michie, S. (2015). “Theories of behaviour and behaviour change across the social and behavioural sciences: A scoping review.”. Health Psychology Review, 9(no. 3), 323–344. https://doi.org/10.1080/17437199.2014.941722
- Ebreo, A., Hershey, J., & Vining, J. (1999). Reducing solid waste: Linking recycling to environmentally responsible consumerism. Environment and Behavior, 31(1), 107–135. https://doi.org/10.1177/00139169921972029
- Evers, A. T., Kreijns, K., & Van der Heijden, B. I. (2016). The design and validation of an instrument to measure teachers’ professional development at work. Studies in Continuing Education, 38(2), 162–178. https://doi.org/10.1080/0158037X.2015.1055465
- Falissard, B. (1999). The unidimensionality of a psychiatric scale: A statistical point of view. International Journal of Methods in Psychiatric Research, 8(3), 162–167. https://doi.org/10.1002/mpr.66
- Fowler Jr, F. J. (1992). How unclear terms affect survey data. Public Opinion Quarterly, 56(2), 218–231. https://doi.org/10.1086/269312
- Gardner, P. L. (1995). Measuring attitudes to science: Unidimensionality and internal consistency revisited. Research in Science Education, 25(3), 283–289. https://doi.org/10.1007/BF02357402
- Gerbing, D. W., & Anderson, J. C. (1988). An updated paradigm for scale development incorporating unidimensionality and its assessment. Journal of Marketing Research, 25(2), 186–192. https://doi.org/10.1177/002224378802500207
- Gerbing, D. W., & Hamilton, J. G. (1996). Viability of exploratory factor analysis as a precursor to confirmatory factor analysis. Structural Equation Modeling: A Multidisciplinary Journal, 3(1), 62–72. https://doi.org/10.1080/10705519609540030
- Hadrich, J. C., & Olson, F. (2011). Joint measurement of farm size and farm performance: A confirmatory factor analysis. Agricultural Finance Review, 71(3), 295–309. https://doi.org/10.1108/00021461111177585
- Hair, J., Hollingsworth, C. L., Randolph, A. B., & Chong, A. Y. L. (2017). An updated and expanded assessment of PLS-SEM in information systems research. Industrial Management & Data Systems, 117(3), 442–458. https://doi.org/10.1108/IMDS-04-2016-0130
- Hair, J. F., Risher, J. J., Sarstedt, M., & Ringle, C. M. (2019). When to use and how to report the results of PLS-SEM. European Business Review, 31(1), 2–24. https://doi.org/10.1108/EBR-11-2018-0203
- Hair Jr, J. F., Sarstedt, M., Hopkins, L., & Kuppelwieser, V. G. (2014). Partial least squares structural equation modeling (PLS-SEM). European Business Review, 26(2), 106-121. https://doi.org/10.1108/EBR-10-2013-0128.
- Ham, M., Jeger, M., & Frajman Ivković, A. (2015). The role of subjective norms in forming the intention to purchase green food. Economic research-Ekonomska istraživanja, 28(1), 738–748.
- Hänsch, K., & Kinkel, K. (1995). EUROPEAN PARLIAMENT AND COUNCIL DIRECTIVE 94/62/EC of 20 December 1994 on packaging and packaging waste. Journal of Environmental Law, 7(2), 323–337.
- Harrington, D. (2009). Confirmatory factor analysis. Oxford university press.
- Haynes, S. N., Richard, D., & Kubany, E. S. (1995). Content validity in psychological assessment: A functional approach to concepts and methods. Psychological Assessment, 7(3), 238. https://doi.org/10.1037/1040-3590.7.3.238
- Henseler, J., Dijkstra, T. K., Sarstedt, M., Ringle, C. M., Diamantopoulos, A., Straub, D. W., … Calantone, R. J. (2014). Common beliefs and reality about PLS: Comments on Rönkkö and Evermann (2013). Organizational Research Methods, 17(2), 182–209. https://doi.org/10.1177/1094428114526928
- Henseler, J., Hubona, G., & Ray, P. A. (2016). Using PLS path modeling in new technology research: Updated guidelines. Industrial Management & Data Systems, 116(1), 2–20. https://doi.org/10.1108/IMDS-09-2015-0382
- Holden, R. R. (2010). Face validity. The Corsini Encyclopedia of Psychology, 1–2. https://doi.org/10.1002/9780470479216.corpsy0341
- Hopper, J. R., & Nielsen, J. M. (1991). Recycling as altruistic behavior: Normative and behavioral strategies to expand participation in a community recycling program. Environment and Behavior, 23(2), 195–220. https://doi.org/10.1177/0013916591232004
- Hoyle, R. H. (2000). Confirmatory factor analysis. In Handbook of applied multivariate statistics and mathematical modeling (pp. 465–497). Academic press, Department of Psychology, University of Kentucky, Lexington, Kentucky.
- Huang, L. S., & Lai, C. P. (2012). An investigation on critical success factors for knowledge management using structural equation modeling. Procedia-Social and Behavioral Sciences, 40(2012), 24–30. https://doi.org/10.1016/j.sbspro.2012.03.156
- Hurley, A. E., Scandura, T. A., Schriesheim, C. A., Brannick, M. T., Seers, A., Vandenberg, R. J., & Williams, L. J. (1997). Exploratory and confirmatory factor analysis: Guidelines, issues, and alternatives. Journal of Organizational Behavior, 18(6), 667–683. https://doi.org/10.1002/(SICI)1099-1379(199711)18:6<667::AID-JOB874>3.0.CO;2-T
- Idaszak, J. R., & Drasgow, F. (1987). A revision of the job diagnostic survey: elimination of a measurement artifact. Journal of Applied Psychology, 72(1), 69. https://doi.org/10.1037/0021-9010.72.1.69
- Ifinedo, P. (2018). Roles of perceived fit and perceived individual learning support in students’ weblogs continuance usage intention. International Journal of Educational Technology in Higher Education, 15(1), 7. https://doi.org/10.1186/s41239-018-0092-3
- Jekria, N., & Daud, S. (2016). Environmental concern and recycling behaviour. Procedia Economics and Finance, 35(2016), 667–673. https://doi.org/10.1016/S2212-5671(16)00082-4
- Kendall, S., & Bloomfield, L. (2005). Developing and validating a tool to measure parenting self‐efficacy. Journal of Advanced Nursing, 51(2), 174–181. https://doi.org/10.1111/j.1365-2648.2005.03479.x
- Kim, M. S., & Hunter, J. E. (1993). Attitude‐behavior relations: A meta‐analysis of attitudinal relevance and topic. Journal of Communication, 43(1), 101–142. https://doi.org/10.1111/j.1460-2466.1993.tb01251.x
- Kortte, K. B., Falk, L. D., Castillo, R. C., Johnson-Greene, D., & Wegener, S. T. (2007). The Hopkins rehabilitation engagement rating scale: Development and psychometric properties. Archives of Physical Medicine and Rehabilitation, 88(7), 877–884. https://doi.org/10.1016/j.apmr.2007.03.030
- Kyriazos, T. A. (2018). Applied psychometrics: Sample size and sample power considerations in factor analysis (EFA, CFA) and SEM in general. Psychology, 9(8), 2207. https://doi.org/10.4236/psych.2018.98126
- Ma, J., Hipel, K. W., Hanson, M. L., Cai, X., & Liu, Y. (2018). An analysis of influencing factors on municipal solid waste source-separated collection behavior in Guilin, China by using the theory of planned behavior. Sustainable Cities and Society, 37, 336–343. https://doi.org/10.1016/j.scs.2017.11.037
- MacKenzie, S. B., Podsakoff, P. M., & Podsakoff, N. P. (2011). Construct measurement and validation procedures in MIS and behavioral research: Integrating new and existing techniques. MIS quarterly, 293–334.
- MacKenzie, S. B., Podsakoff, P. M., & Podsakoff, N. P. (2011). Construct measurement and validation procedures in MIS and behavioral research: Integrating new and existing techniques. MIS Quarterly, 35(2), 293–334. https://doi.org/10.2307/23044045
- Mahmud, S. N. D., & Osman, K. (2010). The determinants of recycling intention behavior among the Malaysian school students: an application of theory of planned behaviour. Procedia-Social and Behavioral Sciences, 9, 119–124.
- McDowell, I., & Newell, C. (1996). A guide to rating scales and questionnaires. A Guide to Rating Scales and Questionnaires. 29-37. measuring_health_mcdowell_and_newell_1996.pdf (d1wqtxts1xzle7.cloudfront.net)
- Michie, S., & Abraham, C. (2004). “Interventions to change health behaviours: Evidence-based or evidence-inspired ?” Psychology & Health, 19(1), 29–49. https://doi.org/10.1080/0887044031000141199
- Michie, S., Johnson, B. T., & Johnston, M. (2015). Advancing cumulative evidence on behaviour change techniques and interventions: A comment on Peters, de Bruin, and Crutzen. Health Psychology Review, 9(1), 25–29. https://doi.org/10.1080/17437199.2014.912538
- Morgeson, F. P., & Humphrey, S. E. (2006). The Work Design Questionnaire (WDQ): developing and validating a comprehensive measure for assessing job design and the nature of work. Journal of applied psychology, 91(6), 1321.
- Mosconi, M., Nelson, L., & Hooper, S. R. (2008). Confirmatory factor analysis of the NEPSY for younger and older school-age children. Psychological Reports, 102(3), 861–866. https://doi.org/10.2466/pr0.102.3.861-866
- Neumann, C. S., Kosson, D. S., & Salekin, R. T. (2007). Exploratory and confirmatory factor analysis of the psychopathy construct: methodological and conceptual issues. The Psychopath: Theory, Research, and Practice - Google Books (Eds.), Hugus Herve' and John C. Yuille, 79–104.
- Nevo, B. (1985). Face validity revisited. Journal of Educational Measurement, 22(4), 287–293. https://doi.org/10.1111/j.1745-3984.1985.tb01065.x
- Newman, I., Lim, J., & Pineda, F. (2013). Content validity using a mixed methods approach: Its application and development through the use of a table of specifications methodology. Journal of Mixed Methods Research, 7(3), 243–260. https://doi.org/10.1177/1558689813476922
- Nunnally, J. C. (1994). Psychometric theory 3E. Tata McGraw-hill education.
- Nunnally, J. C., & Bernstein, I. H. (1994). Validity. Psychometric Theory, 3, 99–132.
- Pakpour, A. H., Zeidi, I. M., Emamjomeh, M. M., Asefzadeh, S., & Pearson, H. (2014). Household waste behaviours among a community sample in Iran: An application of the theory of planned behaviour. Waste management, 34(6), 980–986.
- Pappu, A., Saxena, M., & Asolekar, S. R. (2007). Solid wastes generation in India and their recycling potential in building materials. Building and Environment, 42(6), 2311–2320. https://doi.org/10.1016/j.buildenv.2006.04.015
- Parsian, N., & Dunning, T. (2009). Developing and validating a questionnaire to measure spirituality: A psychometric process. Global Journal of Health Science, 1(1), 2–11. https://doi.org/10.5539/gjhs.v1n1p2
- Penny, A. M., Waschbusch, D. A., Klein, R. M., Corkum, P., & Eskes, G. (2009). Developing a measure of sluggish cognitive tempo for children: content validity, factor structure, and reliability. Psychological Assessment, 21(3), 380. https://doi.org/10.1037/a0016600
- Pingault, J. B., Falissard, B., Côté, S., & Berthoz, S. (2012). A new approach of personality and psychiatric disorders: A short version of the affective neuroscience personality scales. PLoS One, 7(7), e41489. https://doi.org/10.1371/journal.pone.0041489
- Pluye, P., Granikov, V., Bartlett, G., Grad, R. M., Tang, D. L., Johnson-Lafleur, J., & Shohet, L. (2014). Development and content validation of the information assessment method for patients and consumers. JMIR Research Protocols, 3(1), e7. https://doi.org/10.2196/resprot.2908
- Pohjola, V. J., & Pongrácz, E. (2002). An approach to the formal theory of waste management. Resources, conservation and recycling, 35(1–2), 17–29.
- Pongrácz, E., & Pohjola, V. J. (2004). Re-defining waste, the concept of ownership and the role of waste management. Resources, conservation and Recycling, 40(2), 141–153.
- Prabhu, V. V., Nalini, G., Chidambaranathan, N., & Kisan, S. S. (2011). Evaluation of anti-inflammatory and analgesic activity of Tridax procumbens Linn. against formalin, acetic acid and CFA induced pain models. Int J Pharm Pharm Sci, 3(2), 126–130.
- Rabaa’i, A. A. (2016). Extending the technology acceptance model (TAM) to assess students’ behavioural intentions to adopt an e-learning system: The case of moodle as a learning tool. Journal of Emerging Trends in Engineering and Applied Sciences, 7(1), 13–30.
- Raghu, S. J., & Rodrigues, L. L. (2020). Behavioral aspects of solid waste management: A systematic review. Journal of the Air & Waste Management Association, 70(12), 1268–1302.
- Rigdon, E. E., Ringle, C. M., & Sarstedt, M. (2010). Structural modeling of heterogeneous data with partial least squares. In Review of marketing research. Emerald Group Publishing Limited.
- Ríos, M. F., Vielma, R. G. R., García, J. C. S., Aravena, M. B., Vargas, J. D. P., & Díaz, M. Á. R. (2017). Spanish-language adaptation of morgeson and humphrey’s work design questionnaire (WDQ). The Spanish Journal of Psychology, 20(e28), 1–30. https://doi.org/10.1017/sjp.2017.24
- Sarstedt, M., & Cheah, J. H. (2019). Partial least squares structural equation modeling using SmartPLS: A software review. Journal of Marketing Analytics, 7(3), 196–202. https://doi.org/10.1057/s41270-019-00058-3
- Sasaki, S., Yanagibori, R., & Amano, K. (1998). Self-administered diet history questionnaire developed for health education: A relative validation of the test-version by comparison with 3-day diet record in women. Journal of Epidemiology, 8(4), 203–215. https://doi.org/10.2188/jea.8.203
- Scandura, T. A., & Williams, E. A. (2000). Research methodology in management: Current practices, trends, and implications for future research. Academy of Management Journal, 43(6), 1248–1264. https://doi.org/10.5465/1556348
- Schreiber, J. B., Nora, A., Stage, F. K., Barlow, E. A., & King, J. (2006). Reporting structural equation modeling and confirmatory factor analysis results: A review. The Journal of Educational Research, 99(6), 323–338. https://doi.org/10.3200/JOER.99.6.323-338
- Sinkovics, R. R., Henseler, J., Ringle, C. M., & Sarstedt, M. (2016). Testing measurement invariance of composites using partial least squares. International marketing review.
- Smith, T. D., & McMillan, B. F. (2001). A primer of model fit indices in structural equation modeling.
- Spector, P. E. (1992). Summated rating scale construction: an introduction (Vol. 82). Sage.
- Stern, P. C. (2000). New environmental theories: toward a coherent theory of environmentally significant behavior. Journal of social issues, 56(3), 407–424.
- Suhr, D. D. (2006). Exploratory or confirmatory factor analysis?
- Taber, K. S. (2018). The use of Cronbach’s alpha when developing and reporting research instruments in science education. Research in Science Education, 48(6), 1273–1296. https://doi.org/10.1007/s11165-016-9602-2
- Tashakkori, A., & Teddlie, C. (2009). Integrating qualitative and quantitative approaches to research. The SAGE Handbook of Applied Social Research Methods, 2(9), 283–317.https://doi.org/10.4135/9781483348858.n9
- Themelis, N. J., & Ulloa, P. A. (2007). Methane generation in landfills. Renewable Energy, 32(7), 1243–1257. https://doi.org/10.1016/j.renene.2006.04.020
- Tobin, K. G., Tippins, D. J., & Hook, K. (1994). Referents for changing a science curriculum: A case study of one teacher’s change in beliefs. Science & Education, 3(3), 245–264. https://doi.org/10.1007/BF00540156
- Vandenberg, R. J., & Lance, C. E. (2000). A review and synthesis of the measurement invariance literature: Suggestions, practices, and recommendations for organizational research. Organizational Research Methods, 3(1), 4–70. https://doi.org/10.1177/109442810031002
- Wang, C. L., & Ahmed, P. K. (2004). The development and validation of the organisational innovativeness construct using confirmatory factor analysis. European Journal of Innovation Management, 7(4), 303–313. https://doi.org/10.1108/14601060410565056
- Werner, C. M., & Makela, E. (1998). “Motivations and behaviors that support recycling.”. Journal of Environmental Psychology, 18(no. 4), 373–386. https://doi.org/10.1006/jevp.1998.0114
- Wheeler, A. H., Goolkasian, P., Baird, A. C., & Darden, B. V. (1999). Development of the Neck Pain and Disability Scale: Item analysis, face, and criterion-related validity. Spine, 24(13), 1290. https://doi.org/10.1097/00007632-199907010-00004
- Zagirre‐Olaizola, J., Fernández‐Sainz, A., & Vicente‐Molina, M. A. (2015). Internal determinants of recycling behaviour by university students: A cross‐country comparative analysis. International Journal of Consumer Studies, 39(1), 25–34.
- Zhang, D., Huang, G., Yin, X., & Gong, Q. (2015). Residents’ waste separation behaviors at the source: Using SEM with the theory of planned behavior in Guangzhou, China. International Journal of Environmental Research and Public Health, 12(8), 9475–9491.
- Zurbrügg, C., Gfrerer, M., Ashadi, H., Brenner, W., & Küper, D. (2012). Determinants of sustainability in solid waste management–The Gianyar Waste Recovery Project in Indonesia. Waste Management, 32(11), 2126–2133. https://doi.org/10.1016/j.wasman.2012.01.011
Appendix I