
Abstract
This study sought to test if trait levels of impulsivity were related in a nonmonotonic manner to success on a laboratory task of impulsivity. Participants completed the MMPI-2-RF, a self-report measure of psychopathology, and the Angling Risk Task (ART), a laboratory measure of impulsivity. Variables of interest were T-scores on the MMPI-2-RF scale Behavioral/Externalizing Dysfunction (BXD) and total money earned on the ART, which was conceptualized as a measure of success on the task. After screening, the sample consisted of 173 undergraduate students. The findings showed no evidence to support a nonmonotonic relationship between BXD scores and success on the Angling Risk Task when tested by (1) polynomial regression, and (2) the two lines test, a procedure recently developed to detect nonmonotonicity. Results do not support the hypothesis of an optimal level of impulsivity, at least in a nonclinical population and with a laboratory operationalization of impulsivity. Future studies should examine this question in samples with greater variability and using more consequential operationalizations of impulsivity.
Although there has been extensive study on the relationship between impulsivity as measured by self-report and laboratory task (Cyders & Coskunpinar, Citation2012), as well as a substantial literature demonstrating the clinical relevance of high scores on self-report measures of impulsivity, both of these research literatures have generally assumed the relationship between the two is monotonic, with problematic performance on lab measures and in real life associated with high scores alone on self-report measures. However, a number of theoretical accounts of clinical psychological phenomena suggest a nonmonotonic account of the relationship between impulsivity and performance, in which both the highest and lowest levels of impulsivity are impairing.
Curvilinear relationships are not unheard of in psychology; one of the most famous examples is the Yerkes-Dodson law of arousal and performance (Yerkes & Dodson, Citation1908). In this relationship, arousal and performance are positively correlated until one reaches an optimal level of arousal, after which arousal and performance begin to show a negative correlation. Few researchers, however, have looked for a bell-shaped relationship between impulsivity and success in which an “optimal” level of impulsivity achieves the peak amount of success. A study by Anderson and Revelle (Citation1982) examined whether caffeine intake vs. placebo interacted with impulsivity (low or high) to affect proofreading accuracy for intraword vs. interword errors. They found that participants with low impulsivity who had taken caffeine had more errors than the group with high impulsivity who had also taken caffeine. Not only does this study support the idea that higher levels of impulsivity can be beneficial in some contexts, but it also provides precedent for using “success” as an outcome criterion in conjunction with impulsivity. More recently, Carter and colleagues (Carter et al., Citation2018) conducted a literature review examining the evidence for maladaptive and adaptive levels of personality traits. Looking at the big five personality traits specifically (i.e., agreeableness, conscientiousness, extraversion, openness, and emotional stability), the authors found evidence that, in general, personality traits have an optimal level. Individuals at the extreme (i.e., either too much or too little of a given trait) are likely to show some form of impairment in the workforce. For example, very high levels of conscientiousness are associated with obsessive-compulsive personality disorder and negative reactions to negative performance feedback. Meanwhile, moderate levels of conscientiousness are associated with lower turnover, highest income, and highest subjective socioeconomic status when compared to very low or very high levels of conscientiousness, implying an inverted-u shape between conscientiousness and workplace success (Carter et al., Citation2018).
Likewise, there are theoretical accounts that both low and high levels of externalizing behavior have unique correlates, described in J. H. Block and Block’s (Citation1980), J. Block & Block (Citation2006) theory regarding ego-control and ego-resilience. In this theory ego-control is related to low levels of impulsivity and is described as the disposition to constrain impulses, while ego-resiliency is related to high levels of impulsivity and is associated with responding quickly and flexibly to ambiguous situations. J. Block and Block (Citation2006) assert that each characteristic can become problematic when too extreme and that neither construct is superior to the other. Conceptually, they conceive ego-control and ego-resiliency as opposite poles of a single bipolar dimension.
A recent study offered an especially intriguing example of how this nonmonotonic relationship between self-reported impulsivity and real-world performance might manifest. Corey et al. (Citation2018) assessed the relationship between MMPI-2-RF scales of impulsivity and external criteria in a police officer sample. As expected, they found a positive association between high scores on externalizing scales and self-endorsed impulsive behaviors such as gambling, violations of the law, and drug problems. More interestingly, however, they found that lower scores on these scales were associated with a variety of job-related outcome criteria. They explained that low levels of impulsivity might interfere with job responsibilities requiring immediate action. Together, these findings suggested a nonmonotonic relationship between scores on these measures of externalizing behavior and success in a police officer setting, wherein both too low and too high levels of impulsivity result in poorer performance, while average levels of impulsivity may be optimal for managing risky tasks. This leaves the current literature with the idea that both high levels of impulsivity and low levels of impulsivity as measured by the MMPI-2-RF can impair success in job-related criteria. Corey and colleagues (Carter et al., Citation2018) claim that the BXD scale of the MMPI-2-RF is a bipolar scale, able to capture both low and high levels of externalizing behavior.
In the current study, participants were asked to complete the MMPI-2-RF and the Angling Risk Task (ART). The data were examined for the presence of a nonmonotonic relationship in two ways: first, T-scores on BXD were expected to be significantly and curvilinearly related to performance on the ART, as evaluated via hierarchical multiple regression; and second, T-scores on BXD and performance on the ART were expected to successfully demonstrate nonmonotonicity via segmented regression (Simonsohn, Citation2018), a significant negative relationship across the lower half of the BXD distribution accompanying a significant positive relationship across the upper half of the BXD distribution.
1. Materials and method
1.1. Participants
Participants consisted of 190 undergraduate students at a large public university in the Midwest United States. Of the 173 participants that produced a valid MMPI-2-RF profile (see Data Screening in the Results section below), 70% identified as female, 29% male, and 1% as nonbinary. The ethnic distribution of the sample was 78.6% Caucasian, 12.7% African American, 1.6% Asian, 1.2% American Indian, and 5.8% as multiple or an unlisted option. Ninety-five percent of the sample identified as not Hispanic or Latino, 4% identified as Hispanic or Latino, and one person chose not to respond. Participants were compensated for time spent with credit in their psychology courses. They were also incentivized to do well on the Angling Risk Task (described below) by earning money at a rate of one cent for every two points earned. Payouts ranged from $0 to $5.30, with an average payout of $3.56 (SD = .96).
Statistical power was estimated in two ways (via G*Power 3.1.9.7) corresponding to the two procedures used to test for nonmonotonicity. First, for the hierarchical multiple regression (testing the significance of the regression term representing curvilinearity), given a sample of 173 cases, and an alpha of .05, we had power of .80 to detect an effect size of F2 = .046, which by Cohen’s (Citation1988) heuristic represents a small-to-medium size effect. Second, for the segmented regression analysis, which incorporated Simonsohn’s (Citation2018) Robin Hood algorithm to determine sample sizes of the segments (see Results section below), we estimated power for the zero order correlations between BXD scores and ART performance separately for the two segments of the BXD distribution. With samples of n = 74 and n = 99, and alpha of .05, we had 80% power to detect correlations of r = 31 and r = 27, respectively. We offer additional comments on power for this study in the Discussion section.
1.2. Procedure
Participants completed a demographics questionnaire, the MMPI-2-RF, then the Angling Risk Task in one approximately 2-hour session. This study was considered to be exempt from review by the Institutional Review Board of Central Michigan University.
1.3. Measures
1.3.1. Demographics questionnaire
The demographics questionnaire asked participants about age, gender, race, and ethnicity. These variables were collected for the purpose of describing the characteristics of the sample but not for data analyses.
1.3.2. Angling risk task
The Angling Risk Task (Pleskac, Citation2008) is a risk-taking behavioral measure in which examinees are asked to catch fish on a computer. The task includes a visual display of a pond with uncaught fish represented as dark circles. Each turn the participant must choose to cast their line by clicking the corresponding button, which selects and catches a fish for them, or to collect their winnings for the round and move on to the next round. Catching a red fish earns the subject points while catching a blue fish results in points lost. At any point, the subject has the option to discontinue the trial and keep the accumulated winnings. The subject catches one red fish at a time to accrue money; however, when he catches the single blue fish in the virtual pond, the trial ends and the subject loses all money they have earned for that trial. Each participant earns winnings in a tournament consisting of 30 trials. In this measure, high scores are hypothesized to reflect an “optimal level” of impulsivity, while low scores are hypothesized to reflect both low impulsivity and high impulsivity: those with low impulsivity are hypothesized to produce low scores because they will be risk-averse and make fewer casts per round, whereas those with high impulsivity will produce low scores because they will cast too much and lose their winnings by catching blue fish. The highest scores will be obtained by examinees who have an optimal level of impulsivity, who choose to cast frequently but are able to assess risk as the number of fish in the pond dwindle. This task takes approximately thirty minutes to complete.
1.3.3. Minnesota Multiphasic Personality Inventory-2-Restructured Form (MMPI-2-RF)
The MMPI-2-RF is a self-report clinical personality measure designed to evaluate a wide range of characteristics relevant to mental health. Its item pool is derived from the larger MMPI-2 item pool, a previous version of the test, and consists of 338 items. Although it consists of many scales (9 validity scales, 3 Higher-Order (H-O) Scales, 9 Restructured Clinical (RC) Scales, 23 Specific Problem (SP) Scales, 2 Interest Scales, and 5 Personality Psychopathology Five (PSY-5) Scales), only elevations on a few of them are related to impulsivity: BXD, RC4, RC9, and DISC-r (Ben-Porath, Citation2012). The interpretation manual for the MMPI-2-RF instructs clinicians to interpret high T-scores on these scales as indicating impulsivity. Analysis
The rationale, method, and hypotheses for this study were preregistered with the Open Science Framework. More information about this project can be found at: https://osf.io/93uen
2. Results
2.1. Data screening
Data screening consisted of two steps to remove invalid profiles before additional analyses were performed. MMPI-2-RF profiles were first screened and excluded on the basis of cutoff scores as recommended by Ben-Porath and Tellegen (Citation2011). Scores that met the following cutoffs were considered invalid: Cannot Say score ≥18; VRIN-r (Variable Response Inconsistency) score ≥ 80 T; TRIN-r (True Response Inconsistency) score ≥ 80 T; F-r (Infrequent Responding) score ≥ 120 T; Fp-r (Infrequent Psychopathology Responses) score ≥ 100 T; Fs-r (Infrequent Somatic Responses) score ≥ 100; FBS (Symptom Validity) score ≥100; RBS (Response Bias Scale) score ≥ 100; L-r (Uncommon Virtues) score ≥ 80; or K-r (Adjustment Validity) score ≥ 70 (Ben-Porath & Tellegen, Citation2011). Next, data were screened for low effort on the Angling Risk Task, operationalized as a failure to cast at least once on any of the 30 trials. No cases were excluded on the basis of the Angling Risk Task criteria. Profiles that exceeded validity cutoffs were removed from the dataset before calculating analyses, leaving a sample of 173 cases.
2.2. Descriptive statistics
For the valid 173 cases, raw scores on the MMPI-2-RF scales were converted to T-scores. Means and standard deviations for this sample’s Higher Order (H-O) and Restructured Clinical (RC) scales are presented in . Overall, means on H-O and RC scales ranged from 50.92 (RC2) to 59.23 (RC1), indicating that the sample overall was close to the normative T-score mean of 50.
Table 1. Mean H-O and RC T-Scores for Remaining Sample
Means and standard deviations for Angling Risk Task criteria were also computed and are presented in . On average, participants successfully ended a trial without catching the blue fish in approximately 18 of 30 trials. In rounds in which the player opted to end the round and was not forced to do so by accidentally catching the blue fish, participants casted an average of 43 times per round. The mean and standard deviation of this Adjusted Art Score is comparable to that of a previously reported study (Pleskac, Citation2008), Cohen’s d = .25. The average amount of money earned per participant was $7.12, transformed from an average total fish caught of 712 fish.
Table 2. Mean Scores for Angling Risk Task
2.3. Inferential statistics
First, T-scores on BXD were expected to be significantly and curvilinearly related to winnings accumulated on the ART. This hypothesized relationship is illustrated in . A Pearson correlation was performed to determine if there was a monotonic relationship between the two variables of interest, total winnings on the Angling Risk Task and BXD T-scores. Consistent with previous research, the correlation was not significant, r(171) = .006, p = .934. Polynomial regression was conducted to see if there was a quadratic relationship between winnings earned on the Angling Risk Task and BXD as measured by the MMPI-2-RF. Again, when the linear term of BXD was entered in the model, it did not significantly explain variance in winnings earned, R2 = .000, F(1, 171) = .039, p = .843. When the quadratic term was added to the model, it did not add a significant amount of variance over and above the linear term, ΔR2 = .002, ΔF(1, 170) = .323, p = .570. The overall model was not significant, R2 = .002, F(2, 170) = .181, p = .834.
Figure 1. Hypothesized Success on Angling Risk Task by BXD T-Score
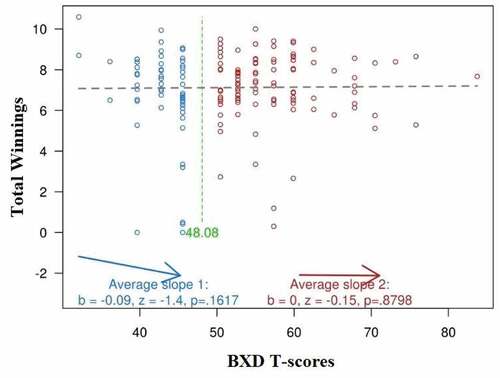
An alternate way to test the shape, strength, and significance of a nonmonotonic relationship is to find the breakpoint of the distribution, run a regression for each segment of the distribution, and run a test of significance for each separate regression line. If both lines are significant and have signs in opposite directions, the relationship can be modeled as a nonmonotonic u-shape or inverted u-shape. Simonsohn’s (Citation2018) two-lines test uses a “Robin Hood algorithm” to find a breakpoint of the distribution that maximizes the power of the statistical test on each side. To do so, the algorithm sets a breakpoint by identifying the weaker line of the two and adding more observations to the weaker side (robbing from the rich) to increase its statistical power.
The relationship between T-scores on BXD and winnings accumulated on the ART was expected to successfully meet the criteria of the two-lines test, indicating a nonmonotonic relationship between the two. Applying the procedures recommended by Simonsohn (Citation2018), a BXD T-score of 48.08 was determined to be the breakpoint of the distribution. Within the bottom part of the BXD distribution, the regression slope was negative but not significant (b = −.09, z = −1.36, p = .17), whereas across the top half of the BXD distribution, the slope was flat and not significant (b = .00, z = −.25, p = .80). The slopes of the two lines were not significant and did not have different signs, so the criteria for a nonmonotonic relationship were not met. The graphical output of the two lines test is presented in . Both polynomial regression and the two-lines test agree that the nonmonotonicity hypothesis was not supported.
Figure 2. Graphical Output of the Two Lines Test, Total Winnings Regressed on BXD
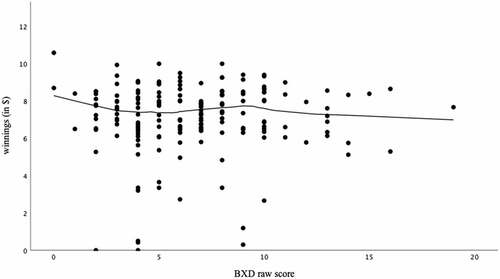
The manifest lack of the hypothesized curvilinear relationship is also illustrated in , in which a LOESS (locally estimated scatterplot smoothing) curve is superimposed on the relationship between BXD raw scores and ART winnings. As portrayed in the segmented regression, there is no substantial decrement in ART performance from the middle of the BXD distribution at either tail; if anything, the locally weighted curve favors examinees with the lowest scores on BXD.
Figure 3. Locally Estimated Scatterplot Smoothing Curve Superimposed on ART Winnings (in $) as a Function of Raw Scores on BXD
It is possible that among the MMPI-2-RF measures of externalizing behavior, BXD is not the best operationalization of impulsivity. Accordingly, we performed similar exploratory analyses for each of the following MMPI-2-RF measures: RC4 (Antisocial Behavior), RC9 (Hypomanic Activation), JCP (Juvenile Conduct Problems), SUB (Substance Abuse), AGG (Aggression), ACT (Activation), AGGR-r (Aggressiveness-Revised), and DISC-r (Disconstraint-Revised) to determine if any of these scales conformed to the nonmonotonic relationship hypothesized. The results of the two-lines tests are presented in . As one might anticipate given the high intercorrelation among these scales, many pairs of which share items, none of the other conceptually related MMPI-2-RF scales showed the hypothesized nonmonotonicity either.
Table 3. Zero-order Correlations and Regression Slopes from the Two Lines Test Regressing ART Variables on MMPI-2-RF T-Scores
3. Discussion
The current study examined the bipolarity of the BXD scale of the MMPI-2-RF by examining the relationship between scores on BXD and performance on an impulsivity task, the ART. First, we examined the descriptive statistics obtained by the completed MMPI-2-RFs and ARTs. Mean scores for H-O and RC scales were between a T-score of 50 and 60, congruent with results from other studies involving college students. BXD, the MMPI-2-RF scale in question for this study, had a mean T-score of 51.81 (SD = 8.65), which is comparable to the normative sample. Likewise, the Adjusted ART score in this sample was like that of a previously reported college sample (Pleskac, Citation2008). Based on this evidence, we believe the current dataset is an appropriate representation of both MMPI-2-RF and ART scores.
The observed linear correlation between MMPI measures of impulsivity and ART performance was consistent with meta-analytic evidence (e.g., Cyders & Coskunpinar, Citation2012) that laboratory measures and self-report measures of impulsivity do not possess substantial linear relationships. Our study suggests that the absence of linearity does not mask a curvilinear relationship either.
First, polynomial regression was used to test the hypothesis that T-scores on BXD would be significantly and curvilinearly related to winnings accumulated on the ART. The linear trend was not significant (r = .02) in the first step, in which total winnings was regressed on BXD scores. However, contrary to expectations, addition of the quadratic term in the second step of the regression did not produce a significant result either.
Second, T-scores on BXD and winnings accumulated on the ART were expected to successfully meet the criteria of the two-lines test, indicating a nonmonotonic relationship between the two. The line before the breakpoint was not significant (and in the negative direction besides); the line after the breakpoint was also not significant and had a flat slope. Exploratory analyses failed to uncover nonlinear relationships between ART performance and MMPI-2-RF scores on any other conceptually related scale.
3.1. Limitations and conclusions
Several key limitations deserve mention. First, this study was limited in its design by making use of a college student sample. BXD T-scores in this sample ranged from 32 to 84. Although the mean T-score for BXD (M = 51.81) is relatively close to that of the MMPI-2-RF normative sample (M = 50.00), the standard deviation of BXD in this sample is slightly smaller (SD = 8.65) than that of the normative sample. This indicates that the present sample may not have been sufficiently variable to detect the expected nonlinearity. On the other hand, the key segment of the impulsivity distribution, i.e., extremely low levels, might be expected to be represented quite well in a sample drawn from a general college student population.
A related concern is that aside from the Corey et al. (Citation2018) study, in which the apparent nonmonotonicity was quite subtle, there were no previous studies from which defensible hypotheses about expected effect size could be estimated. Accordingly, power may have been entirely inadequate for detecting nonlinear effects. Although the LOESS curve in provides no hint of the anticipated inverted U-shape, it must be acknowledged that larger samples (or meta-analytic aggregates) will provide more definitive tests of nonmonotonicity.
Most importantly, the ART task may not have been sufficiently potent to elicit curvilinearity in the impulsivity–performance relationship. Although the task was chosen specifically for its success paradigm, it may not have been an adequate analog to the Corey et al. (Citation2018) study, in which consequences of occupational decision-making can literally mean life or death. Although the ART measure can be administered under a variety of other task parameters that might raise its intensity (e.g., a “catch and release” condition in which the virtual fish was returned to the pond each turn, leaving a probability of 1 in 128 of catching the blue fish each turn, or a “cloudy” condition in which examinees are not able to see how many fish remain in the pond), it seems unlikely that these modest variations would have resulted in substantially different results. Instead, nonmonotonicity, if it exists, seems likelier to be found under real-world conditions, where decisional errors are more consequential.
In conclusion, this study found no evidence of a curvilinear relationship between self-reported impulsivity and successful performance on a laboratory task on which high and low levels of impulsivity were expected to be impairing. Although there are good reasons to expect such a relationship, along with intriguing recent supportive findings from a sample of police officers, we did not obtain comparable results within a sample of college students engaged in an analogue task. Successful demonstrations of this theorized effect seem likelier on tasks on which errors are more consequential, and with large samples containing high variability on impulsivity. Although a newer version of the MMPI has since been published, the scales studied here are largely intact on the new MMPI-3, and in any event, the pattern of results observed across MMPI-2-RF scales offers little reason to believe a different pattern would emerge with scale refinement. Dissemination of our study results is provided here to document our unsuccessful effort to detect the expected effect, and to contribute both to relevant literature review and meta-analytic aggregations involving this topic.
Acknowledgements
We are grateful to Kyunghee Han and Reid Skeel for comments on an earlier draft of this manuscript. We thank Cheryl Chakranarayan, Jaclyn Bowes, and Melanie Midkiff for their contributions to data collection.
Disclosure statement
No potential conflict of interest was reported by the author(s).
Data Availability Statement
Participant data and analysis scripts can be found on this paper’s project page on the OSF: https://osf.io/93uen.
Additional information
Funding
References
- Anderson, K. J., & Revelle, W. (1982). Impulsivity, caffeine, and proofreading: A test of the Easterbrook hypothesis. Journal of Experimental Psychology: Human Perception and Performance, 8(4), 614–10. https://doi.org/10.1037//0096-1523.8.4.614
- Ben-Porath, Y. S., & Tellegen, A. 2011. Minnesota multiphasic personality inventory-2 restructured form: manual for administration, scoring and interpretation Original work published 2008. University of Minnesota Press.
- Ben-Porath, Y. S. (2012). Interpreting the MMPI-2-RF. University of Minnesota Press.
- Block, J. H., & Block, J. (1980). The role of ego-control and ego-resiliency in the organization of behavior. In Collins W. A (Ed.), Development of cognition, affect, and social relations (pp. 39–102). Psychology Press.
- Block, J., & Block, J. H. (2006). Venturing a 30-year longitudinal study. American Psychologist, 61(4), 315–327. https://doi.org/10.1037/0003-066X.61.4.315
- Carter, N. T., Miller, J. D., & Widiger, T. A. (2018). Extreme personalities at work and in life. Current Directions in Psychological Science, 27(6), 429–436. https://doi.org/10.1177/0963721418793134
- Cohen, J. (1988). Statistical power analysis for the behavioral sciences (2nd ed.). Erlbaum.
- Corey, D. M., Sellbom, M., & Ben-Porath, Y. S. (2018). Risks associated with overcontrolled behavior in police officer recruits. Psychological Assessment, 30(12), 1691–1702. https://doi.org/10.1037/pas0000607
- Cyders, M. A., & Coskunpinar, A. (2012). The relationship between self-report and lab task conceptualizations of impulsivity. Journal of Research in Personality, 46(1), 121–124. https://doi.org/10.1016/j.jrp.2011.11.005
- Pleskac, T. J. (2008). Decision making and learning while taking sequential risks. Journal of Experimental Psychology: Learning, Memory, and Cognition, 34(1), 167–185. https://doi.org/10.1037/0278-7393.34.1.167
- Simonsohn, U. (2018). Two lines: A valid alternative to the invalid testing of u-shaped relationships with quadratic regressions. Advances in Methods and Practices in Psychological Science, 1(4), 538–555. https://doi.org/10.1177/2515245918805755
- Yerkes, R. M., & Dodson, J. D. (1908). The relation of strength of stimulus to rapidity of habit-formation. Journal of Comparative Neurology and Psychology, 18(5), 459–482. https://doi.org/10.1002/cne.920180503